
In today’s post:
✅ In the Weekly Review, I wrote “There’s A Time For Everything — Then It’s Gone.”
✅ Markets are now *in motion* and “OUTATIME”.
✅ Updates on ALL major themes we’re tracking.
✅ Our *PLAN* going forward…
STOCKS
On July 16, I wrote:
There was a time in this rally to play every opportunity — this is not the time anymore.
I’m not adding new money to stocks here.
I’m gradually AND carefully taking money out of the market (raising cash).
On balance, I’m CONCENTRATING exposure in higher quality stocks.
If you’re in the business of allocating capital (like I am), I think we may see better prices into later Q3.
In the same post, I added:
Remain focused on quality Tech, still holding MAG7 and Large-cap names.
Over time, think the rally NARROWS to these names which are still working and have some potential upside.
Pundits will say Stocks are narrowing ‘and it’s bearish’ — but it won't matter (until it does).
Pundits will say Stocks are ignoring Rates, Dollar, Tariffs — but it won't matter (until it does).
Remember: Equities are the “last to get the memo”. S&P and NDX almost always top LATER than everyone expects — this is key to remember.
Here is where we stand right now:
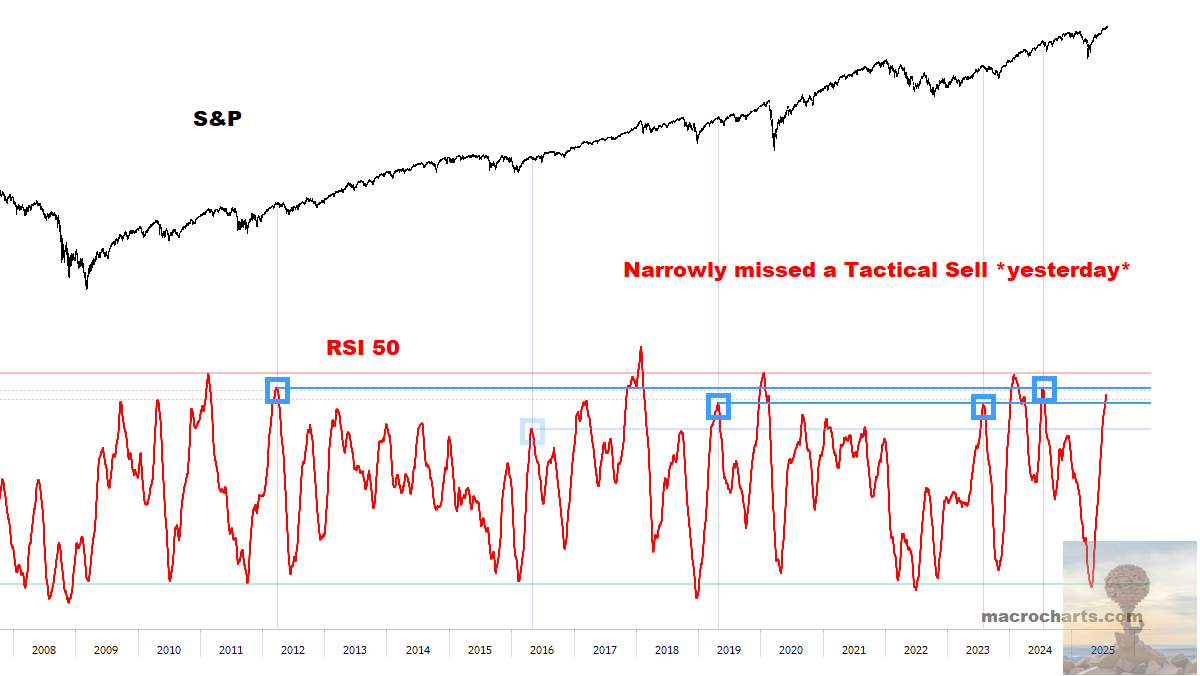
Momentum is still climbing but ALMOST triggered a Tactical Sell in S&P and NDX yesterday.
Today’s gap up keeps the ball rolling, but momentum remains in ideal range for a potential Tactical Top.
IF/WHEN this turns DOWN, we will DOWNGRADE our Equities Trend Rank / Risk Monitor to NEUTRAL for the first time since the April bottom.
This means the *conservative base case* estimate would be a flat 3-Month range for Stocks developing (with one or more sharp declines).
Ultimately as discussed, based on historical patterns think a decline of 10% could be on the table.
Again, it doesn’t mean “Sell everything” — but consider / prepare for a sideways range, (1) selling Calls to collect premium against core portfolio positions, (2) buying some downside protection, (3) raising cash out of high-beta exposure, (4) doing nothing and look for good Buys on the other side — whatever works within your framework.
As before: monitoring when Core Models trigger Sell, and will update to subscribers.
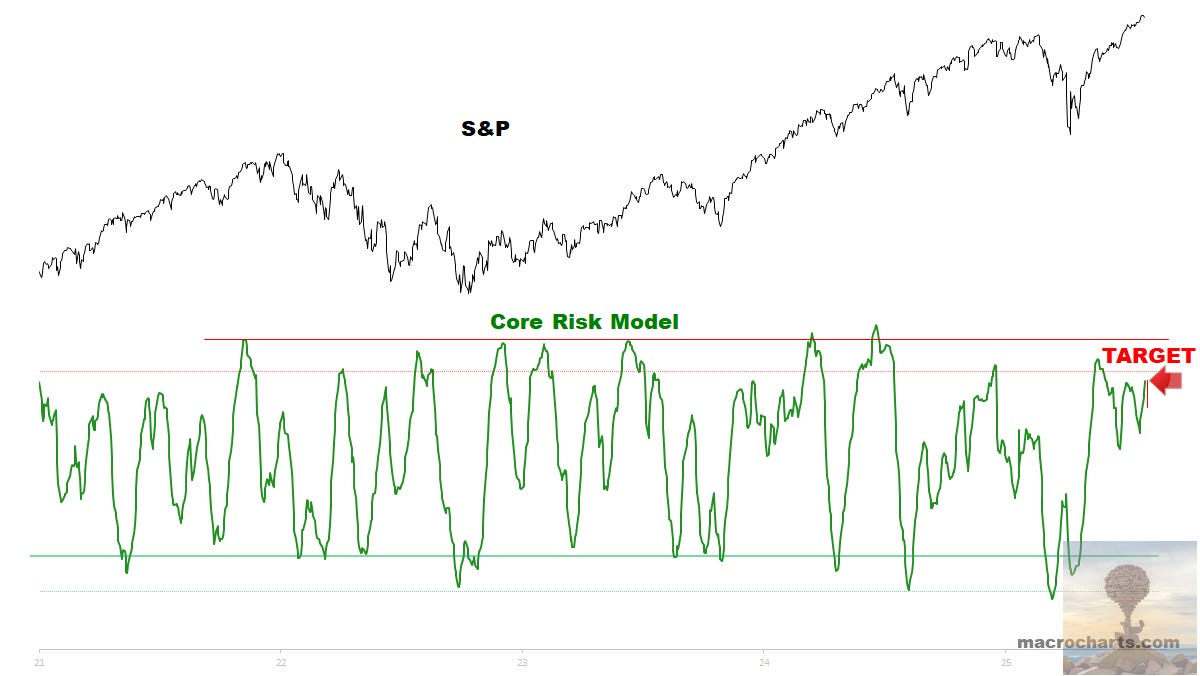
Additionally:
As I’ve been saying — “don’t underestimate how quickly Core Models could get overbought here.”
Below, the red vertical line shows the increase in Core Risk Models after just three days this week:
The model is going vertical now — “precisely on schedule” (as Dr. Emmett “Doc” Brown liked to say):
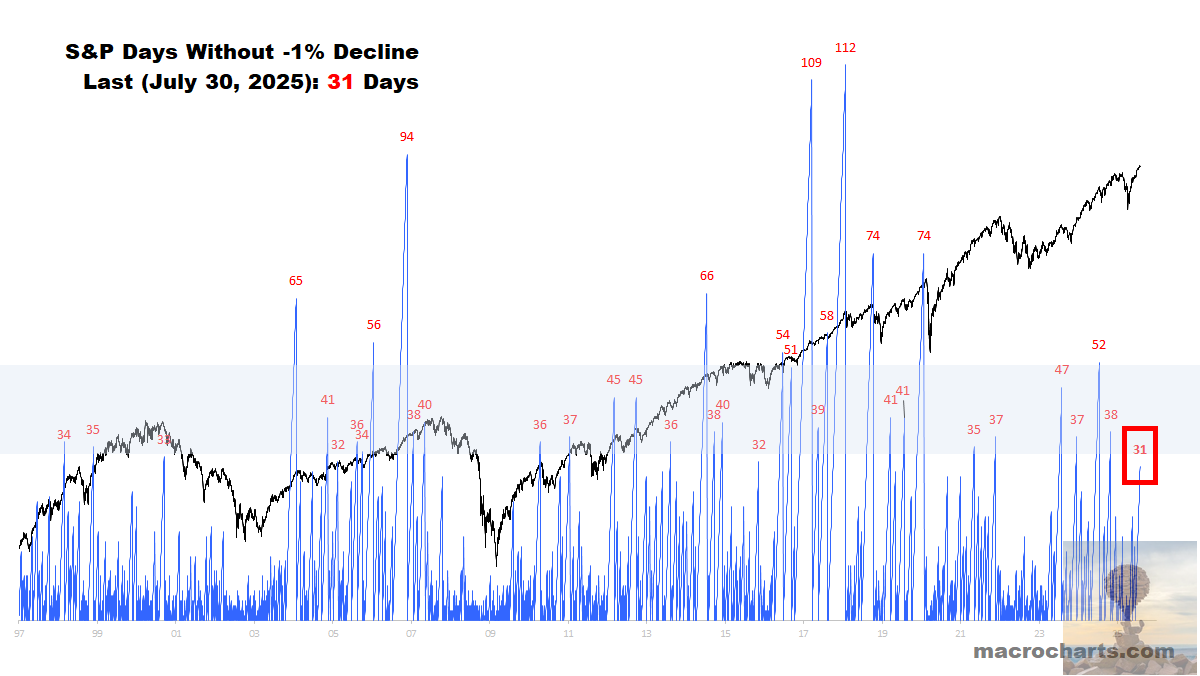
Simultaneously, it’s time to dust off the trusted VOLATILITY CLOCK, also known as “Easy Mode” / “Good Times Are Killing Me” indicator:
*Old subscribers know this one well, but let’s discuss anyway…
(1) Low-Volatility days are the workhorse of Bull Markets — easy conditions feed on themselves, creating a positive loop propelling stocks higher.
(2) Eventually this loop ends, and historically the first -1% down day tends to mark a tactical shift.
(3) It’s not perfect, but when Volatility is in position to shift AND Core Models are near Sell position (such as now), it’s something to pay close attention.
UPDATED PROJECTIONS / ESTIMATES
Based on what we’re seeing right now (*subject to change*):
I began writing this report on Wednesday after the FOMC announcement, before the market closed and META/MSFT reported blow-out earnings — and this was my initial bullet point:
“Based on the current trajectory of Core Models, we may have a week left in this rally for Core Stocks and S&P/NDX — while bearish divergences get worse and Megacap Tech are the last ones holding up (earnings?)”
Futures reactions after META/MSFT reinforces the notion that the tape continues to narrow / capital is concentrating into the core market stocks (getting pulled from everywhere else):
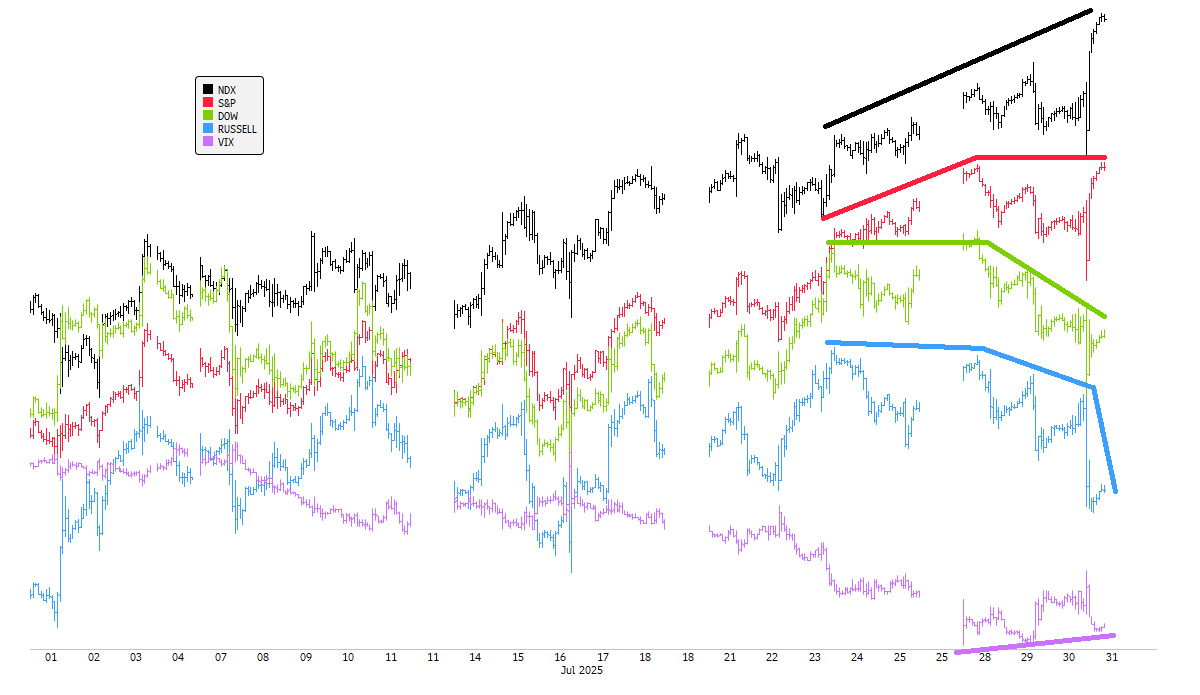
This dynamic could continue for a while longer. As I wrote on July 16, “remain focused on quality Tech, still holding MAG7 and Large-cap names / think the rally NARROWS to these names which are still working and have some potential upside. Pundits will say Stocks are narrowing ‘and it’s bearish’ — but it won't matter (until it does).”
*Watch what happens today, because AAPL and AMZN also report earnings.
Meanwhile, by our estimates it looks like almost 40% of stocks have already topped/rolled over. This is very important to monitor as we move forward, because I think the deterioration could continue — and cutting what’s no longer working is ESSENTIAL at this stage. Risk management is key here.
We’ll update the full list in the next report, but as of now ~40% of Core Watchlist stocks have likely peaked, or are on the cusp of rolling over. Just this week CSCO and FTNT are now rolling down, SOFI finally made a new all-time high (which was the “max” target) and immediately reversed, while Quantum and former high-flyers are all beginning to break down (even with the overnight pop, they display clear rollovers and active Sells).
Related, if core S&P/NDX can hold up a bit longer even though most names “checked out”, then Bitcoin (which remains highly correlated with NDX) could have room for one more push to ideal breakout targets — maybe in the 140-150k range. Those targets would likely push Bitcoin Models to overbought / Sell range as well. We’ll continue to track and update this closely.
ADDITIONAL CHARTS OF INTEREST
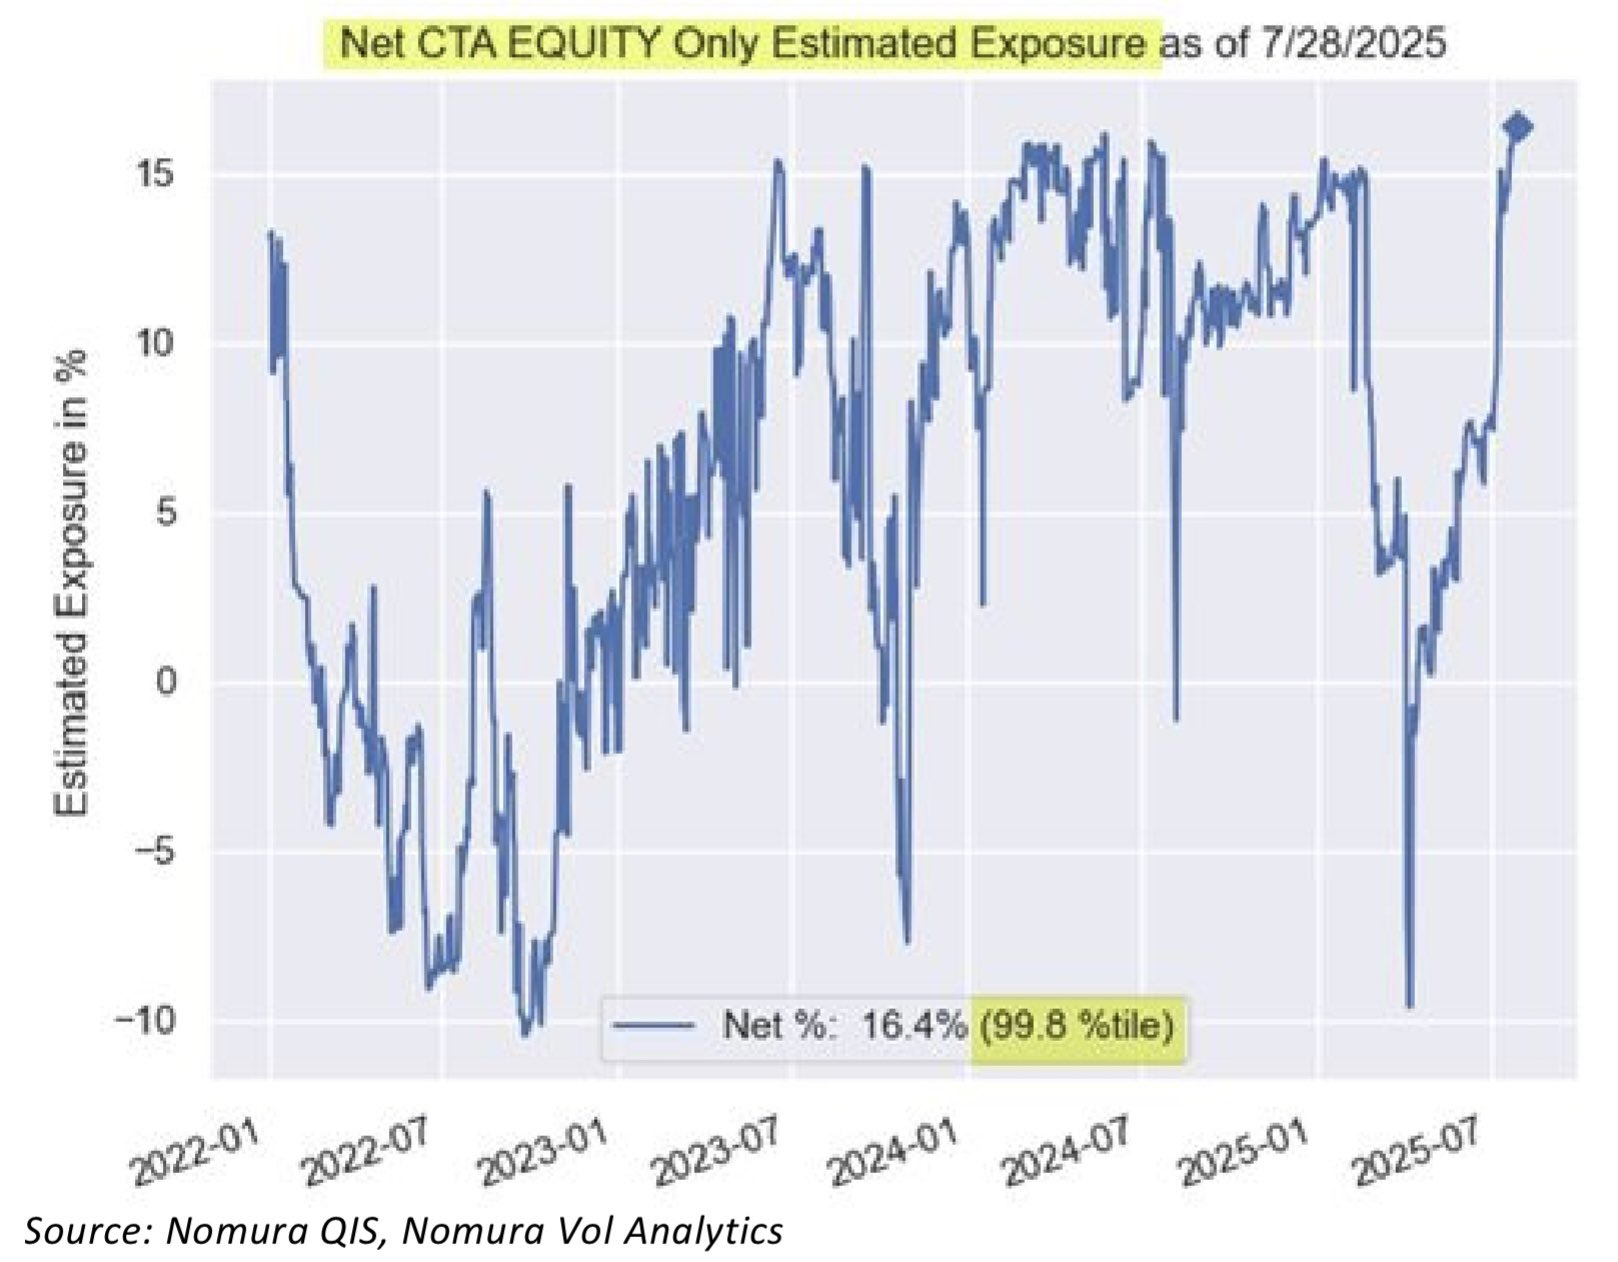
Below, Nomura estimates CTA positioning is at the highest in nearly five years (99.8%ile).
Not shown, estimates for Vol Targeting funds shows they have room to buy stocks (*though I wouldn’t recommend waiting for this to trigger, as they weren’t ‘necessary’ at prior tactical tops).
Below, Natixis estimates that mutual funds have rebuilt high stock exposure, and MAG7 in particular:

UPDATED PLAN
As discussed recently, raised 20% cash from the most extended / High-Beta names.
Accordingly, the equity portfolio Beta was reduced to ~1. Concentrated in “Core Stocks only”, meaning Megacap Tech/Quality/Growth. With the exception of NVDA, no individual holding has a Beta of >1.25. (This is important because as discussed recently, think the risk of a Beta factor unwind is increasing.)
Regarding Bitcoin exposure, if S&P and NDX trigger Tactical Sells in August and/or Bitcoin reaches overbought range, my plan is to take down BTC exposure by at least half (to 15%). For reference, Bitcoin was down -32% in Q1, versus a -26% drop in NDX, -29% drop in XLK, and -37% drop in SMH. Bitcoin’s decline was roughly the same as Tech, and think this correlation continues.
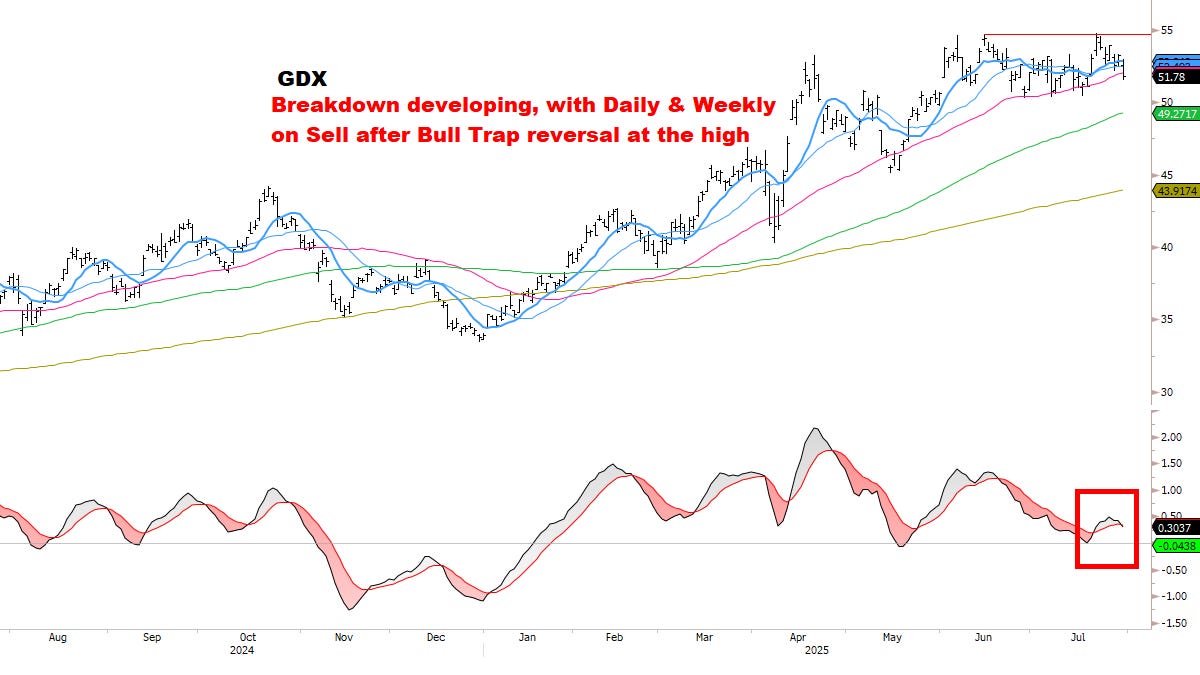
Yesterday we initiated Core Long USD and a Tactical Short GDX.
IF the next few months see the Dollar rally 4-5% to ideal targets while GDX drops 15-20%, this could be enough to almost fully protect the Core Equity portfolio (currently ~40% long) from a decline of as much as -15%. So these positions have the potential to work as a decent hedge. But in this scenario, they would only be able to protect the Equity book, not the Bitcoin position.
(These are my rough estimates for the moment, again not a forecast, but thinking about moving parts and how they could fit in a portfolio framework.)
Going beyond, if we get Tactical Sells for S&P/NDX in August, I am thinking of adding downside Puts — which I’ve mentioned before and consider a reasonable “cost of doing business” for Q3.
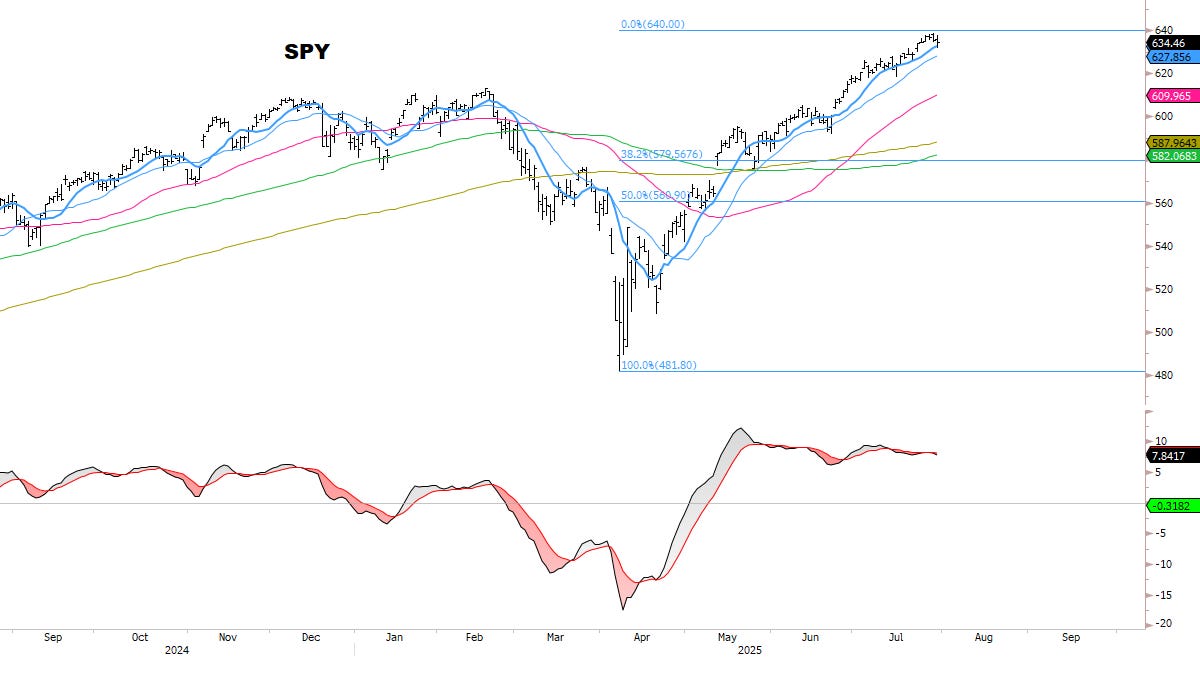
I’ve been looking at SPY 610 Puts for 10/17, which may trade with a $6 handle soon — if not today. They seem like a fair hedge.
Why? Based on historical patterns, let’s look at some realistic/potential downside targets:
IF SPY tops in the ~640-650 range, think ~580 could be seen at some point later this year. This would be a peak-to-trough decline of 9-10%, nothing abnormal or extreme. It would also be a slight undercut of the 200dma, setting up *potentially* the 2nd best buying opportunity of the year:
If the market melts up into year-end with minimal pullbacks, then the Puts were a cost-of-doing-business. No problem.
Alternatively, if the market DOES correct to that range (before October expiration), the Put position would be an absolute massive winner. And would give the portfolio an *extremely strong hand* to position aggressively Long in Core Watchlist names on the other side. So I like the potential asymmetry of this scenario. Put spreads could work even better — I’m just sharing the basics today.
Also, I want to pay close attention to how S&P/NDX trade after today’s gap up. Typically, exhaustion gaps get filled within 2-3 days, so if today’s gap gets filled quickly I think the case for a top would begin to build.
I think the probability of NEW gaps getting filled at this stage is high, as part of a topping process developing. Again, based on the confluence of Sell signals potentially converging AT THE SAME TIME, and which we continue to track closely.
Every investor is different, and not every trade is for everyone. Some folks just want to accumulate stocks on pullbacks and never sell, for retirement goals or tax minimization. Some may prefer trailing stops (as we've also been doing) and see how far the market runs the big names. Others may want to raise some cash or add hedges proactively, whatever works for you.
For me, I’m happy with our YTD performance, and I’m just being a bit more tactical here. For the things I look for, and for the stocks I like to Buy, everything looks tired and played out. I don’t chase bad setups or force “meh” trades. So I’m playing tighter, not chasing anything new, avoiding “story stocks”, and carefully raising cash whenever possible.
Key to remember: this is a Bull Market — even if the market corrects at some point, I’m less focused on making big downside bets here, and more focused on buying/adding quality names at good prices.
FX
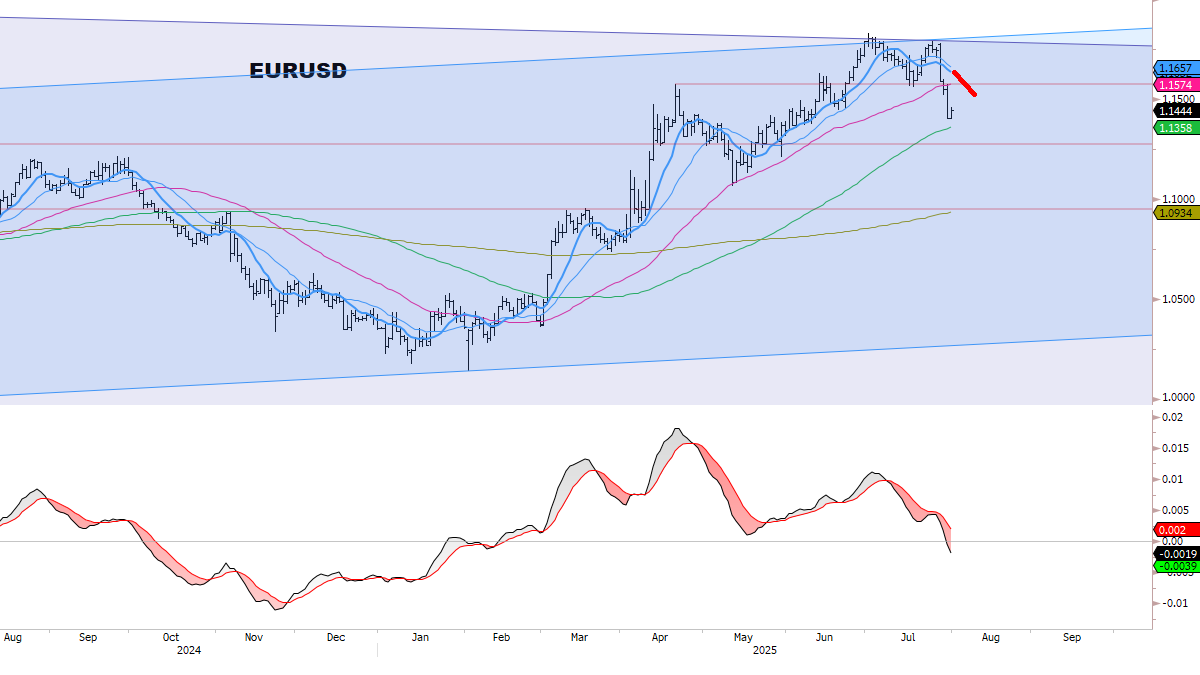
EURUSD: for the duration of this move, lean to sell ANY bounce to 20dma (currently ~1.1650 and falling). May get a short-term pop to 1.1573 one last time, would sell that instantly. Ultimately should target ~1.0985 which is the 50% retracement of this year’s rally and also near the 200dma. (Eventually could go even lower.)
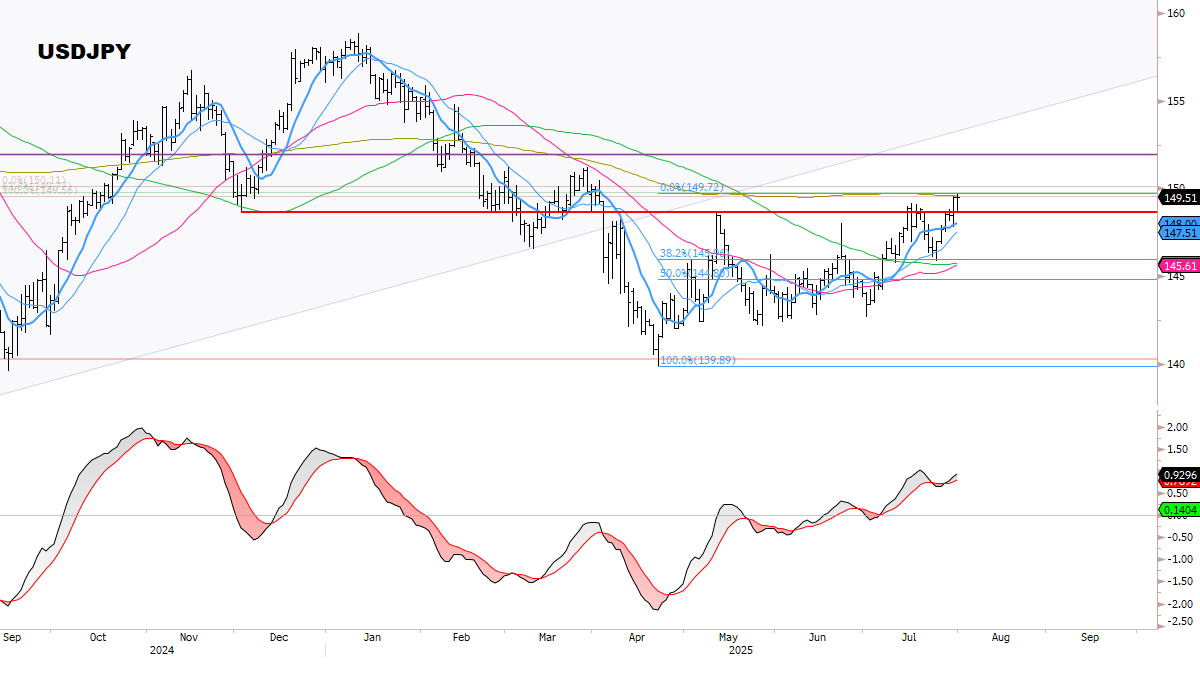
USDJPY: similarly, any pullback to ~146 at this point would be an instant buy/add. Ultimately still think this could still target 155-160+. (Eventually could go even higher.)
USDCHF (no chart): not involved personally (focused on USDJPY and EURUSD for now), but pullbacks to 20dma should also be buyable, ultimately could target 0.8536 which is the 50% retracement of this year’s drop and also near the 200dma. (Eventually could go even higher.)
GBPUSD (no chart): not involved personally (focused on USDJPY and EURUSD for now), but bounces to 20dma should be sold, a retest of the neckline breakdown of 1.3434 would be an instant sell, ultimately could target 1.2945 which is the 50% retracement of this year’s drop and also near the 200dma. (Eventually could go even lower.)
*These are our conservative targets for now, and we’ll revise as we go — as discussed in recent reports, the Dollar could ultimately rally even more than these initial levels. Let the market decide.
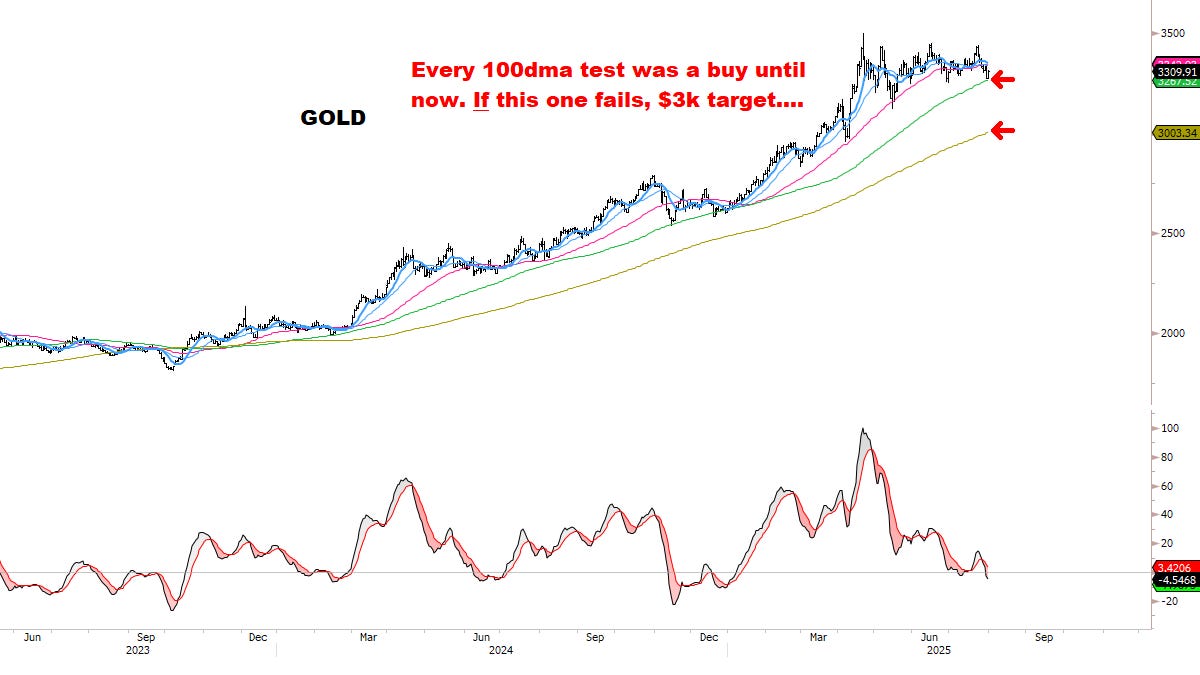
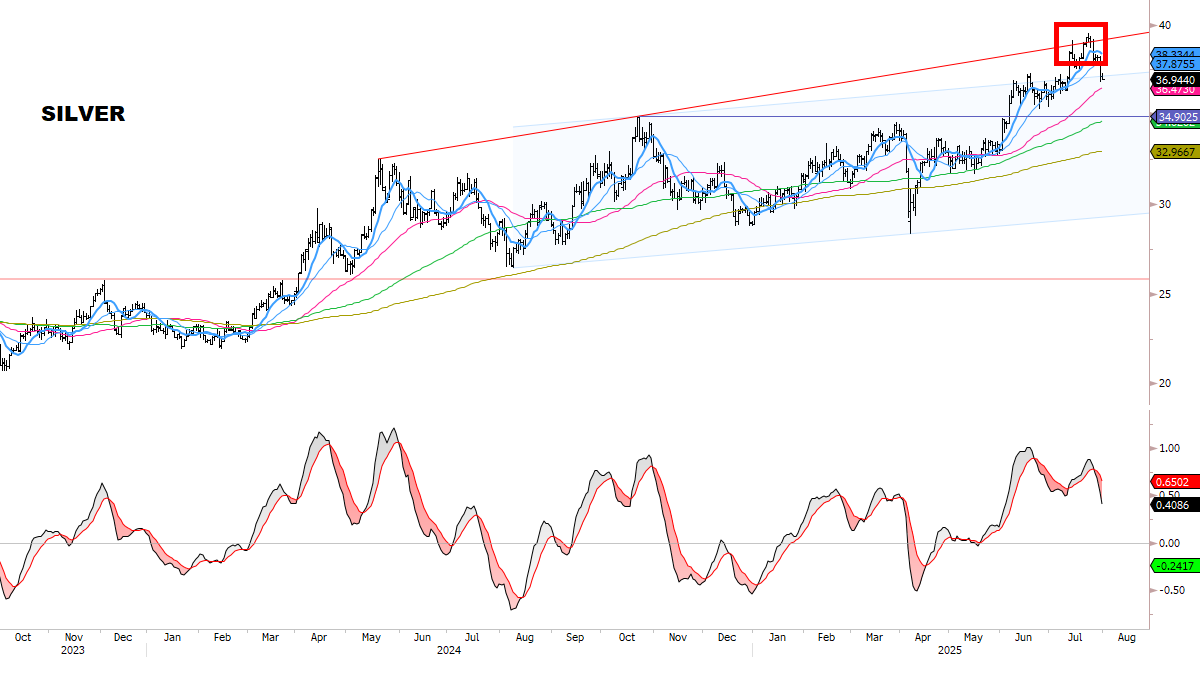
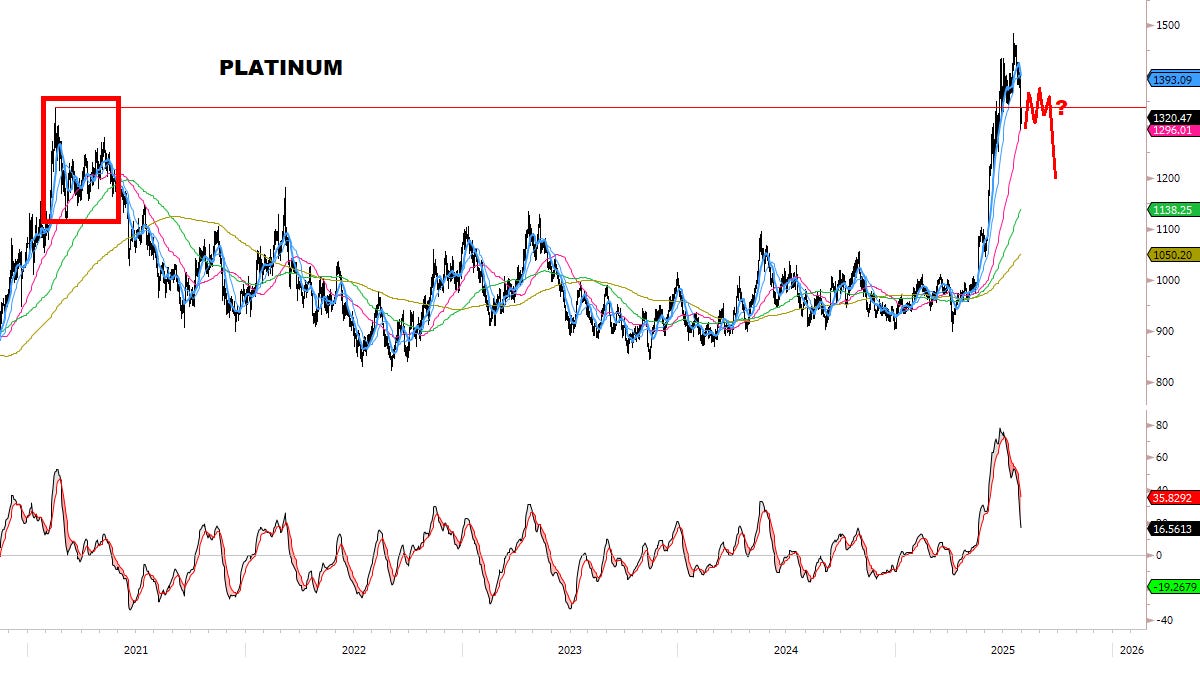
PRECIOUS METALS
Clear failure in the entire group. Silver triggered an exit. Platinum collapsed below the breakout (had almost no follow-through and was a big concern we raised previously).
Weeklies are on Sell, have to be cautious in this space maybe for the rest of the year. (*Remember how many times PMs peaked mid-year and sold off until Nov/Dec… and when the year is over and no one wants them again = Buy).
Continuing to execute the plan:
✅ Monitoring market reaction to gaps as initial clues for a topping range/structure developing.
✅ Monitoring for underlying stock deterioration. Monitoring Megacap leaders in particular for signs of exhaustion — as they reach ideal rally targets, and/or develop rollover Sells.
✅ Monitoring Core Models for Sell signals to proactively hedge the book (“cost of doing business”). *Likely August business*.
✅ Considering adding SPY Put hedges as discussed today.
✅ Monitoring USD for pullback buys within an ongoing, potential multi-week/multi-month uptrend.
✅ As before, the next weeks could be critical — will keep updating conditions with priority as we go.
Thanks for reading.
Onwards and upwards, -MC
*If you enjoyed this report, likes are much appreciated!