Prometheus - Introduction to Prometheus and first steps
 Stopped
Prometheus
1. Introduction and first steps to Prometheus
Introduction
Tools in Data Science require more and more services that need to work together: servers, virtual machines, containers, APIs, applications, ... To ensure smooth running, we need to monitor those services but their growing number enforces the need for an automatic monitoring tool.
Prometheus is a simple monitoring tool developed in 2012 at SoundCloud which is now a free Open Source project supported by the Cloud Native Computing Foundation.
Prometheus is an interesting tool because it is provided with a lot of tools to handle easily a lot of different services. Moreover its PULL mechanism puts the workload on it and not on the services. It is easy to configure and can serve as a monitoring device both for long term service and short-lived jobs. Its AlertManager allows you to configure complex routing systems of notification. Prometheus allows storing multi-dimensional data thanks to a very simple system of labels.
One of the main issue of Prometheus is that it cannot be distributed and therefore is necessarily a bottleneck if it has to monitor millions of services. Yet its APIs make remote writing and reading easy in case we would want a greater capacity.
In this lesson, we will see :
how to use Prometheus to monitor services
how to integrate Prometheus client libraries to provide customized metrics
how to set up the AlertManager to customize reactions to levels of alert
Pay attention: in this lesson, we will have to jump between consoles and web interfaces. Do not hesitate to create new consoles and open ports!
Prometheus first steps
To install Prometheus, we need to download a version from their website and decompress it. In this tutorial, we will install, decompress and built it in the /home/ubuntu/prometheus folder.
To install Prometheus, execute the following commands in the
/home/ubuntufolder
wget -c https://github.com/prometheus/prometheus/releases/download/v2.28.1/prometheus-2.28.1.linux-amd64.tar.gz
tar xvf ~/prometheus-2.28.1.linux-amd64.tar.gz
mv ~/prometheus-2.28.1.linux-amd64 ~/prometheus
You can list the files in this folder by using ls. The one that will be interesting is prometheus.yml. If you are not familiar with the YAML format, please refer to the documentation available here.
Open the file to see its content:
nano prometheus/prometheus.yml
You should see the following content:
# my global config
global:
  scrape_interval:     15s # Set the scrape interval to every 15 seconds. Default is every 1 minute.
  evaluation_interval: 15s # Evaluate rules every 15 seconds. The default is every 1 minute.
  # scrape_timeout is set to the global default (10s).

# Alertmanager configuration
alerting:
  alertmanagers:
  - static_configs:
    - targets:
      # - alertmanager:9093

# Load rules once and periodically evaluate them according to the global 'evaluation_interval'.
rule_files:
  # - "first_rules.yml"
  # - "second_rules.yml"

# A scrape configuration containing exactly one endpoint to scrape:
# Here it's Prometheus itself.
scrape_configs:
  # The job name is added as a label `job=[job_name]` to any timeseries scraped from this config.
  - job_name: 'prometheus'

    # metrics_path defaults to '/metrics'
    # scheme defaults to 'http'.

    static_configs:
    - targets: ['localhost:9090']
This file actually contains the configuration of a Prometheus service. We will get into the details later but we can already see some important keys:
-
global: global Prometheus configuration -
alerting: configuration of the AlertManager (where to find it) -
rule_files: information on the rules that define the alerts -
scrape_configs: configuration of the services to monitor (where to find them)
To make it easier, all the processes will run on the host machine but in a more general case, you should put the full IP address of the system you want to monitor.
Let's exit the file and run a Prometheus server to see how it works (to close a file with
nano, we need to usectrl+x).
prometheus/prometheus --config.file=prometheus/prometheus.yml
Prometheus provides a very interesting user interface. You can open it using the port opening service of our platform available with the button. Open the 9090 port which should redirect you automatically to the /graph endpoint.
You should see the following interface:
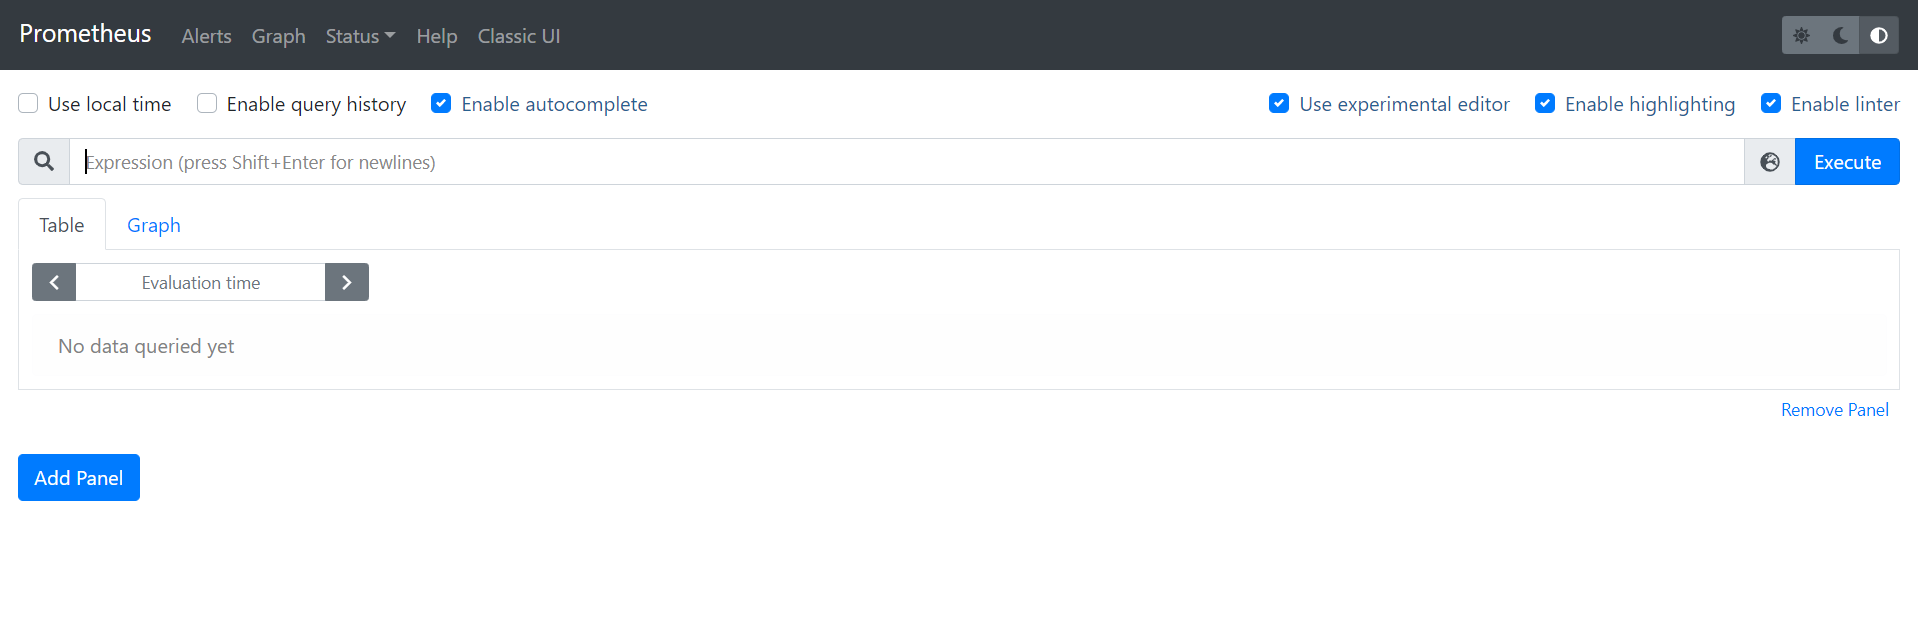
By default, the configuration file prometheus.yml contains enough information to monitor Prometheus itself. We can display data on our Prometheus server by selecting a metrics to monitor. For example, we can display promhttp_metric_handler_requests_total by typing its name (use the auto-completion feature) and clicking on Execute (or hit Enter).
You can select either a Table view or a Graph view with the buttons. In the Graph view, we can tweak the graph to display more specific information.
How does Prometheus work ?
Prometheus is actually made of several components. First we have the Prometheus server. It is composed of a retrieval daemon that will scrape information on the different services that it monitors, a Time Series Database that stores the data from the different services and a HTTP server that deals with queries to the Database and renders the UI.
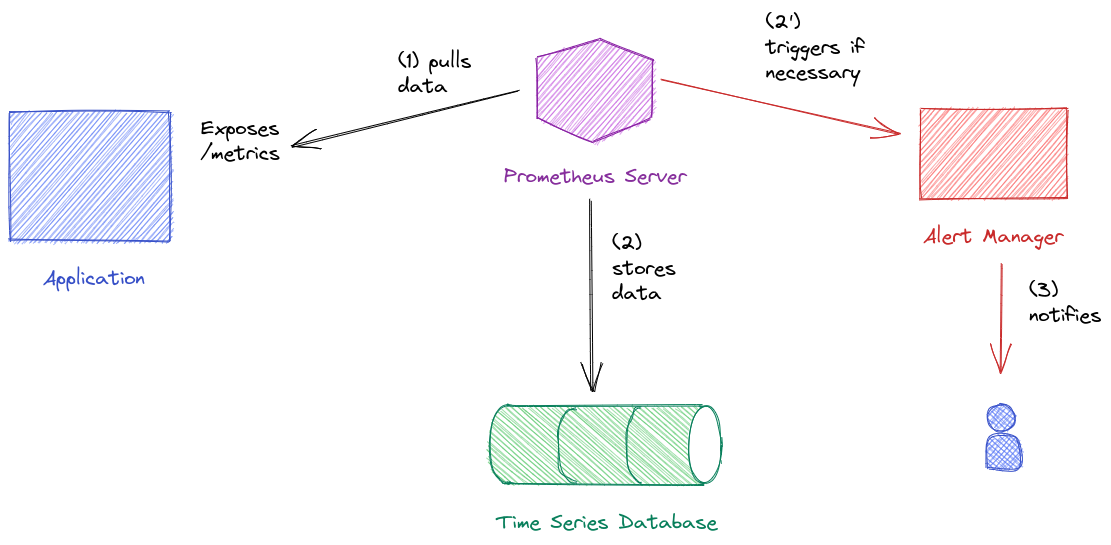
To be monitored, a service will expose an endpoint containing information about the service and the retrieval daemon will scrape this endpoint on a scheduled basis. This information is then stored on disk in the Time Series database.
In our case, Prometheus is displaying information on the localhost:9090/metrics (or using the IP address of the virtual machine if you are working on it http://ip_virtual_machine:9090/metrics) endpoint (if you take the URL of the UI, you can change graph by metrics, to see what it looks like).
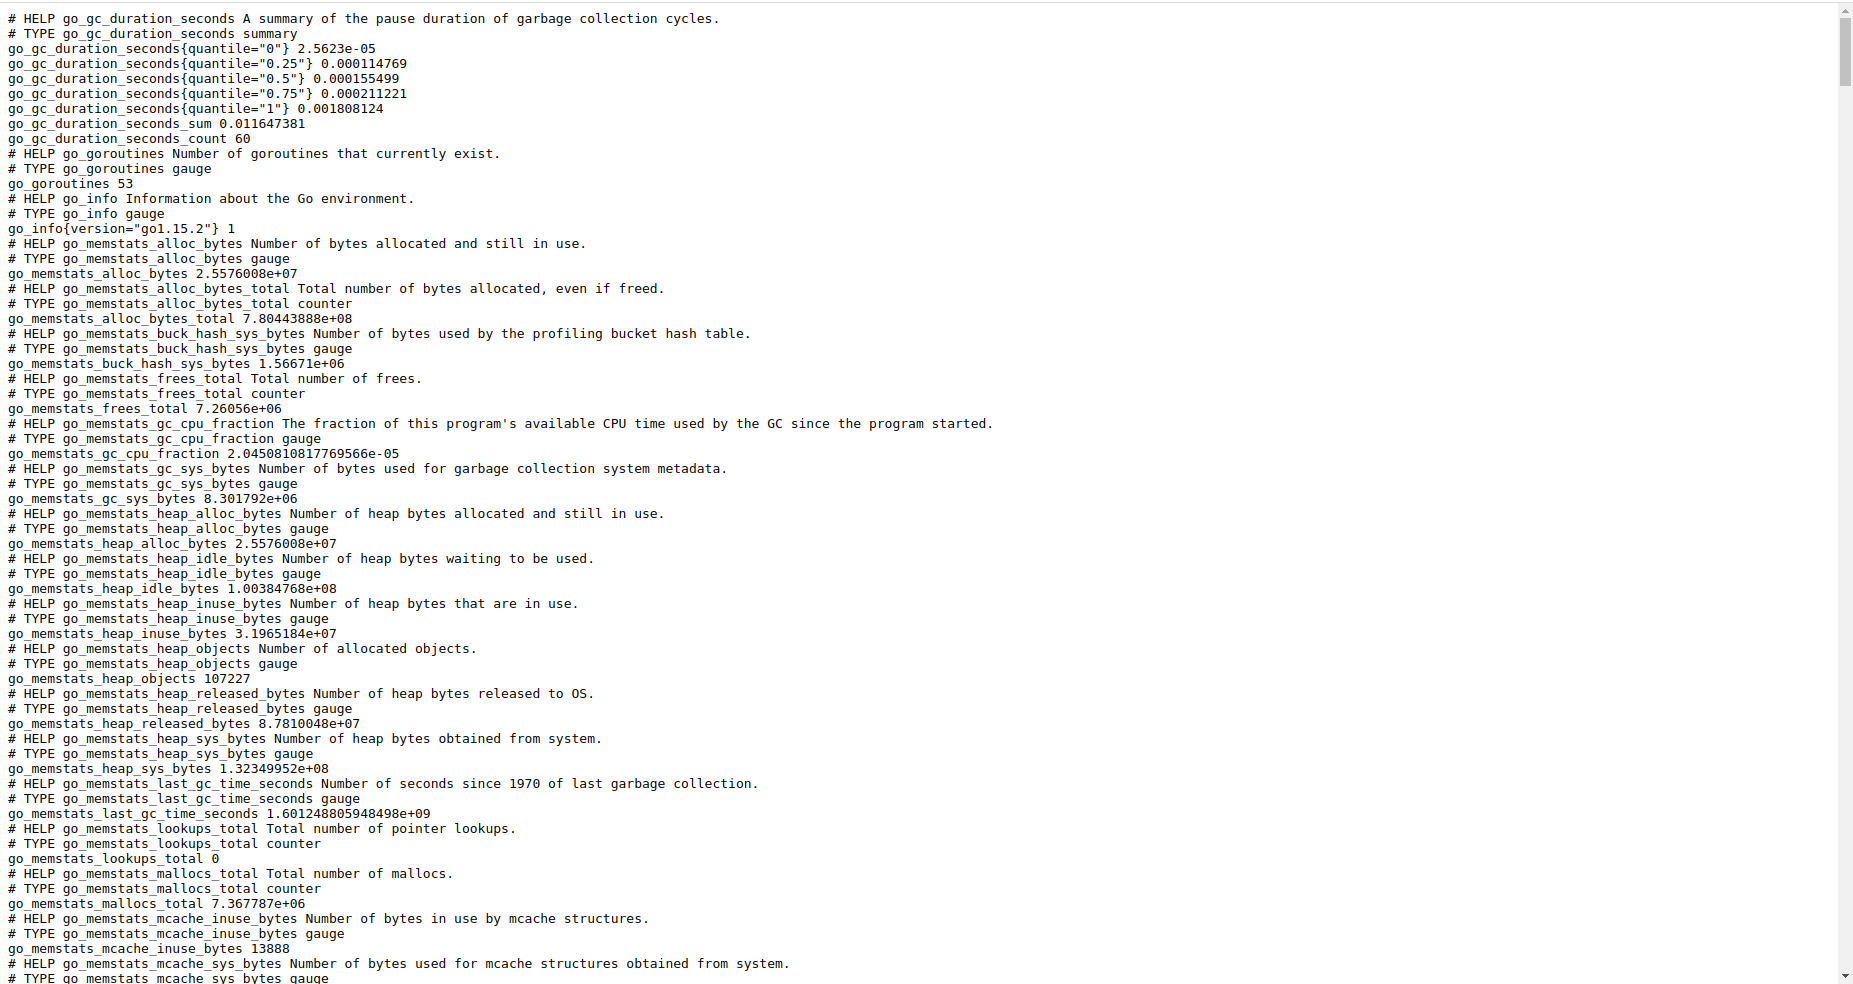
We can see that some lines start with
HELPand other start withTYPE. The first give information on the metrics while the second give the type of the metrics. The other lines are the actual values. We will get to it later when talking about data types and labels.
This means that when we create our services, we will have to specify the information to display and how to display them. Fortunately, Prometheus provides Exporters that will fit in with most of the most used services and therefore do most of the job for us.
Another component of Prometheus is the AlertManager. This daemon is in charge of reacting in case an alert level is reached according to a set of rules. For example, when a server is being monitored, we can define a rule that sets that if the server reaches a certain percentage of its disk capacity, an email should be sent to the system admin. The AlertManager is triggered by the Prometheus Server that interprets the rules given to it.
Finally, the last part is the PushGateway. This is a tool that will deal with short-lived jobs so that they can also provide data.
Data base
Data stored in the Time Series Database is grouped in time series: each time series is uniquely identified by its name. We can also add some optional tags called labels which are a set of key-value pairs to help data retrieval and data aggregation.
You can identify the metrics by using their names and labels as such:
metric_name{label1=value1, label2=value2, ...}
Note that in the configuration file, under the scrape_config key, we have specified with job_name: 'prometheus'. A job is a set of parameters that should be used to monitor one or multiple services. For example, we can have a job named apis. This job can be used to monitor several APIs with the same metrics to monitor. Those services are then called instances.
Instances are in fact designated by the IP and port used : for example 0.0.0.0:1234 while the job name is provided by us.
This is important as by design, job and instance are labels that are automatically assigned to a time series.
The observations are recorded as float64 with a timestamp precise to the millisecond.
Although data is actually stored in undifferentiated types, client libraries will be provided typed data to work with. Those types are listed below:
-
Counter: a data type that can only increase or be reset to 0 (total number of request from the start of the service, ...) -
Gauge: a data type that increase or decrease (temperature, capacity, ...) -
Histogram: a data type that provides information per buckets. For example, if you want to query the duration of request, you can have their counts per bucket of 10s width) -
Summary: a data type that returns the quantiles of a metric.
Data is stored on the disk by chunks of two hours time except for the current time window which is kept in memory. To prevent loss of this chunk in case of a crash, Prometheus uses a Write Ahead Log (WAL).
By default, data is stored at ./data but we can change this folder by using the --storage.tsbd.path flag when launching Prometheus. In this folder, a sub-folder is created for each chunk. The subfolder will contain both meta-information on the chunk and the actual data.
In another console, you can use the tree command in the
ubuntufolder :
tree ./data
Data is eventually compacted in larger block. After a given time, it is simply erased. This parameter is called the retention time. By default, it is set to 15 days but you can change it by using the --storage.tsbd.retention.time flag.
Prometheus database does not use distributed storage which can be problematic. Yet it gives the possibility to read and write data into third-party storage. If you want to learn more on this feature, you can follow this link that provides information on the different easy integration processes.
PromQL
When using the user interface, we can create requests or expressions to return data and optionally plot it. To do so, we need to use PromQL. In this part, we will see the basics of PromQL.
We have seen that we type in the name of a metrics in the UI console. Try to use this again:
prometheus_http_requests_total
You should get a set of key-value. This is called an Instant Vector: for each time series, we get a value for the last instant.
We can use the labels to get more specific information:
prometheus_http_requests_total{handler="/graph"}
There are several operators that we can use:
-
=: to assess equality -
!=: to assess difference -
=~: to match a regular expression -
!~: to not match a regular expression
For example, the following request returns the last value for
prometheus_http_requests_totalwherecodeis in the 200s.
prometheus_http_requests_total{code=~"20."}
Up to now, we have only requested the last value. But we can for more ancient values by using offset.
The following requests returns the same time series but with samples from 10 minutes ago.
prometheus_http_requests_total{code=~"20."} offset 10m
Times are given with a specific writing:
- ms : millisecond
- s : second
- m : minute
- h : hour
- d : day
- w : week
- y : year
To return data from the last 1h30, we can write 1h30m.
We can also want to create a query that will return Time Series but for multiple moments.
For example, this requests return the Time Series for the last 5 minutes:
prometheus_http_requests_total{code="200", handler="/graph"} [5m]
The result is not an Instant Vector but a Range Vector.
We can also use regular mathematical operators to perform mathematical operations.
For example, we can add two time series. The addition will be made time series by time series:
prometheus_http_requests_total{code="200"} + prometheus_http_requests_total{code="200", handler=~"/api/.*"}
Aggregation might be an interesting feature. To perform this, we can use usual keywords (sum, avg, ...). The aggregation is performed on an Instant Vector at a given time.
For example, to get the total number of http requests regardless of the time series, we can do:
sum(prometheus_http_requests_total)
Aggregation can also be made according to certain labels:
sum by (handler) (prometheus_http_requests_total)
If we want to use all the labels except some of them, we can use without instead of by. To learn more on the operators, you can refer to the documentation.
PromQL also offers some predefined functions . Some interesting functions are aggregation functions over time: they are named aggregationFunction_over_time and they take a Range Vector as input.
For example, to return an average value over the last five minutes for different time series, we can do:
avg_over_time(prometheus_http_requests_total [5m] )
To get the list of available functions, you can read the documentation.
Finally, we can also take run queries over queries. For example:
max by (handler) (prometheus_http_requests_total) [20m:1m]
This query returns the maximum of prometheus_http_requests_total per handler for every time window of 1 minute, for the last 20m. It is therefore a Range Vector: we specify [duration:resolution].
We can then perform a query over it:
avg_over_time(max by (handler) (prometheus_http_requests_total) [20m:1m] )
This will return the average of the maximum value of prometheus_http_requests_total for taken every minute for the last 20 minutes per handler.
A word on timestamps
The timestamps of the different time series of an Instant Vector are not necessarily the same. For example, if two services are scraped at different frequencies, the timestamps will not match. Therefore, it returns only the last value. If there are no value available for a time series in the last 5 minutes in regard with the instant we are looking at, the time series is left empty.
Finally, we can note that only queries that return an Instant Vector can use the Graph functionality.
