100+ Charts & Commentary on all major Markets — for your weekend reading.
“Don’t start the week without it”

KEY TOPICS COVERED
In today’s report:
✅ A DECISIVE turn in markets.
✅ The Trillion Dollar Question.
✅ BATTLE PLAN for the Dollar.
✅ Rates screaming “Too Late”…
✅ Commodity Cascade.
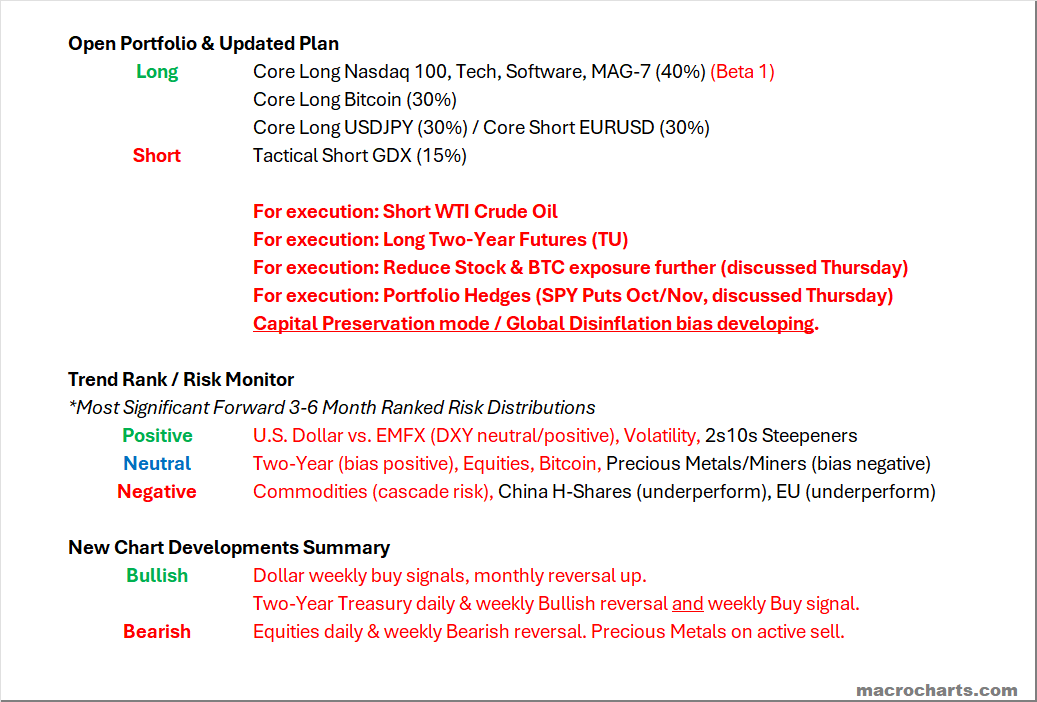
Open Portfolio & Updated Plan
A big inflection point *now underway*.
A LOT of important changes — setting the tone for the whole report:
FULL NOTES:
BATTLE PLAN FOR THE DOLLAR
Buy signals confirmed this week.
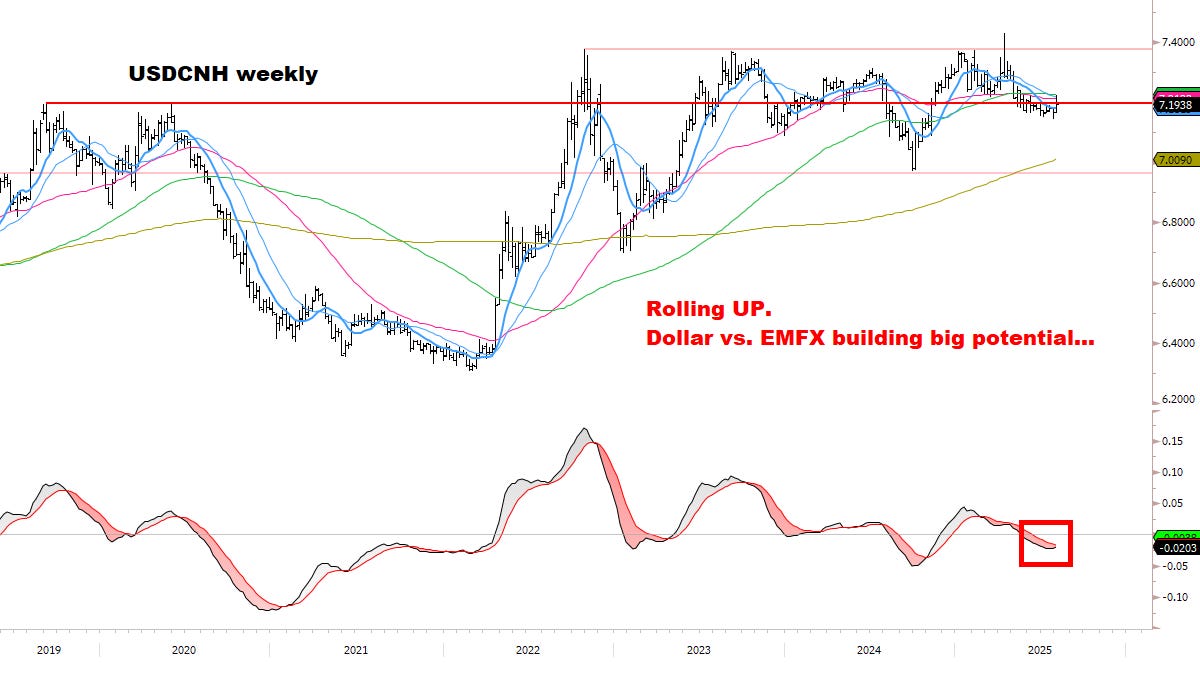
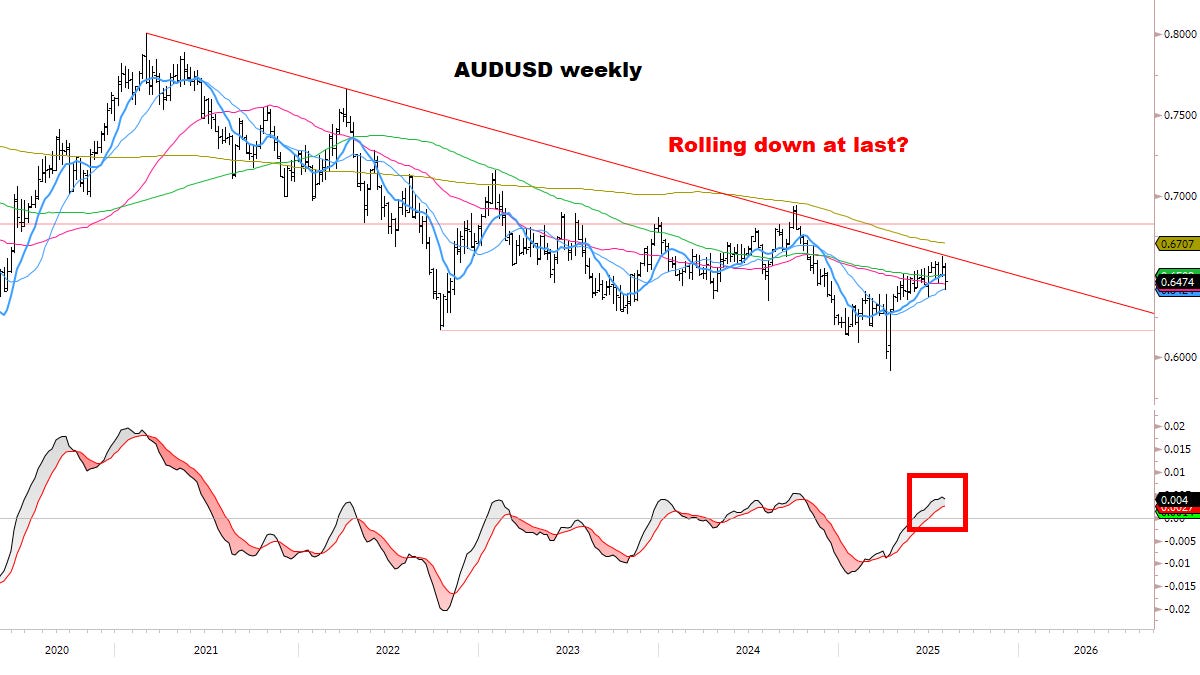
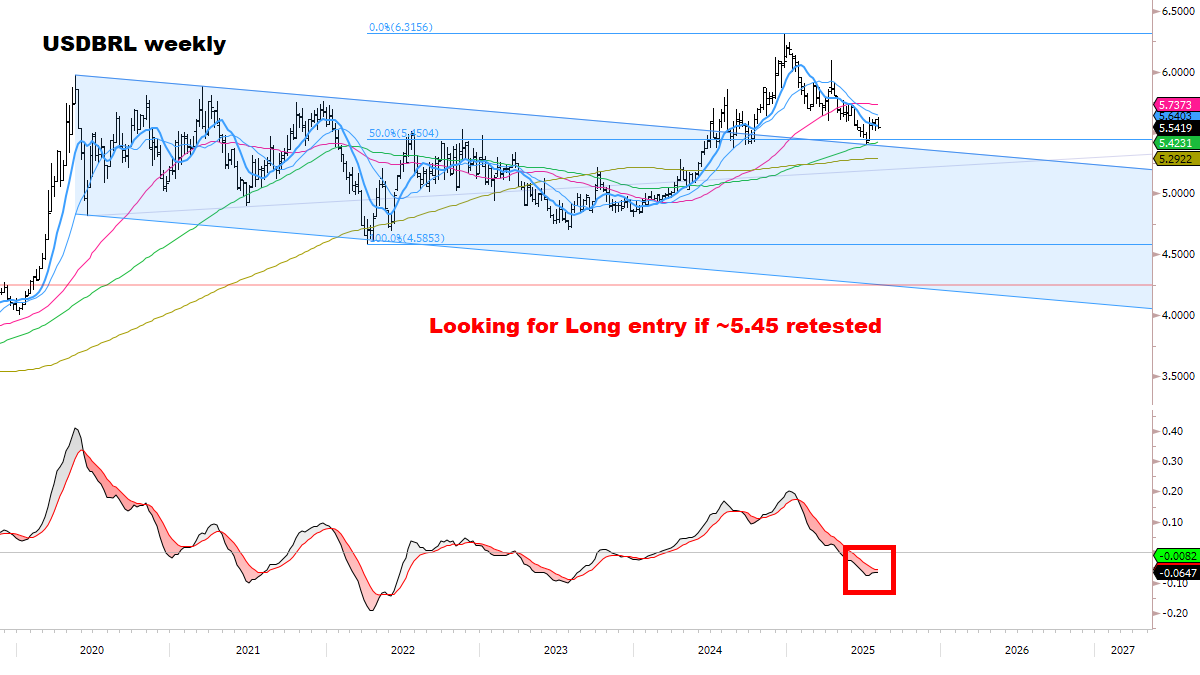
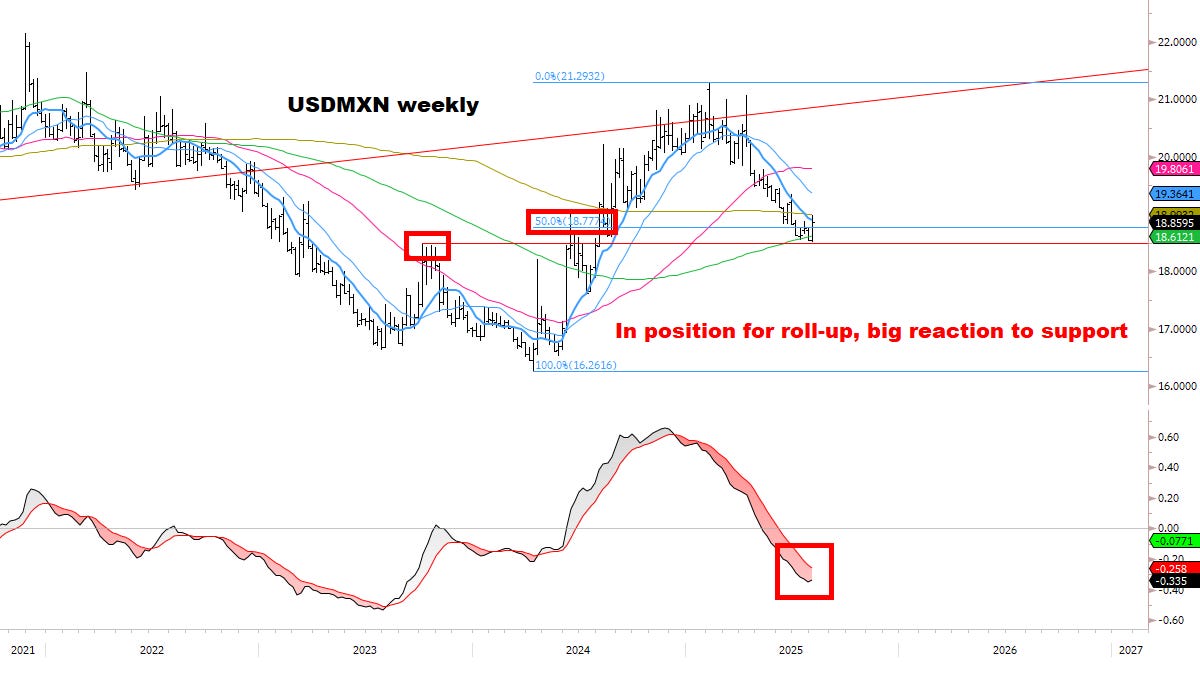
It looks like a classic Dollar rally starting, especially vs. EMFX (USDCNH, USDBRL, USDMXN, and others).
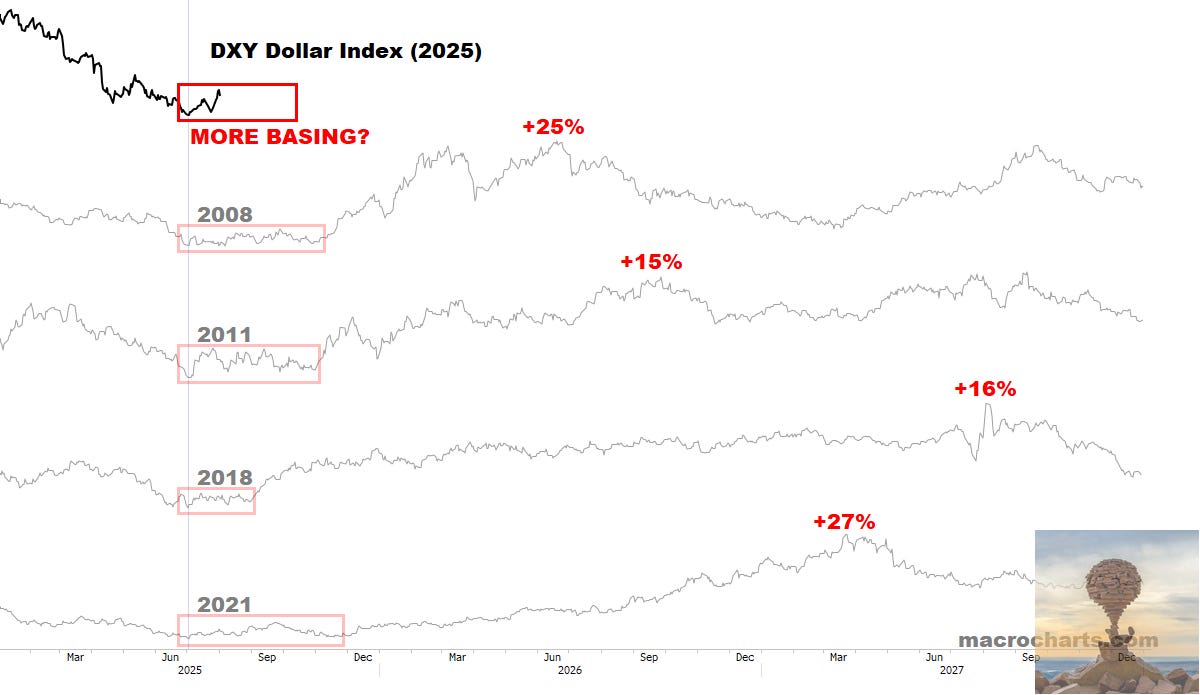
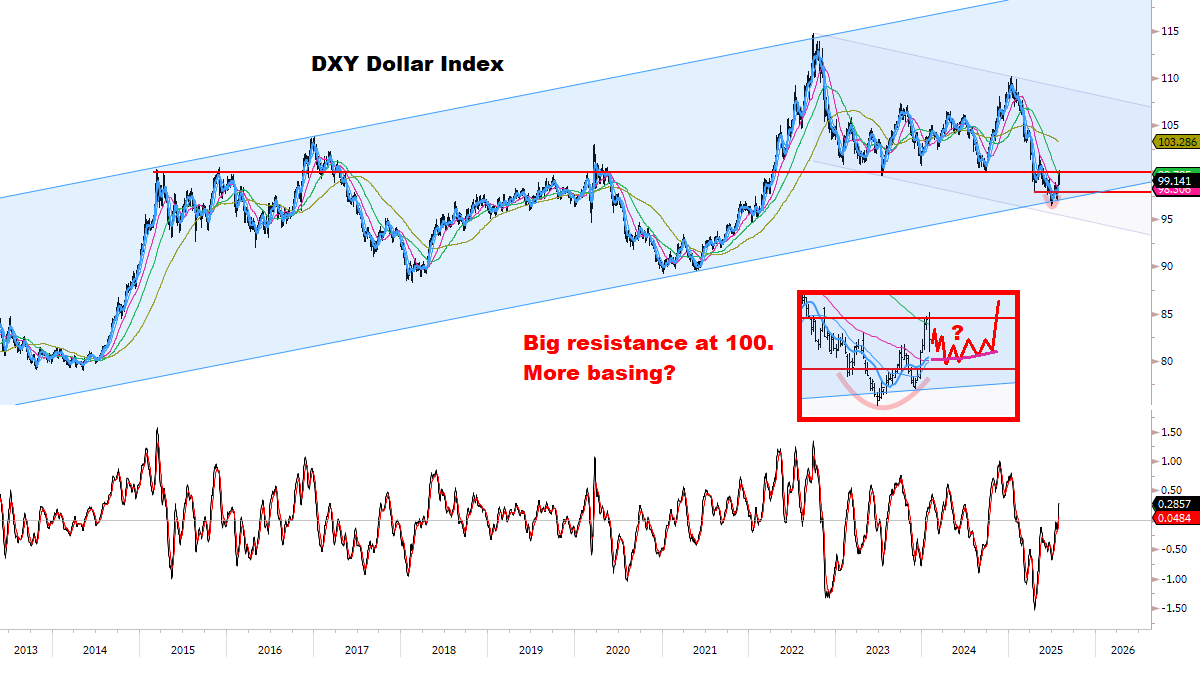
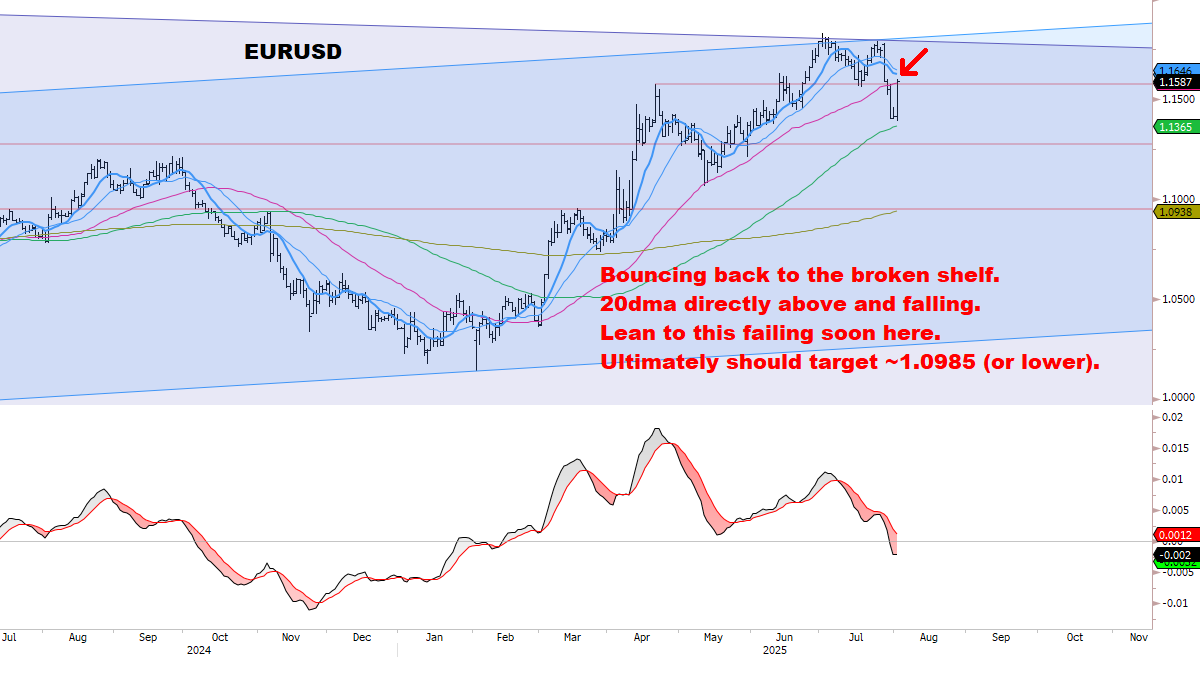
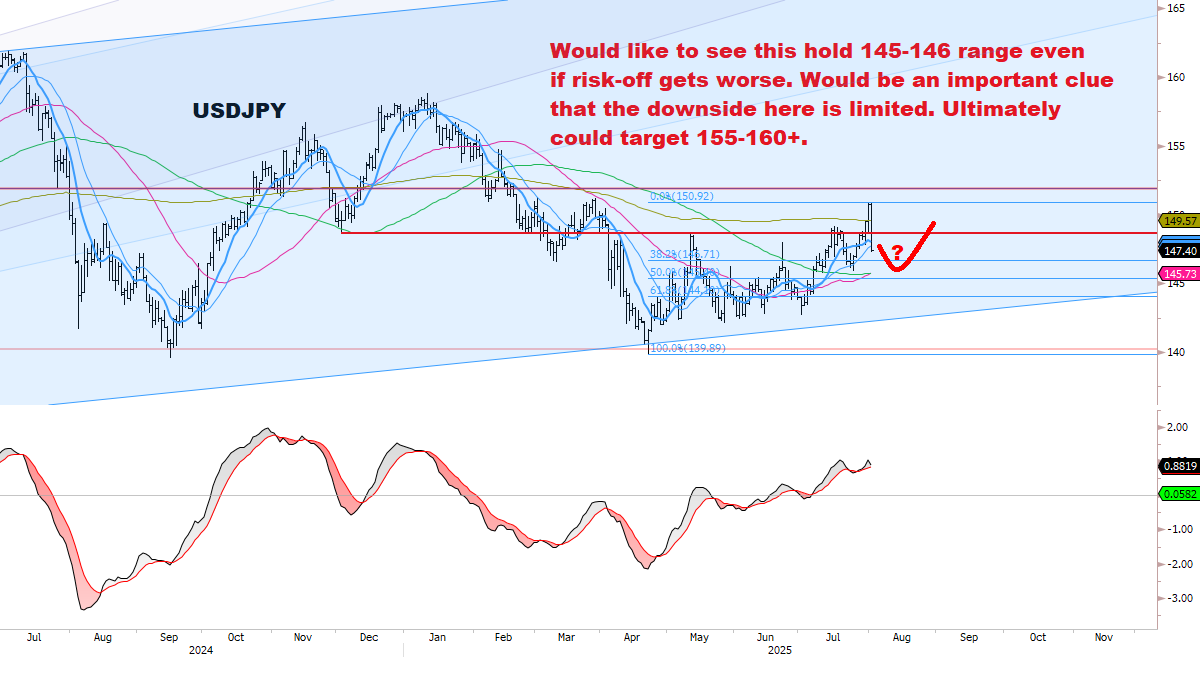
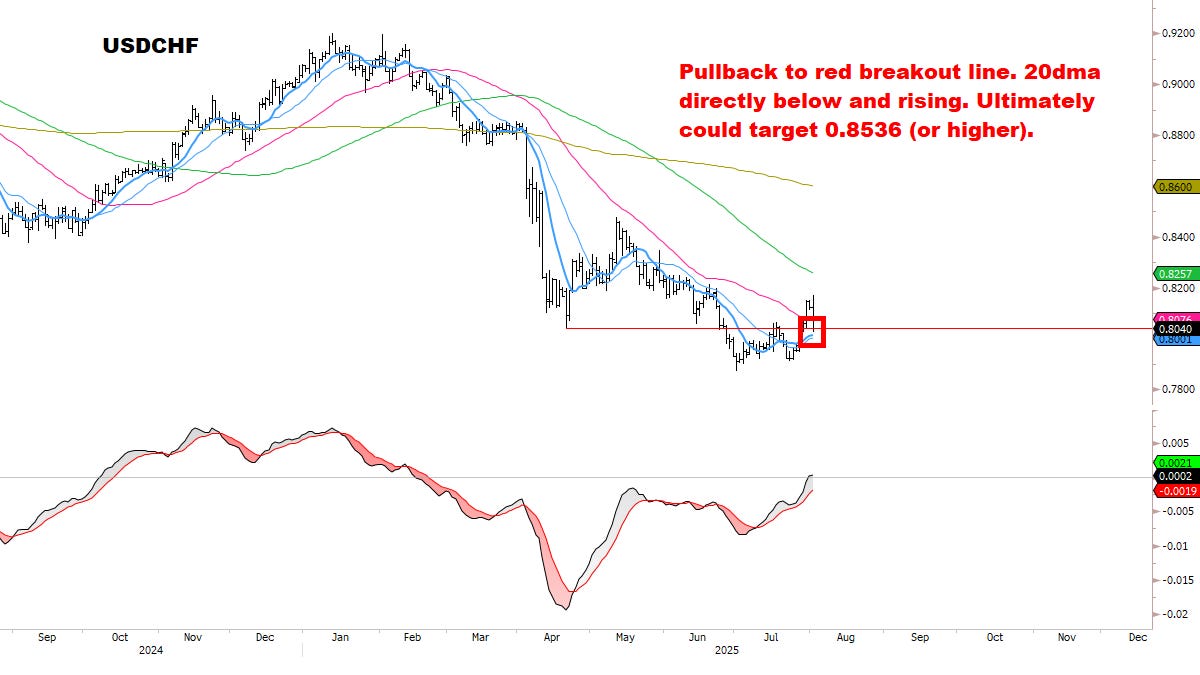
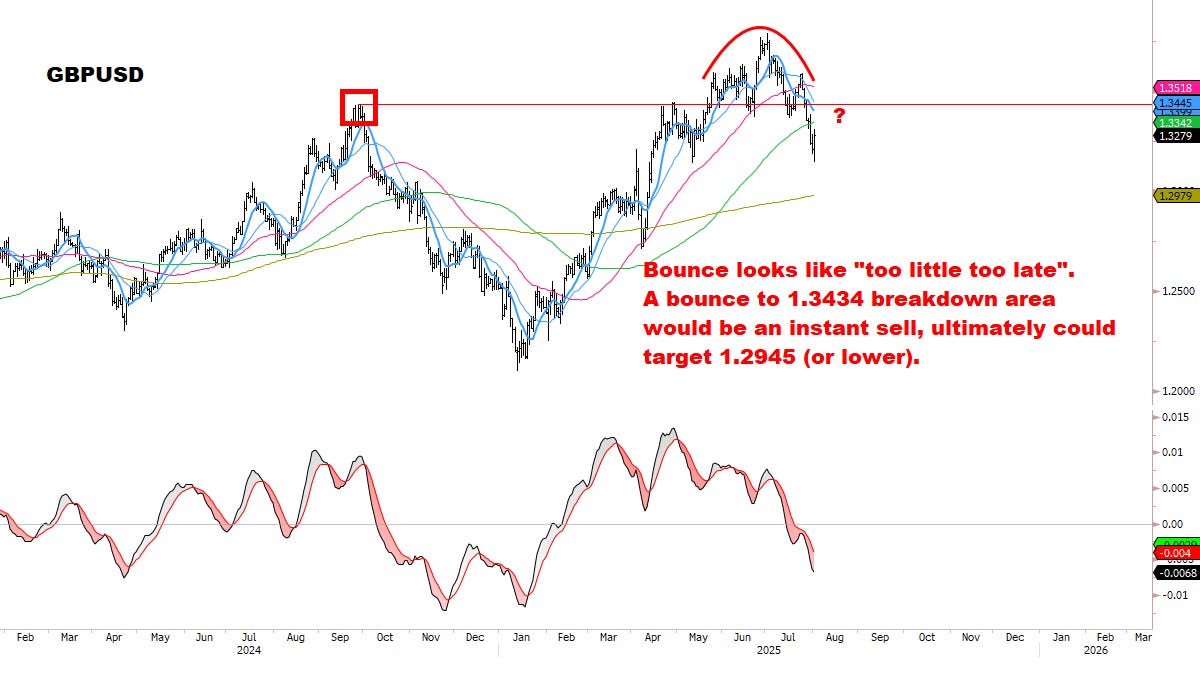
Unfortunately the Dollar may remain choppy another 1-2 months against the Majors (DXY). Leaning lower on EURUSD and GBPUSD, but USDJPY and USDCHF are trading risk-off. These cross-currents reduce the chance of a full-power DXY rally here. Maybe it continues basing. *We’ll discuss this in the CHARTS section — including levels of interest.
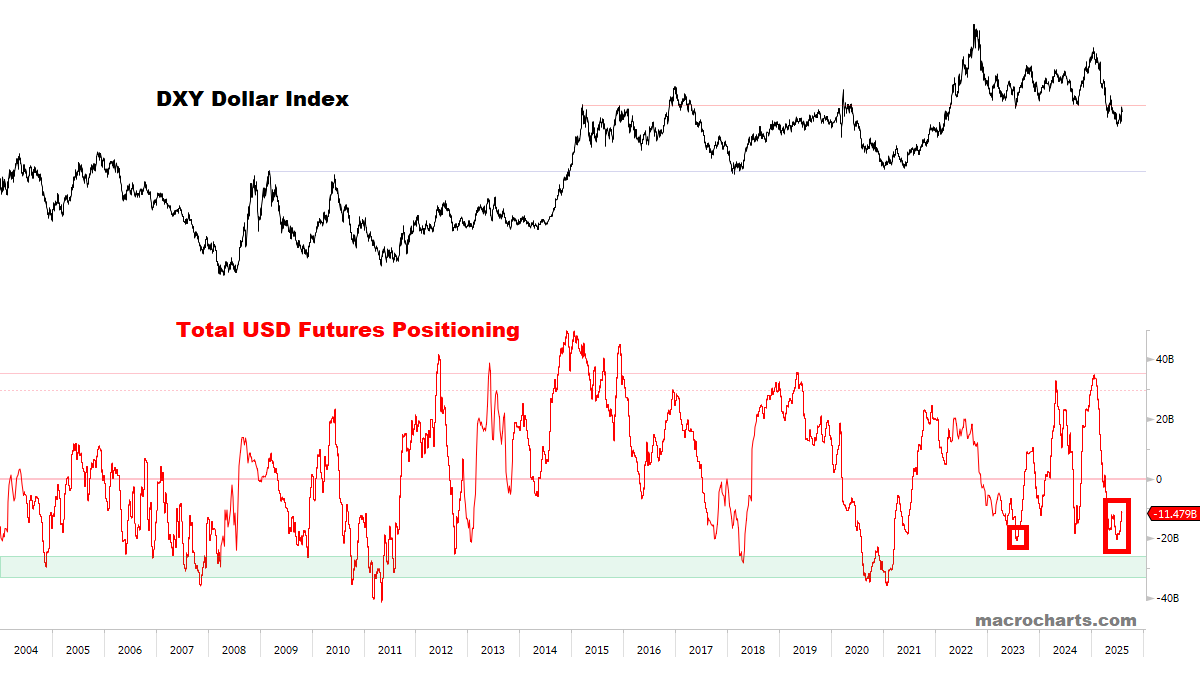
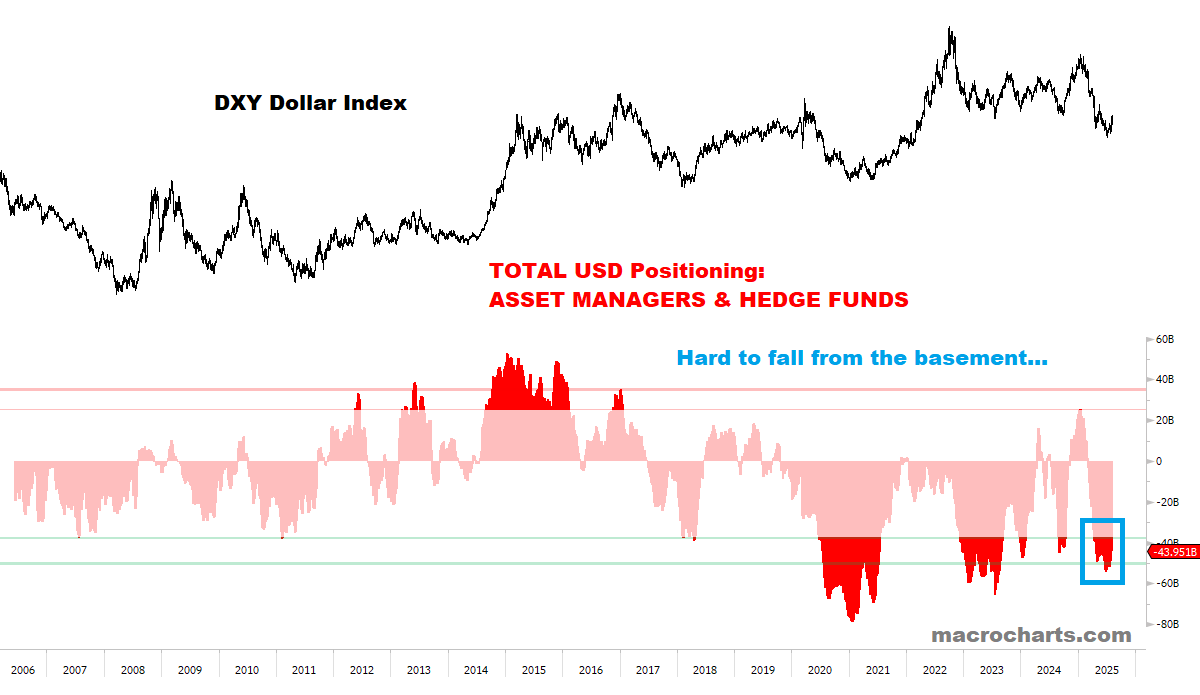
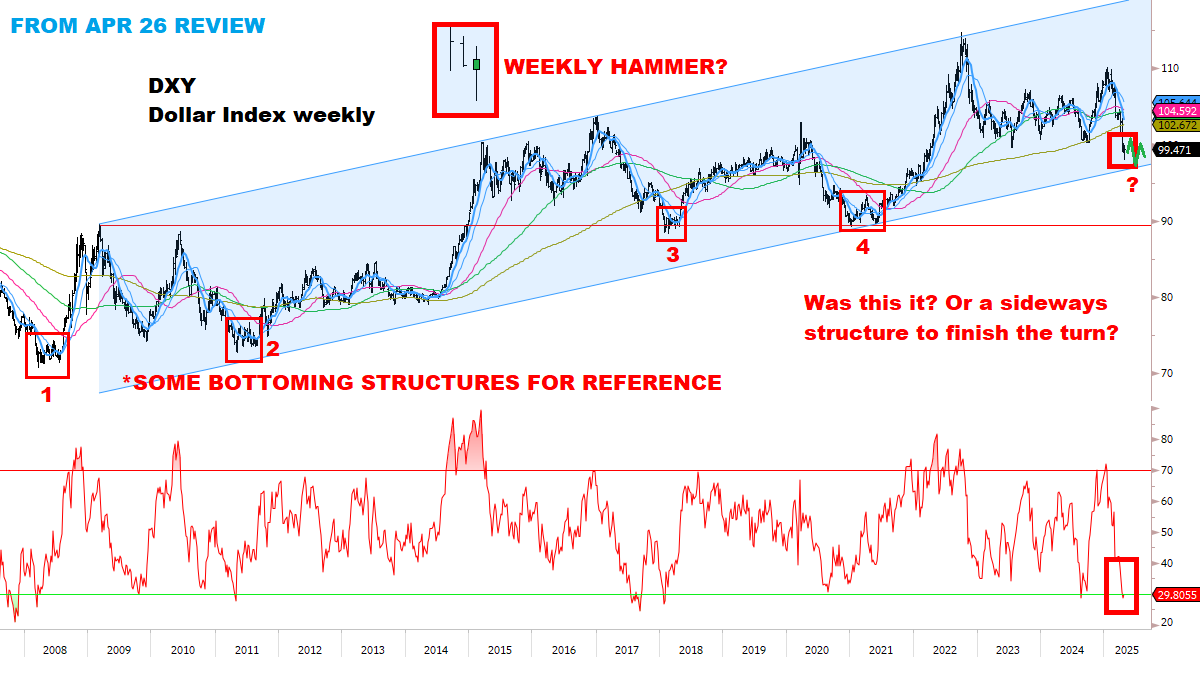
Investors remain extremely Short the Dollar — an important reason why I think downside should be limited, and the worst-case scenario may be more basing. “Hard to fall from the basement”.
Below, the historical DXY bottoming pattern suggests 1-2 months more basing before a bigger rally. Maybe held back by a risk-off phase in Q3:
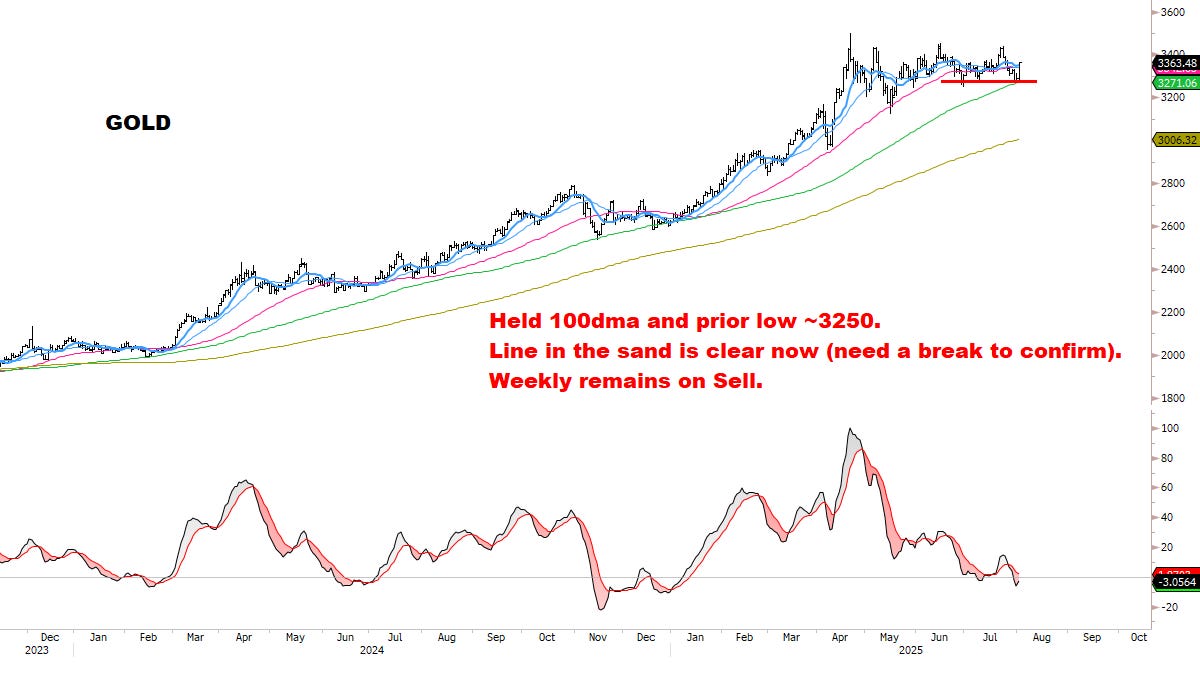
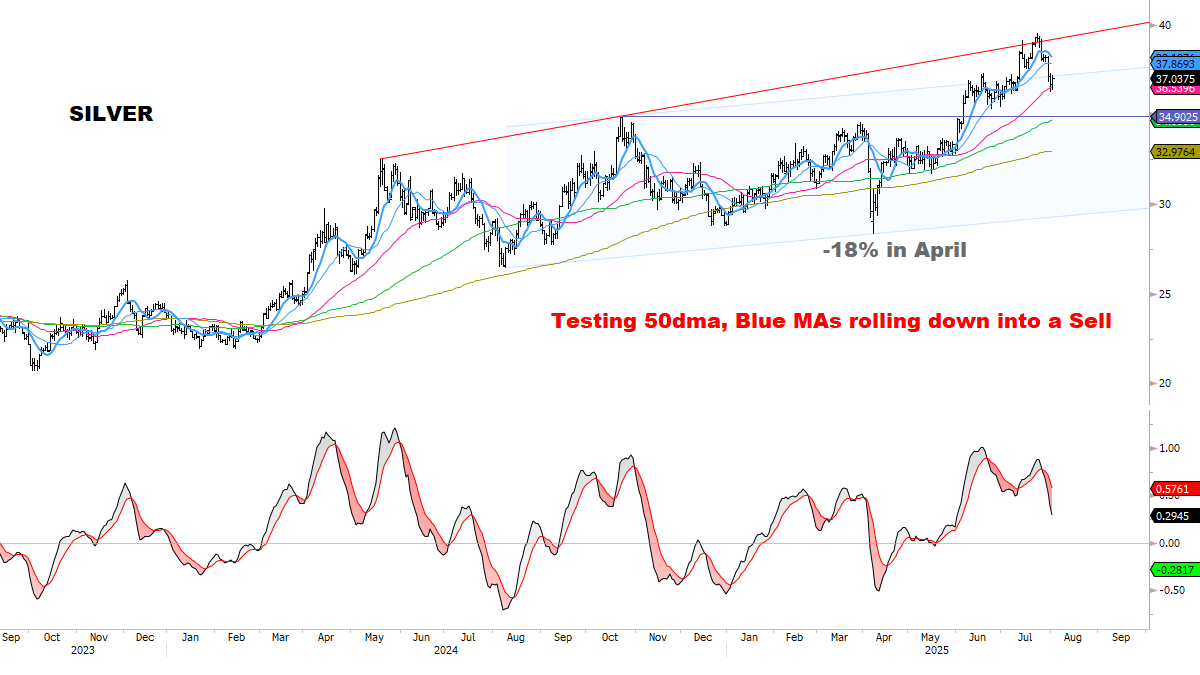
Gold and Silver confirmed last week’s exhaustion patterns:
We continue to avoid the group for now. And remember: PMs and Miners did not trade well in the April Equity decline (beware).
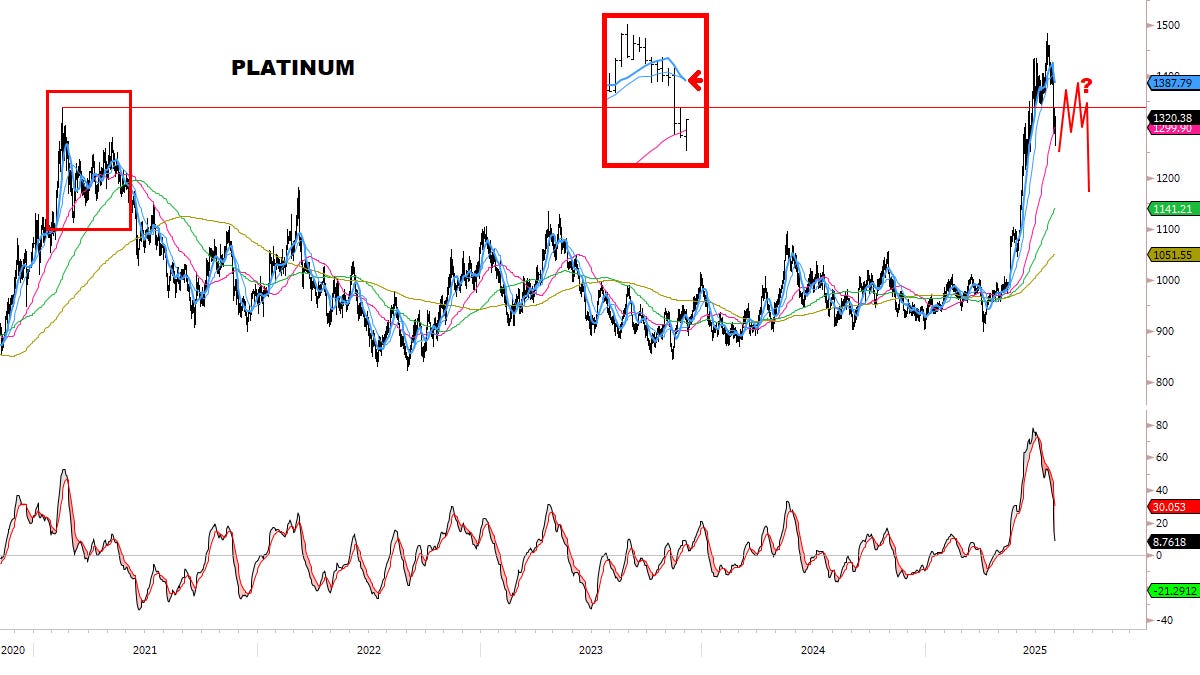
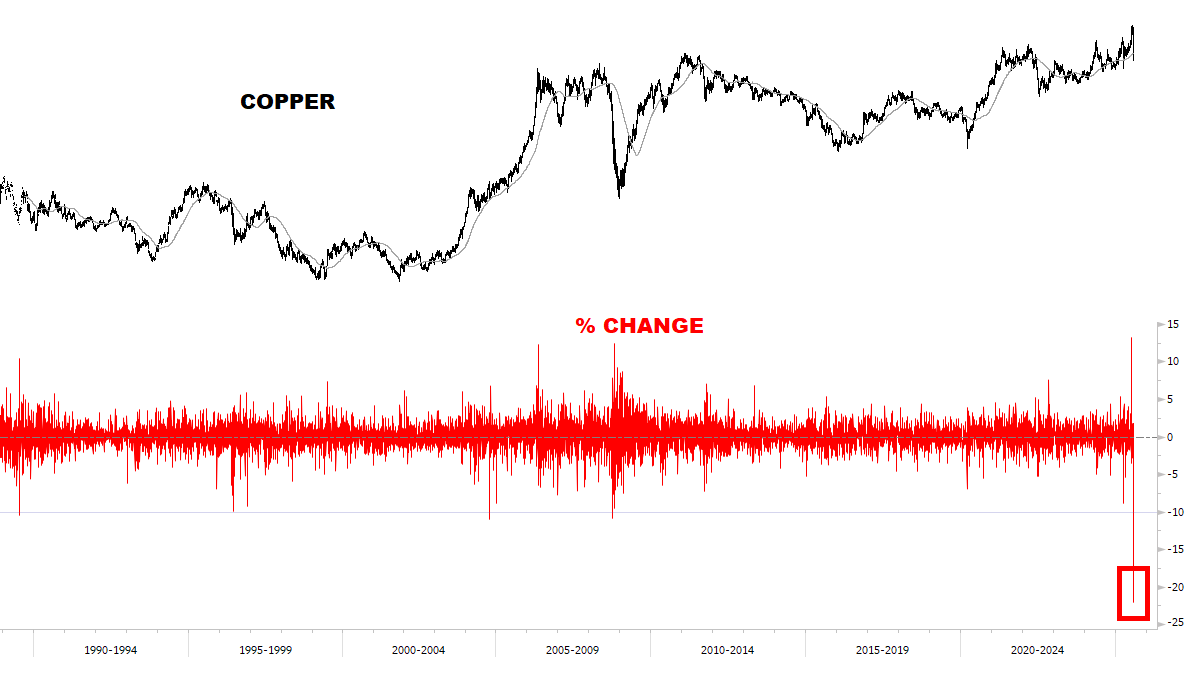
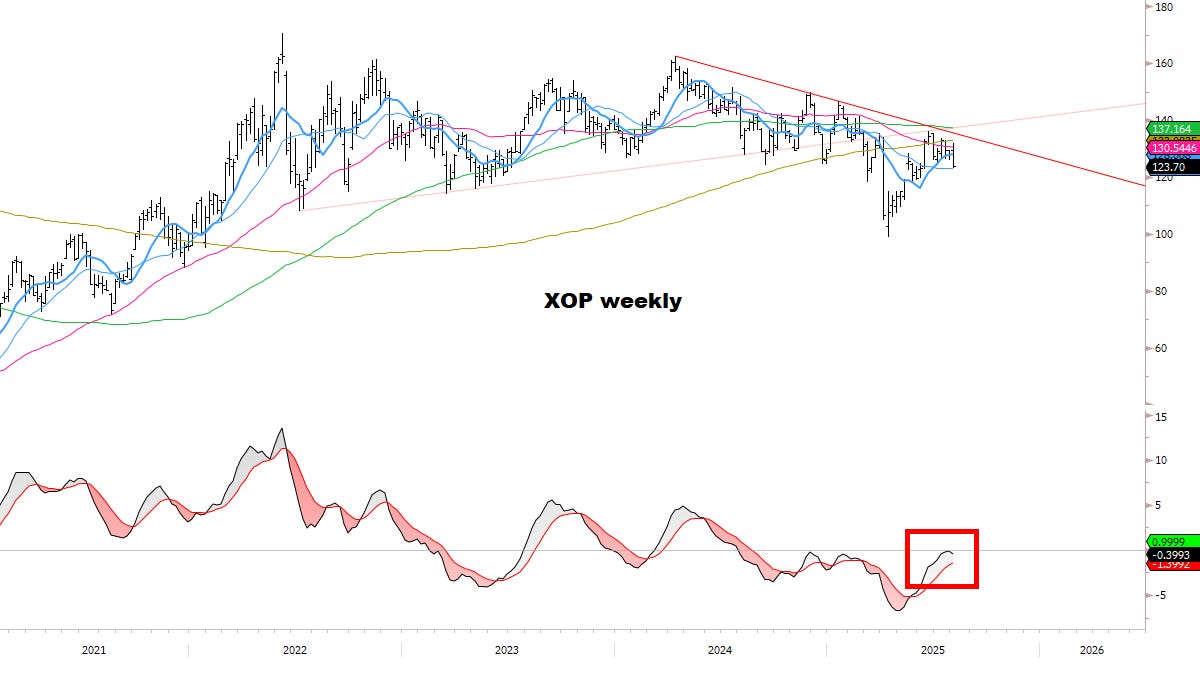
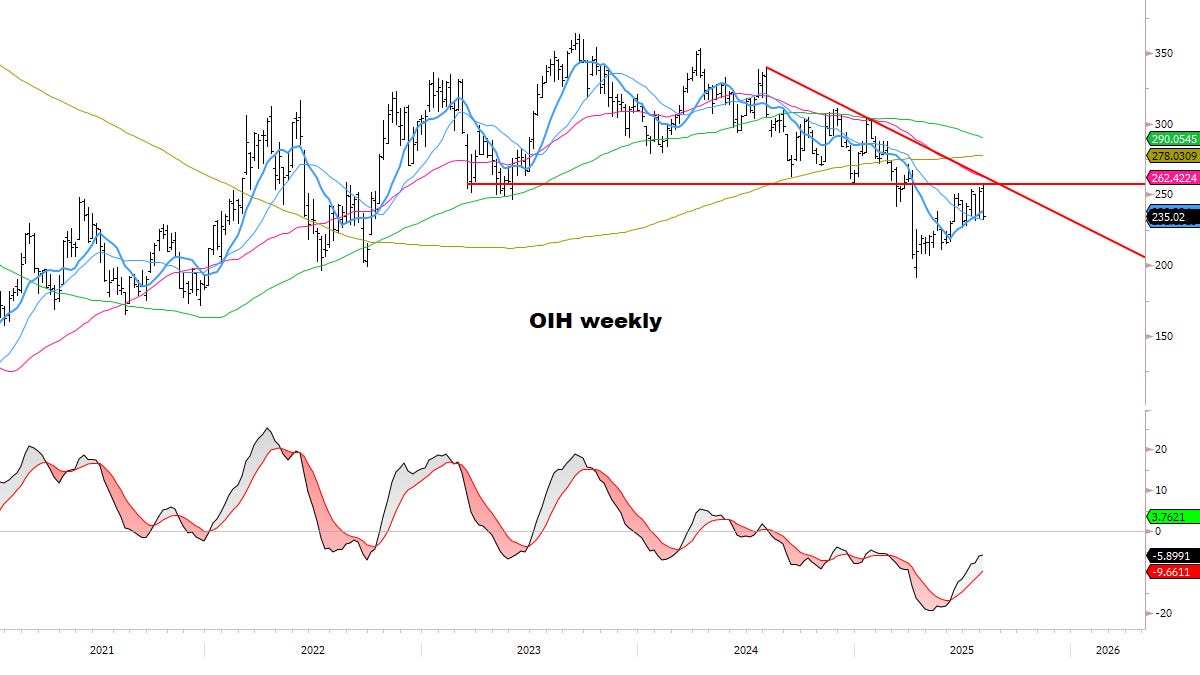
COMMODITY CASCADE:
Commodities may be on the cusp of a cascade lower. Commodity books were blown out this week on Copper’s biggest one-day plunge in history. This was beyond all “modeled” downside risk — Thursday’s decline of -22% was TWICE the prior record of -11% (set in 2004). Until this week, Copper’s second-largest decline was during the October 2008 crash (-10.87%). Thursday blew every risk model to oblivion. And it will have huge implications for institutional risk appetite in the entire Commodity space.
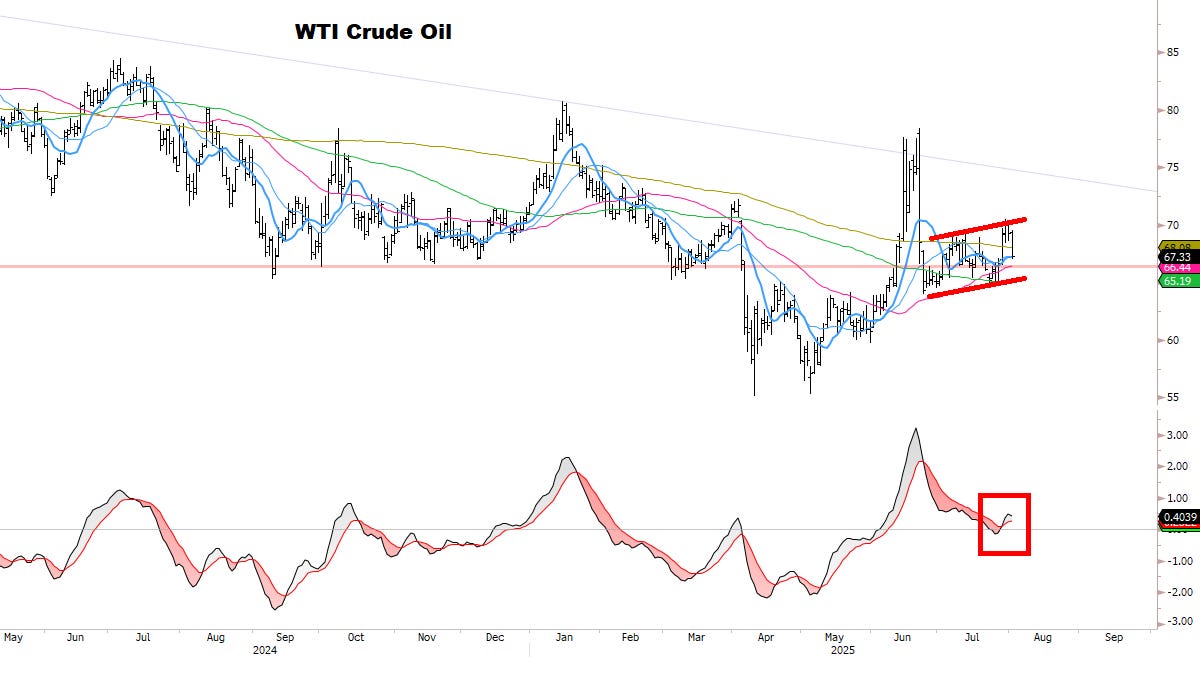
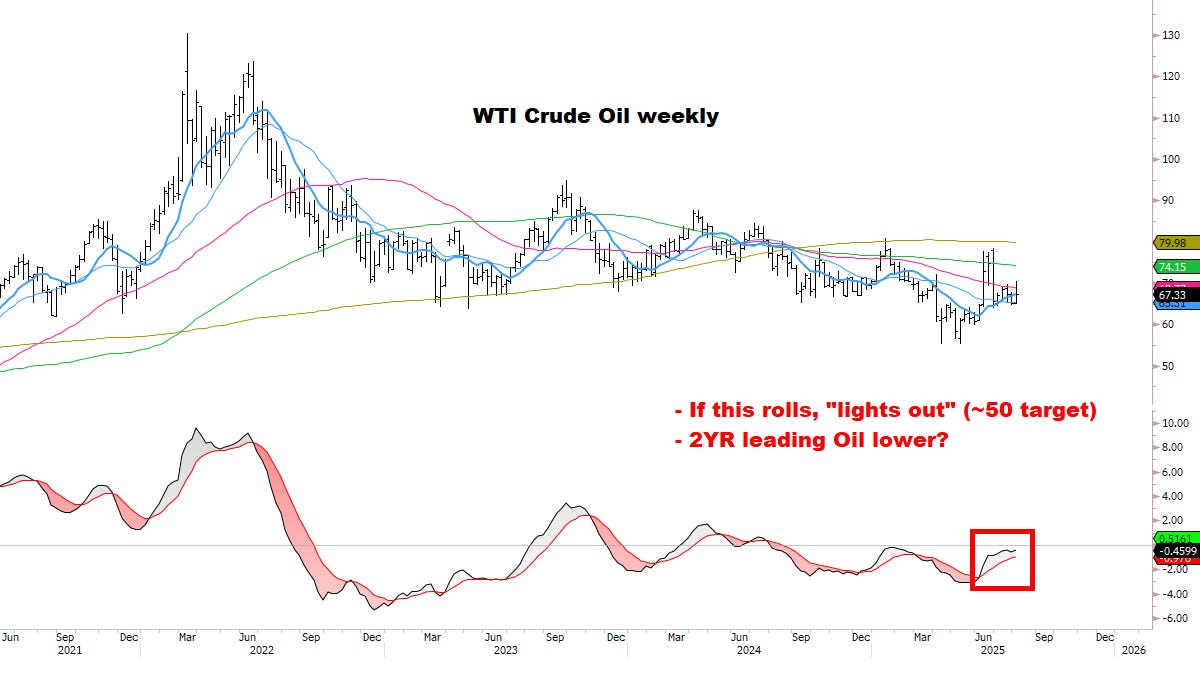
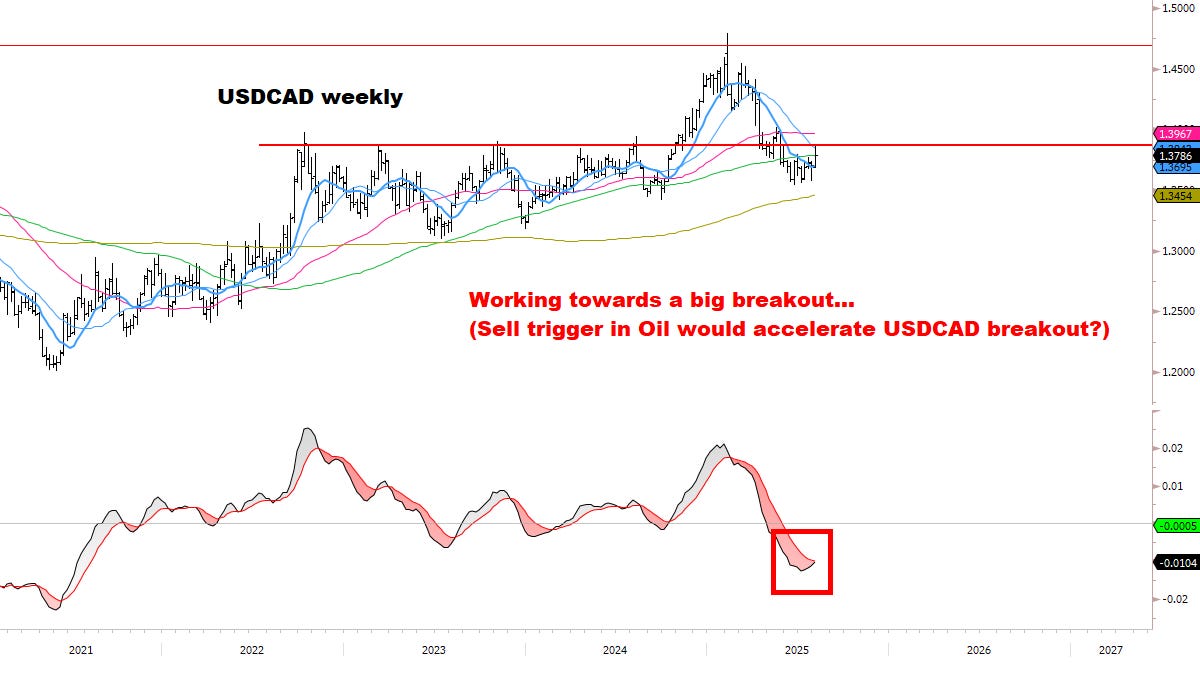
RELATED: There’s a strong chance we’ll SOON reload Short WTI Crude Oil. If Sells trigger, think the theme taking hold could be a commodity cascade — with disinflation fears, China and EM getting hit sharply (a lot of money stuck in “China M2—Commodities up” trade). Short Oil could be a critical portfolio hedge/alpha generator in this scenario — maybe THE best out there (along with Bonds/Cash). *Full discussion in the CHARTS section.
NEW big signals in Rates — looks like a major shift:
Looks like a “BAD NEWS IS BAD NEWS” regime starting — if so, then the Fed is “Too Late” indeed…
2YR Yields are finally moving OUT of the multi-month coil. The BIG action is in the front end of the curve, leading the entire Rates complex. Looking to open a Long position in Two-Year Futures.
Steepeners are launching higher — this week’s action increases our conviction further.
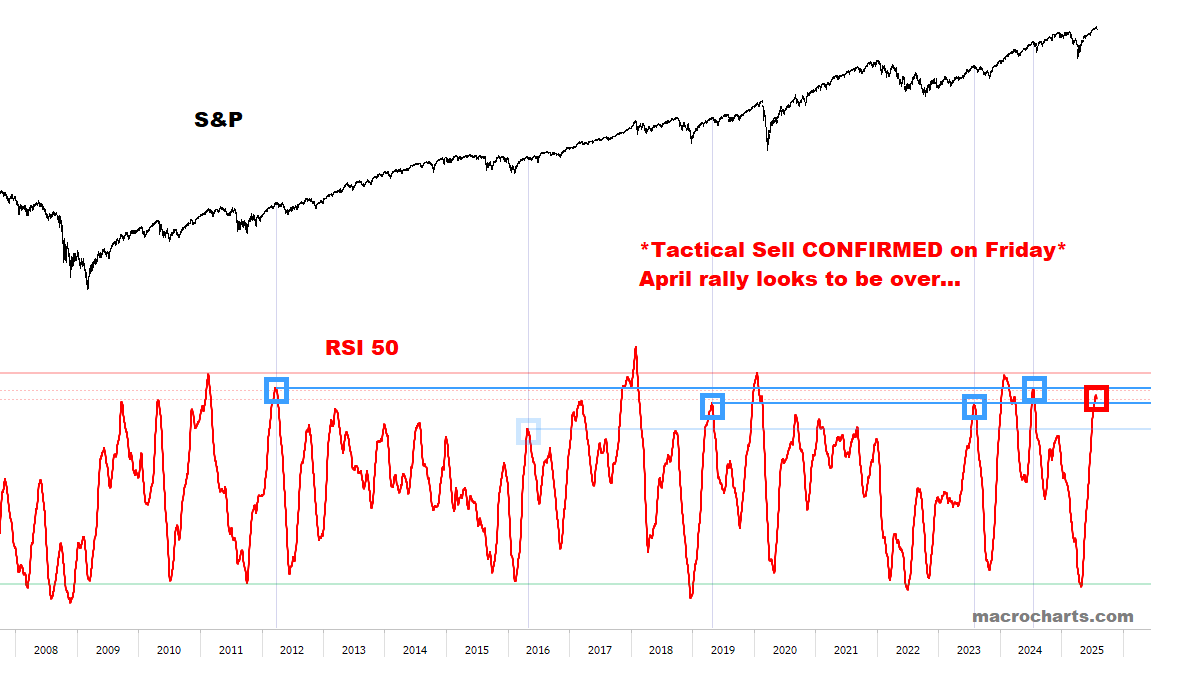
As discussed Thursday, downgrading Stocks to Neutral for 3-Month time horizon — initial Sell signals are now triggering:
Base case / conservative estimate is a flat 3-Month range developing (with one or more sharp declines).
NEXT WEEK: lean to Sell/Hedge on bounces and watch GAP BEHAVIOR — *discussed in detail later in this report.
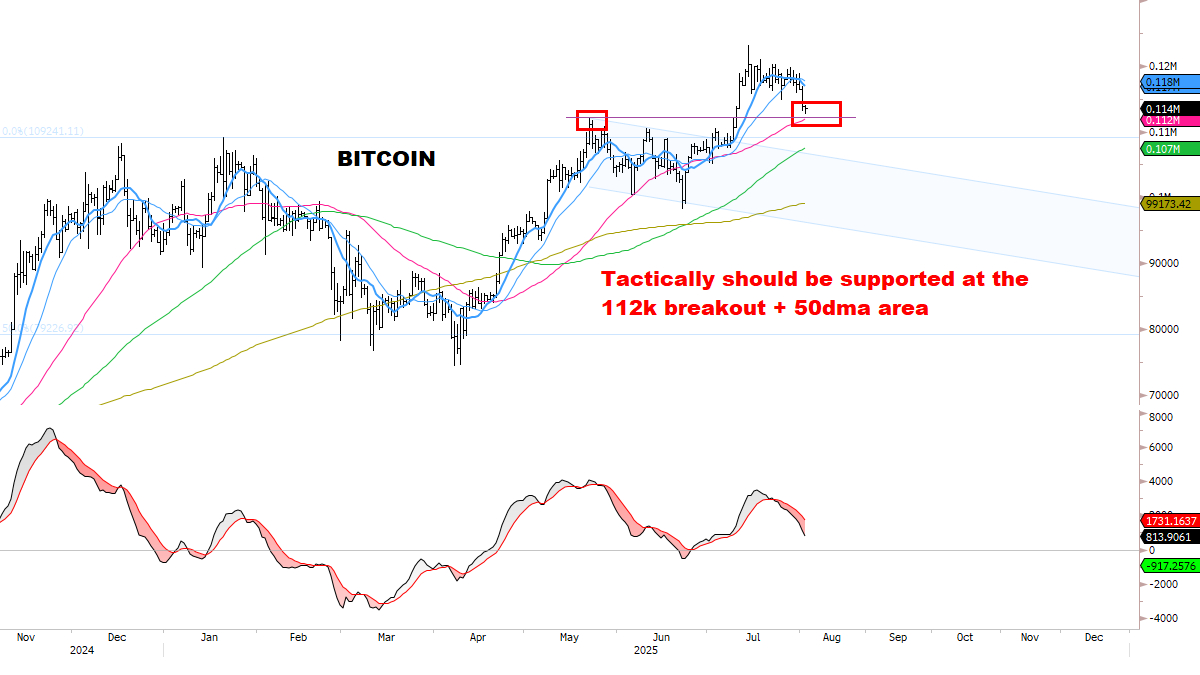
Downgraded BTC to Neutral (3-Month window, similar to Stocks).
Upgraded Volatility to Positive (3-Month window, similar to Stocks).
CORE MODELS & DATA
STOCKS
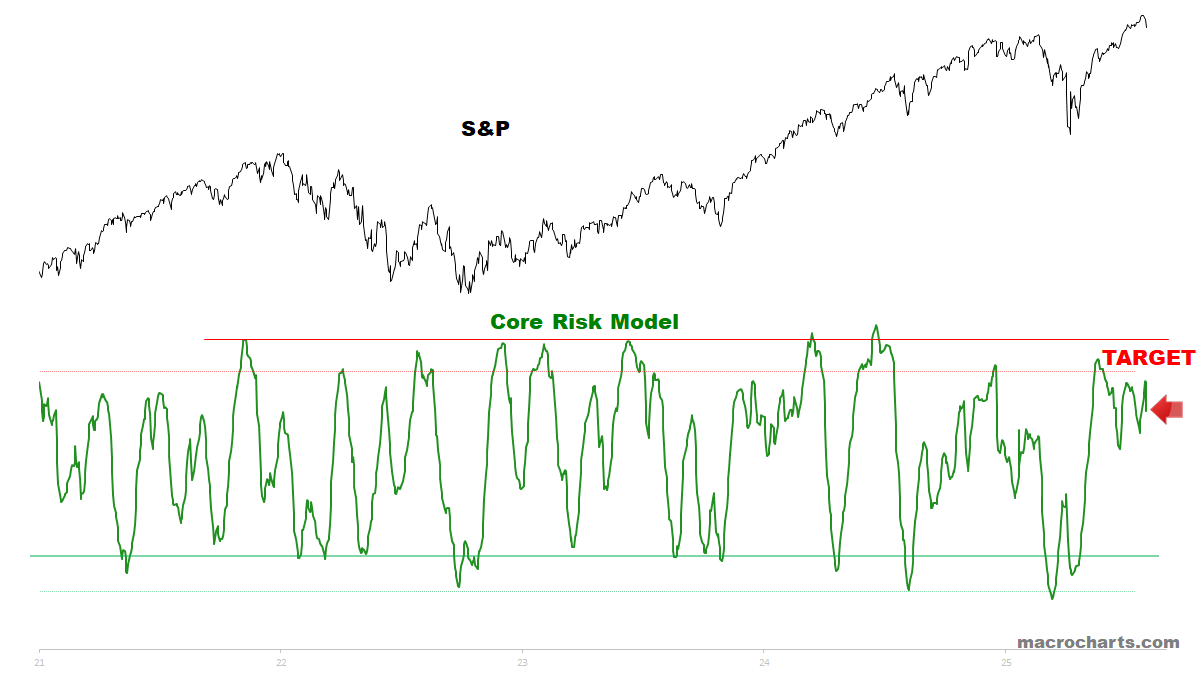
Core Risk Models did not reach ideal topping range, but have turned down.
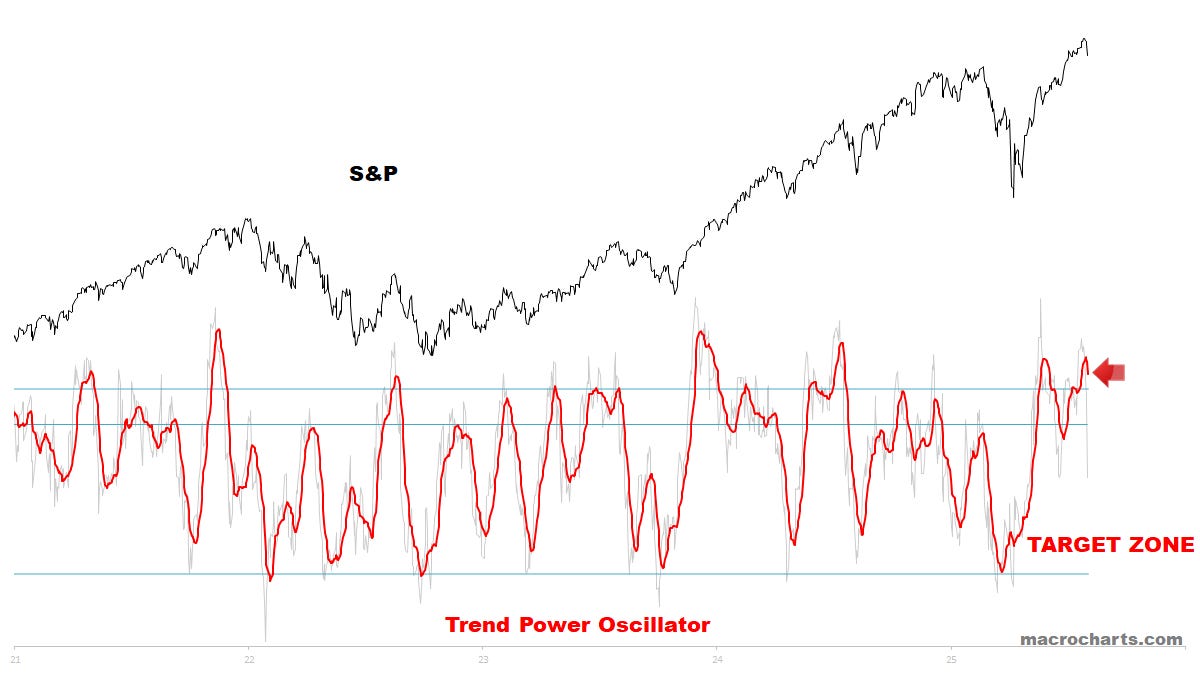
Trend Power Oscillator has triggered a Sell — *tracking the 2016/2019 scenario, this should ideally reach oversold into later Q3:
Continue to track closely for a top — *now fully inside the time window and showing an initial reaction:
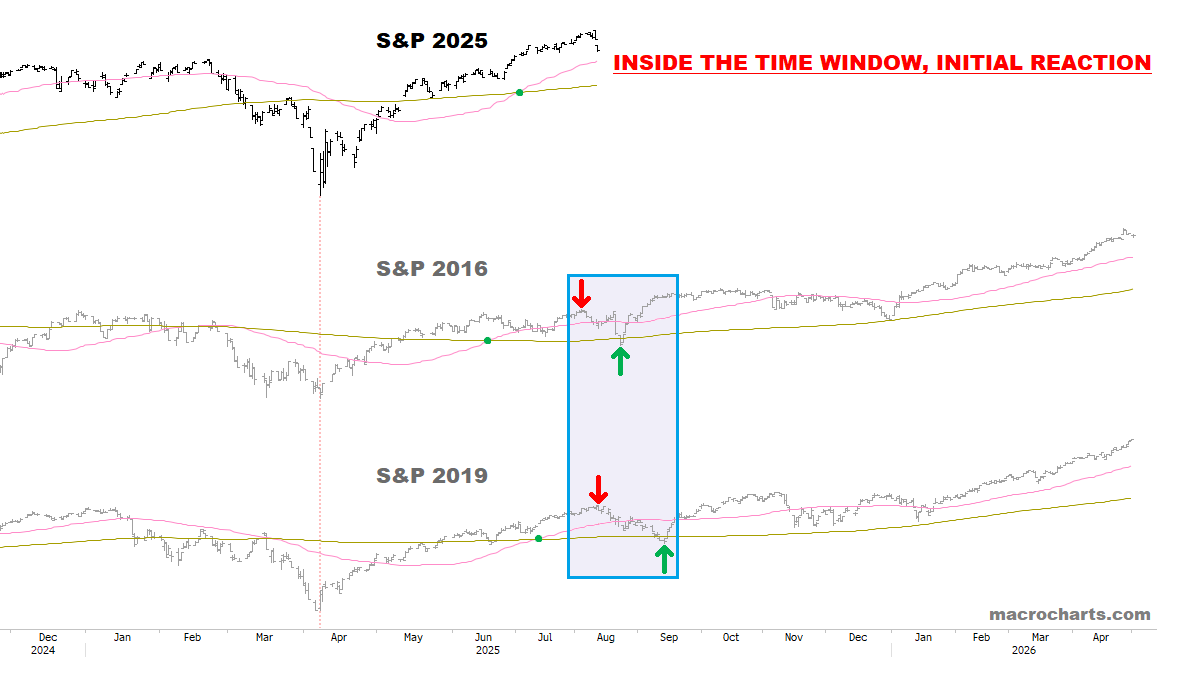
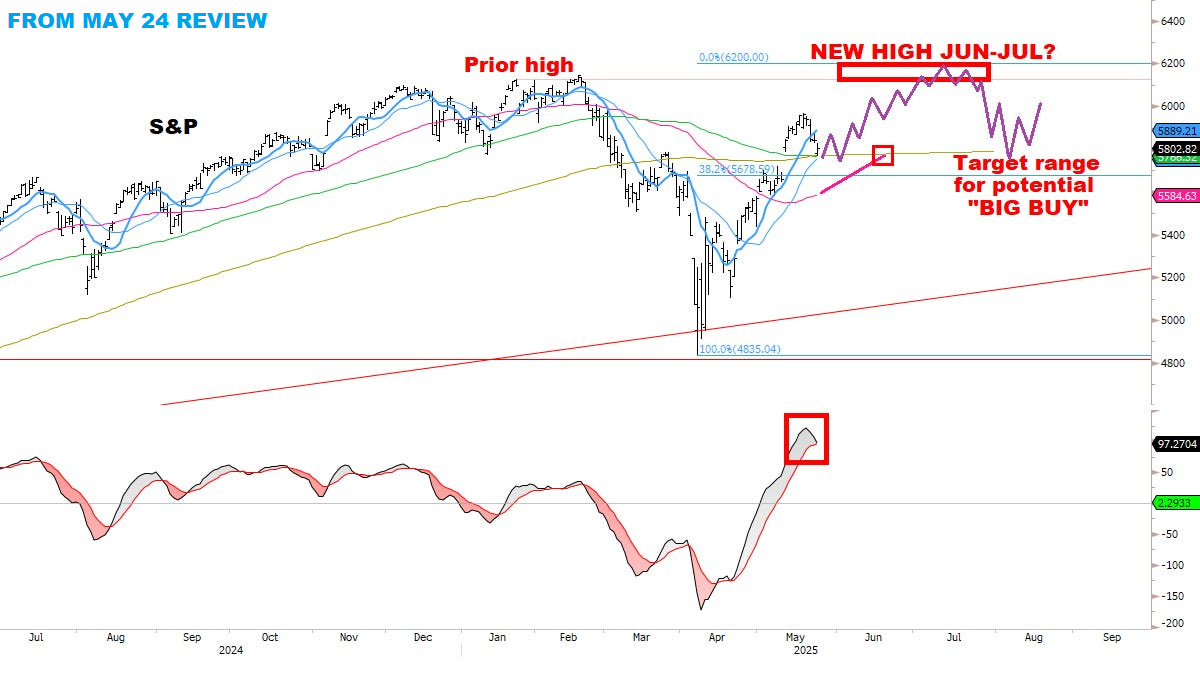
As discussed May 24:
Thursday’s gap up looked GREAT, everyone on Twitter was euphoric — but the market sold off hard and the gap was filled immediately:
From Thursday’s report: “Typically, exhaustion gaps get filled within 2-3 days, so if today’s gap gets filled quickly I think the case for a top would begin to build.” (*Certainly looks like it now…)
From Thursday’s report: “the probability of NEW gaps getting filled at this stage is high, as part of a topping process developing.”
Friday’s gap DOWN and heavy action was ugly. (*High Beta was crushed.) But Thursday’s comment applies to both upside AND downside gaps. Think Friday’s gap *could* be recovered and filled next week. Markets do what they do, in both directions…
Best estimate (*subject to change*):
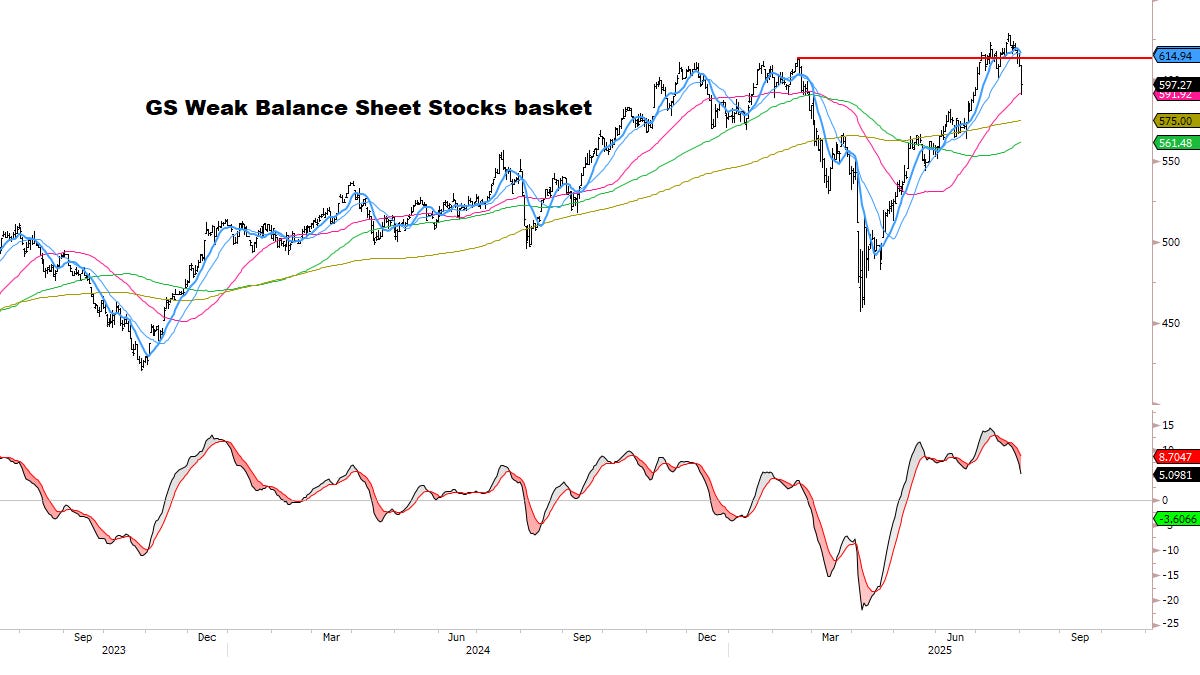
Based on the current trajectory of Core Models, MOST stocks have likely peaked, and High Beta is “gone”.
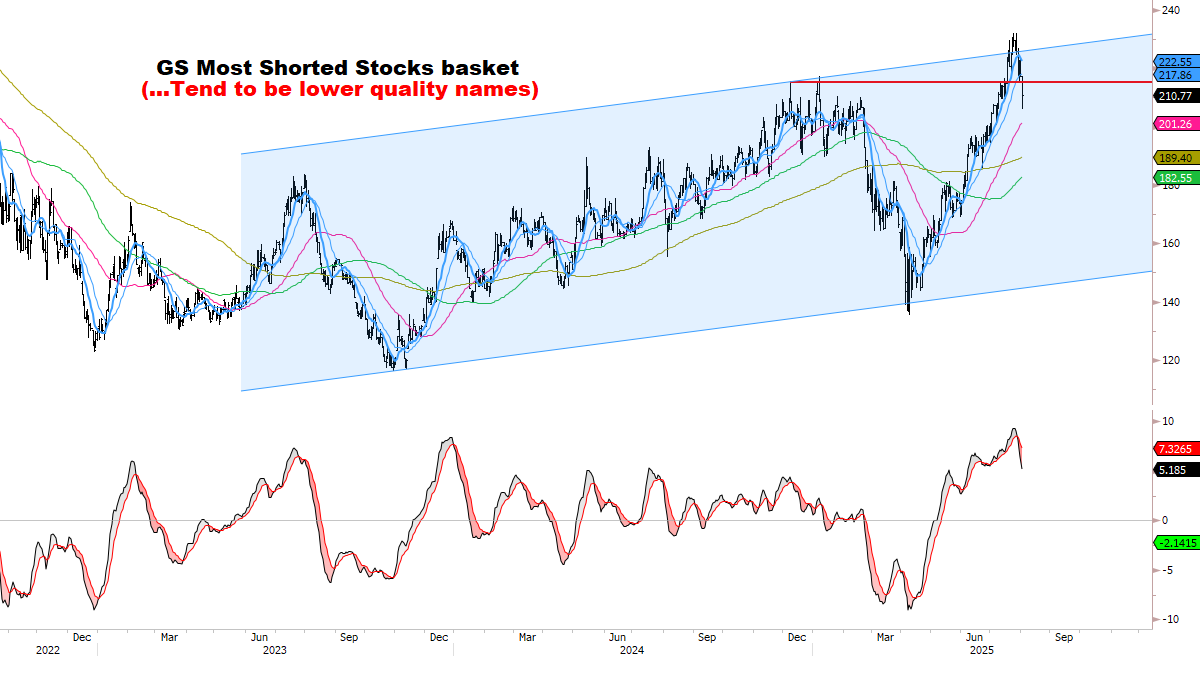
No sugar-coating: the top looks in for the majority of the market. Especially the low-quality / high-risk groups, which were our main concern leading up to this week’s collapse.
NEXT WEEK: lean to Sell/Hedge on bounces and watch GAP BEHAVIOR.
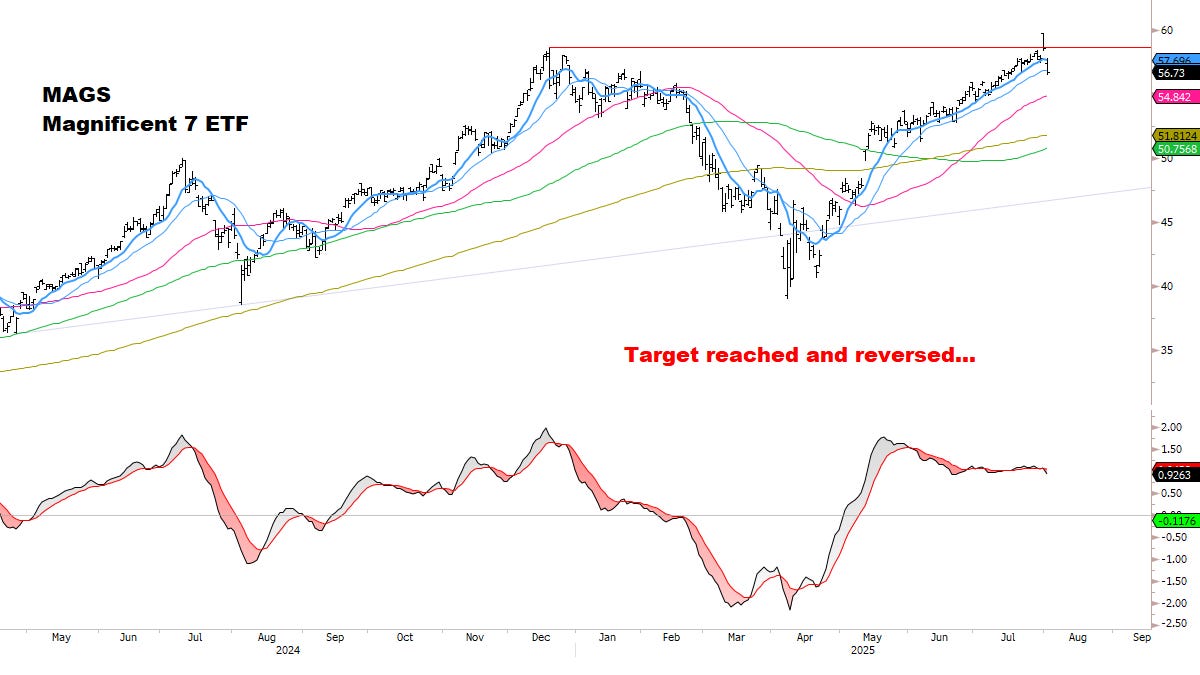
Next week MAY see a bounce attempt in Core S&P/NDX — while bearish divergences get worse and Megacaps make a last push. IF there’s an attempt to fill Friday’s gap, we’ll track and report with an Alert — likely adding SPY PUT HEDGES as discussed (TBD — EXPECT AN UPDATE NEXT WEEK). Still leaning to SPY 610 OCT Puts, but may do 610 NOV as well.
As before, history suggests a 10-15% correction in core Indexes could be seen in Q3. NOT a forecast, but a historical pattern (discussed previously).
We’ll be updating conditions in real-time — as the next weeks will be critical.
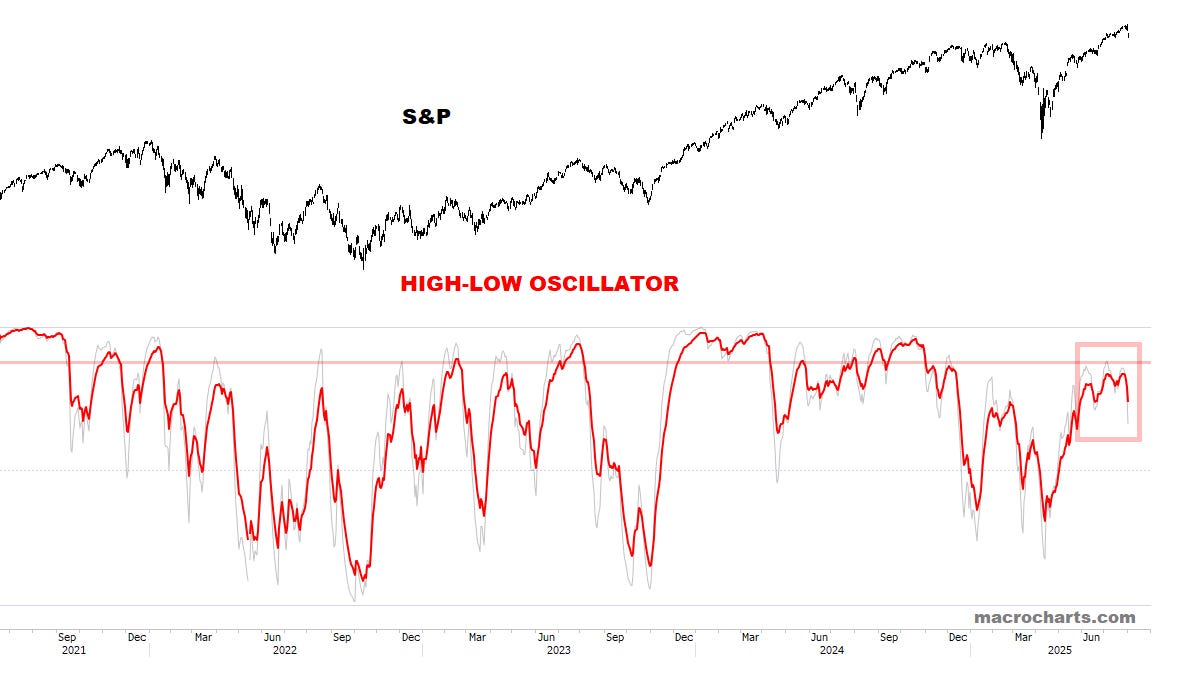
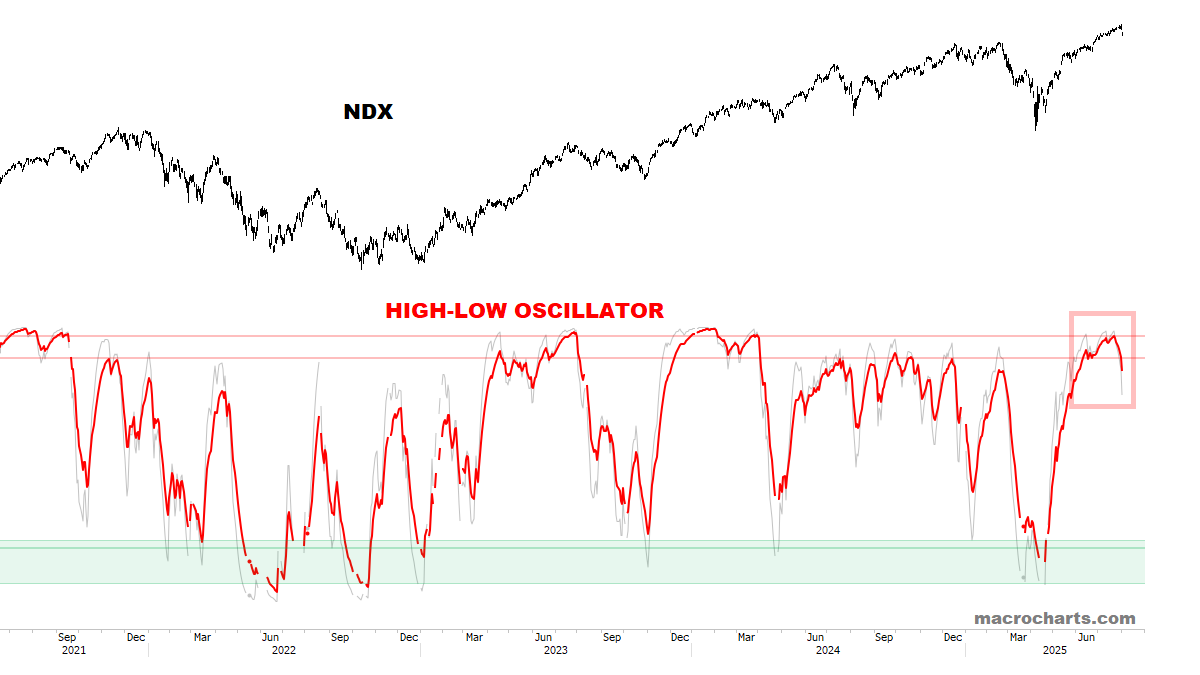
High-Low Oscillator topping structures look complete:
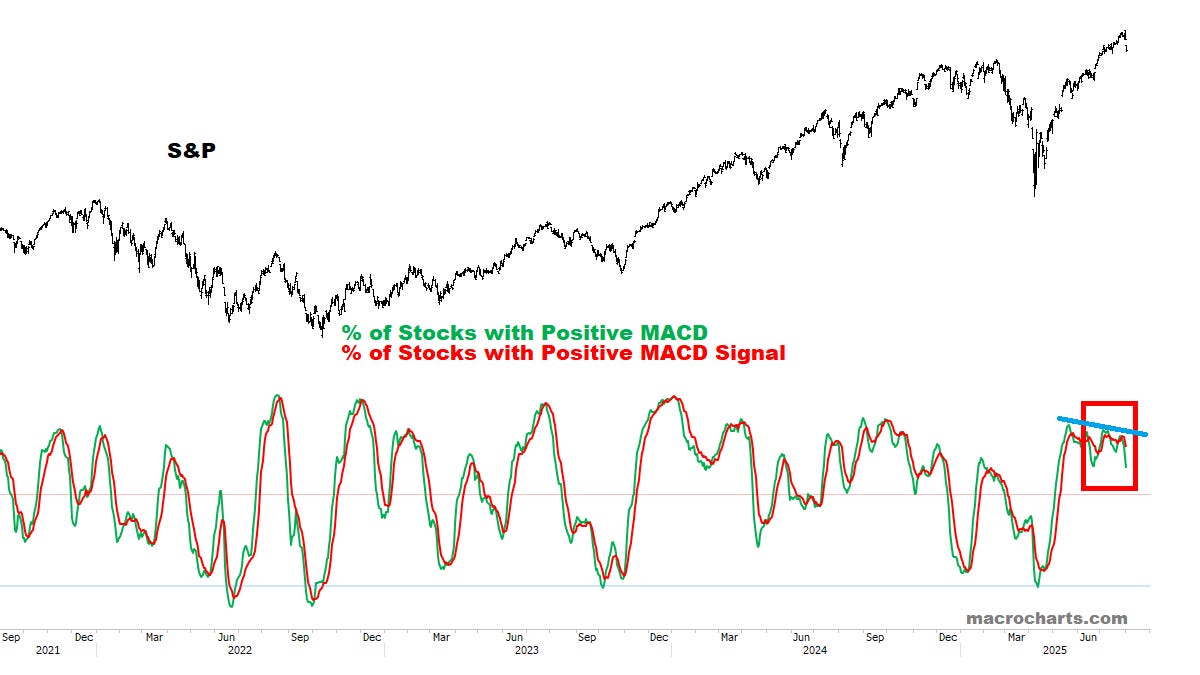
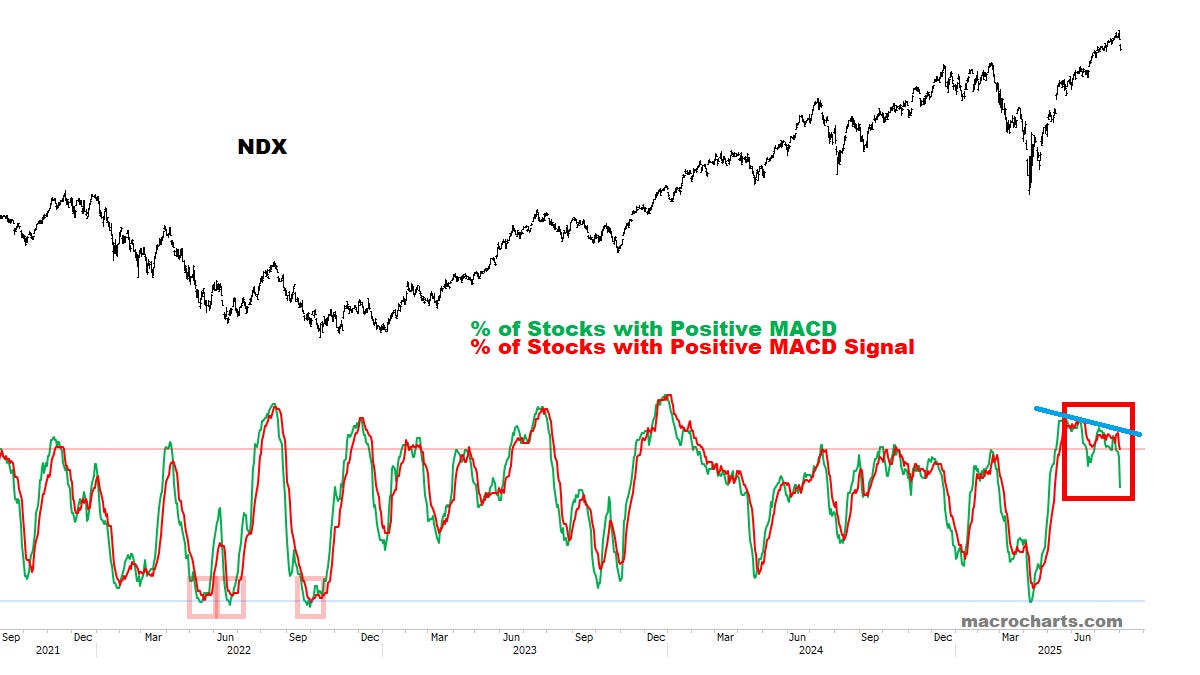
MACD Profiles have rolled down after multiple bearish divergences:
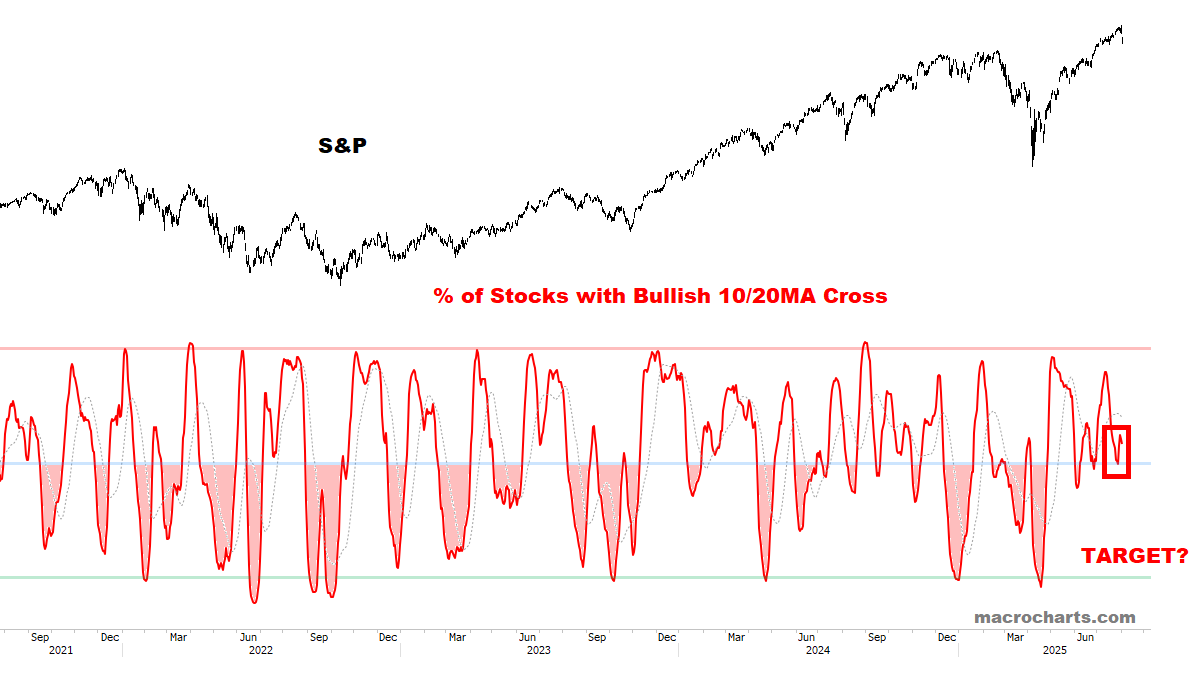
Stocks with a Bullish Cross are holding at neutral — this should break down and get oversold into later Q3:
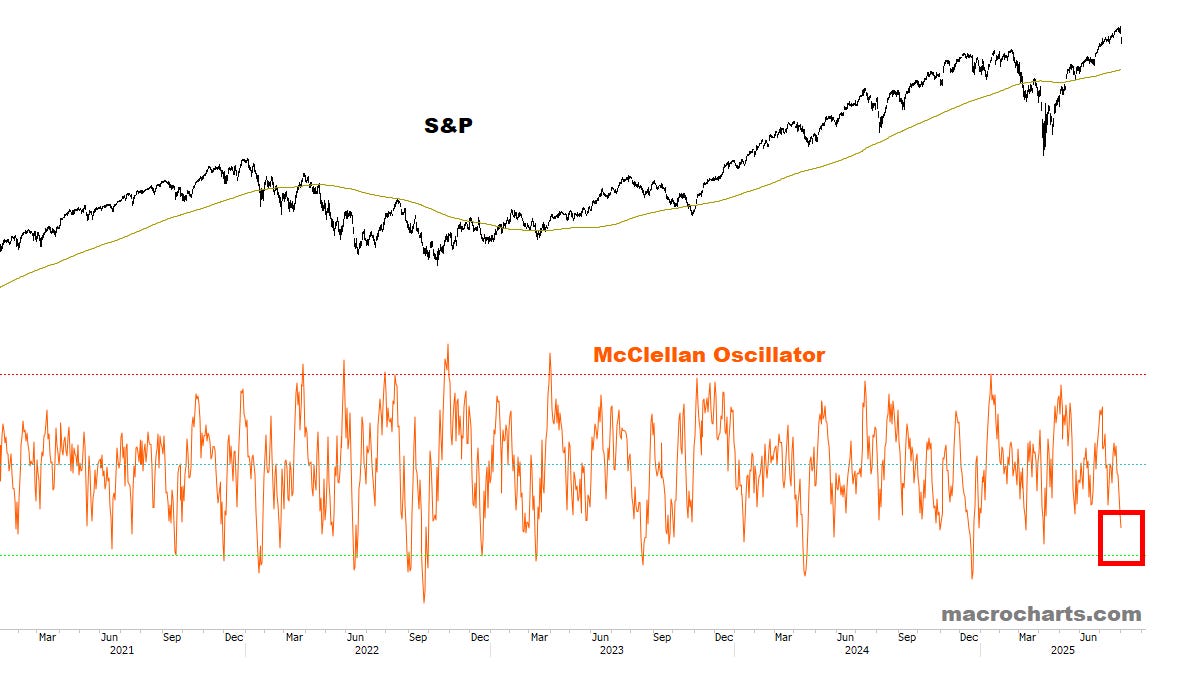
Intermediate Breadth (from last week:) “has likely peaked and displays a classic bearish divergence for the first time in this rally” — now confirming a breakdown:
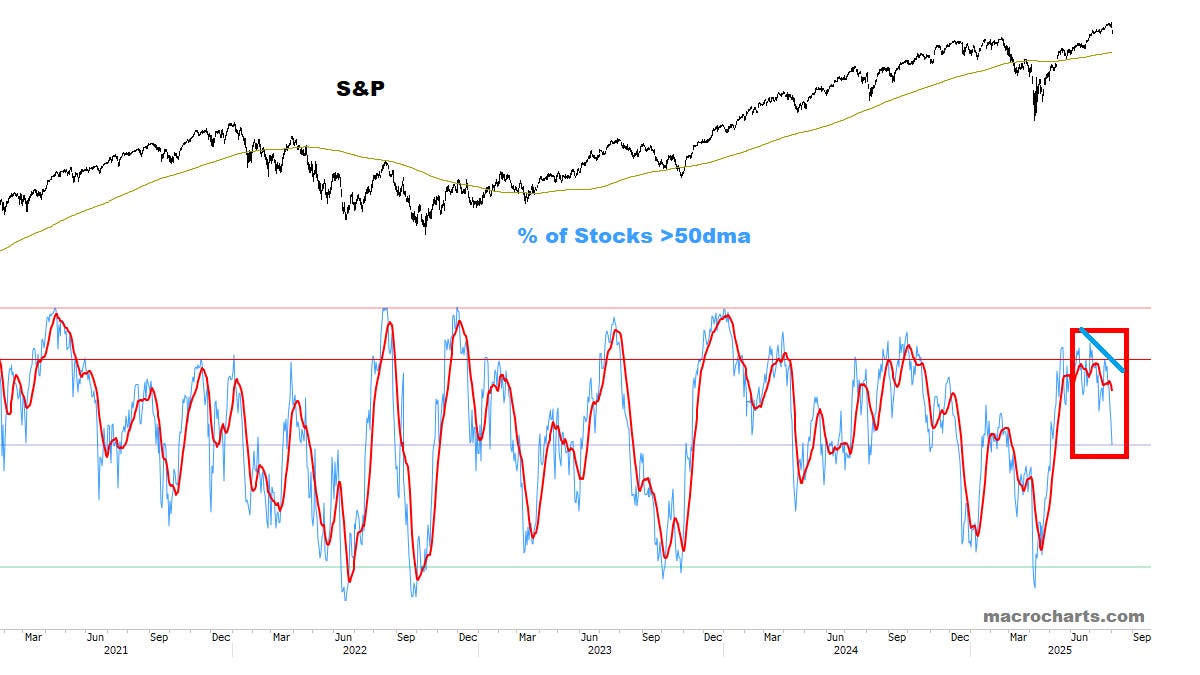
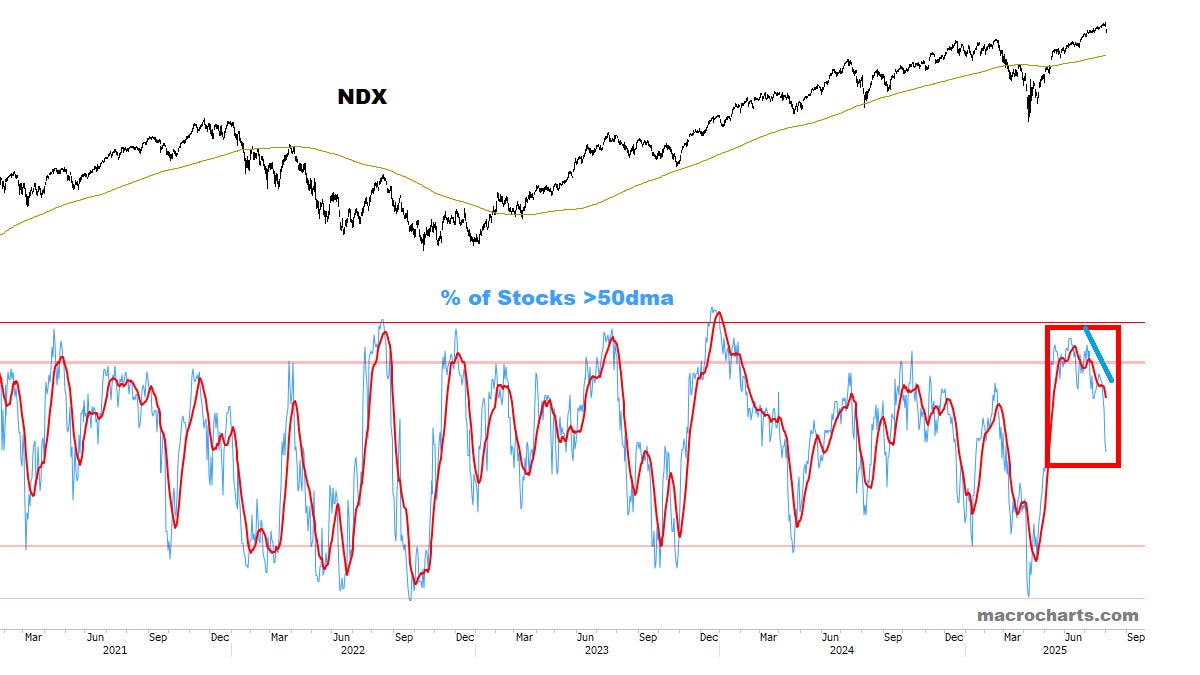
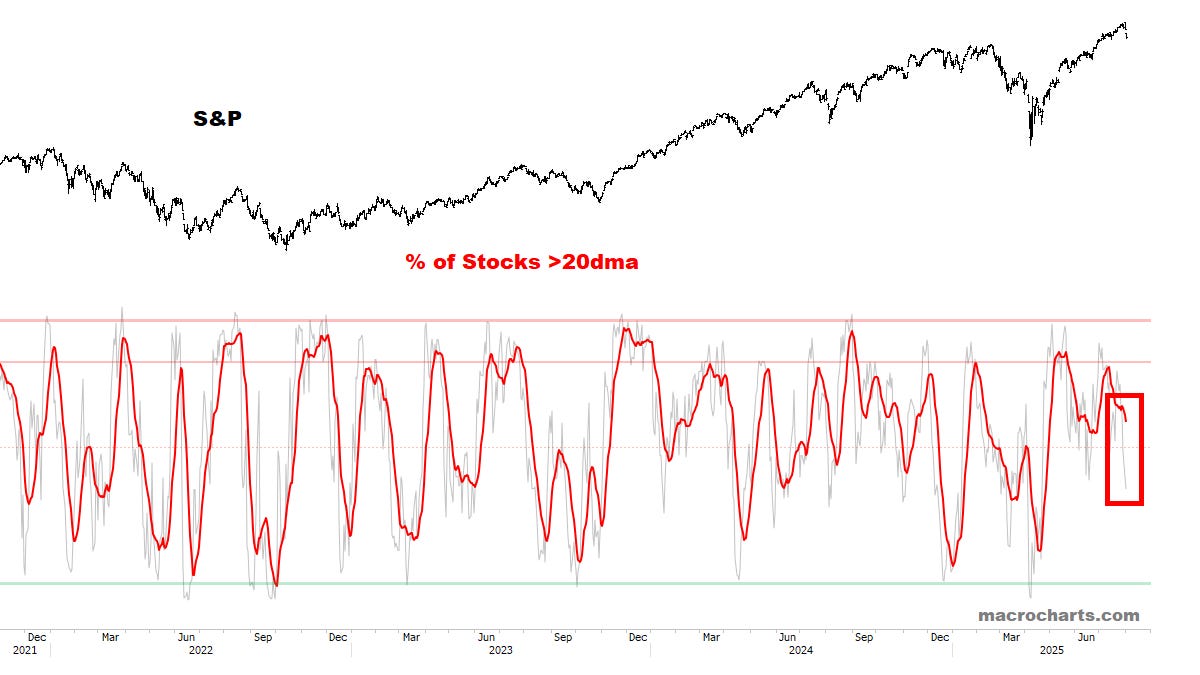
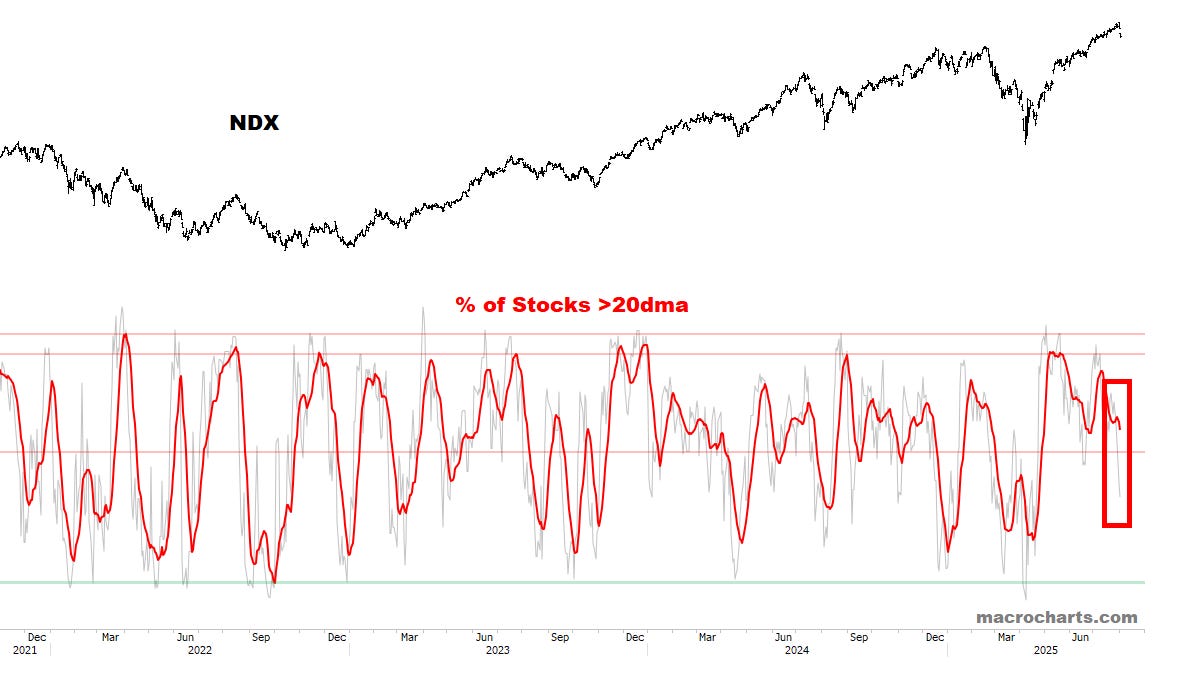
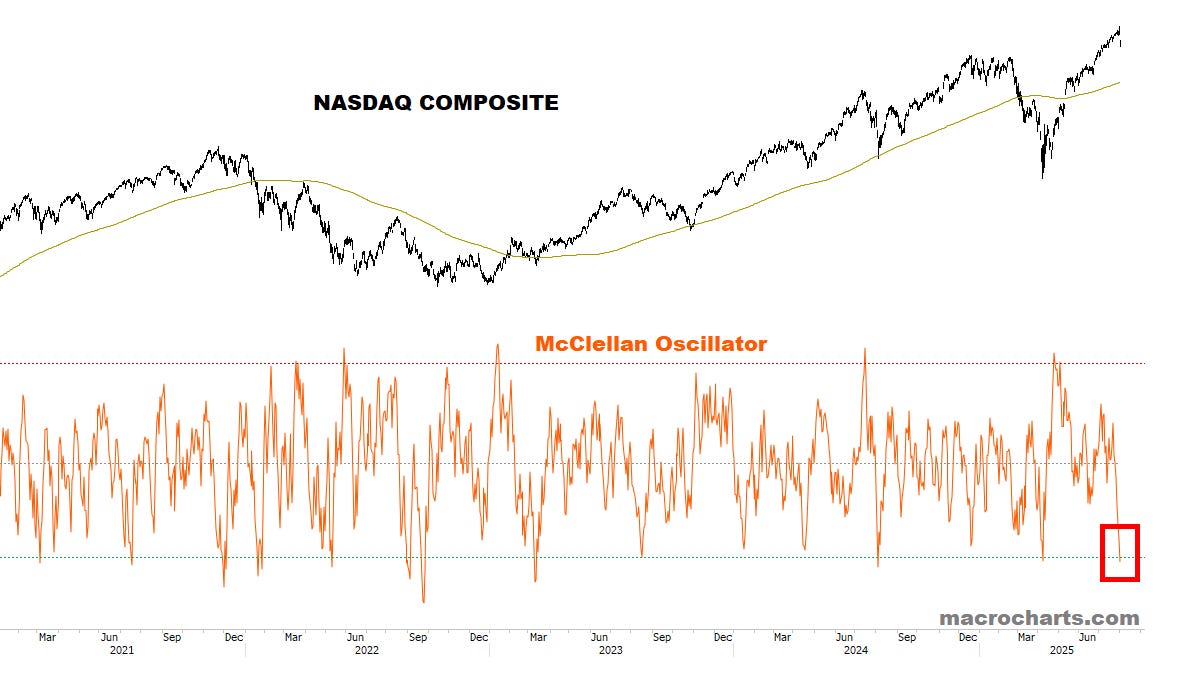
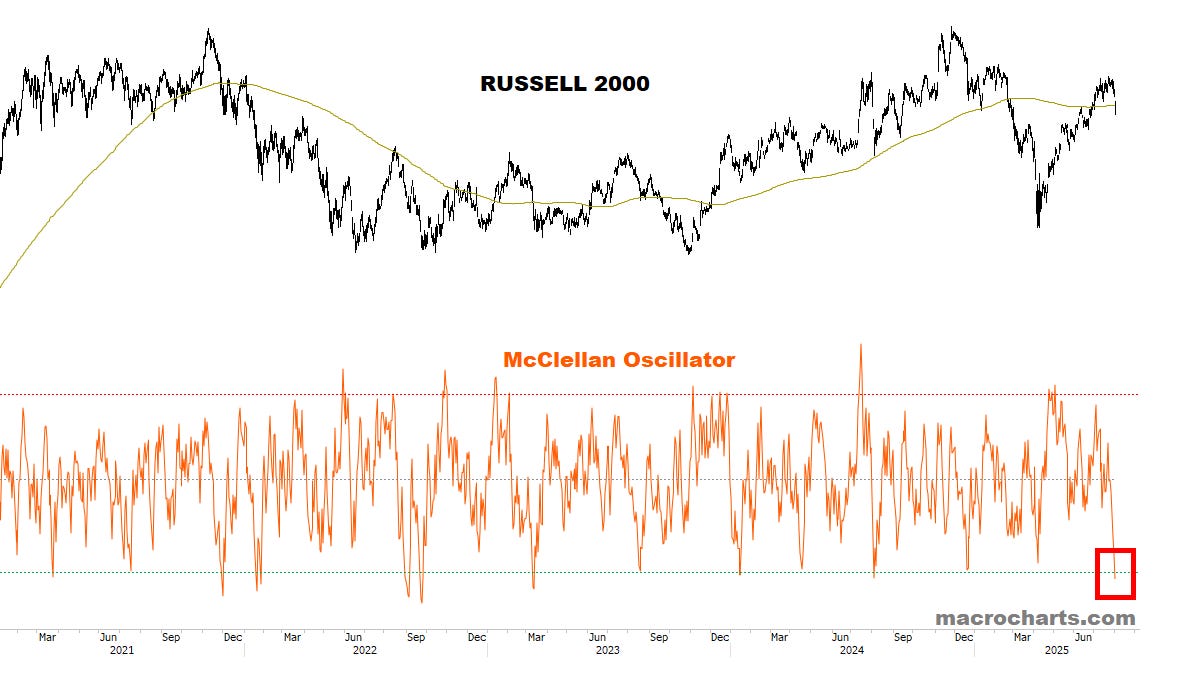
Short-Term Breadth continues to deteriorate and looks headed for another oversold reading:
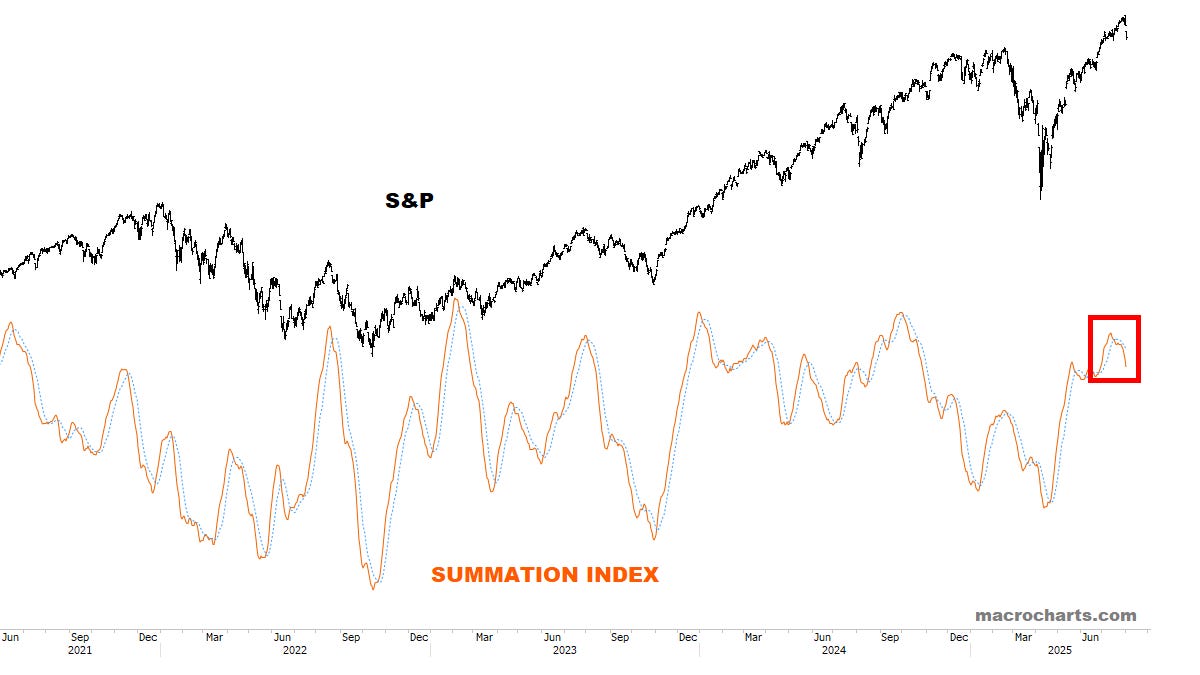
Summation Index remains on a Tactical Sell:
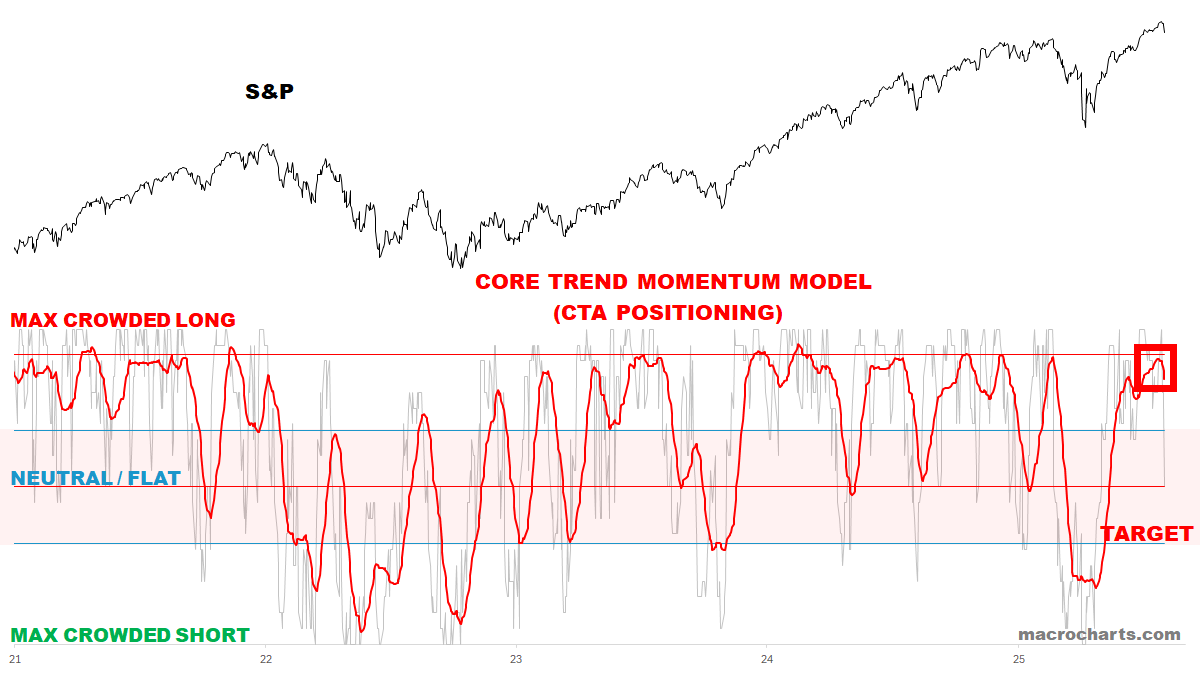
CTA Equity Trend positioning has turned down from topping range — looking for an oversold reading into later Q3:
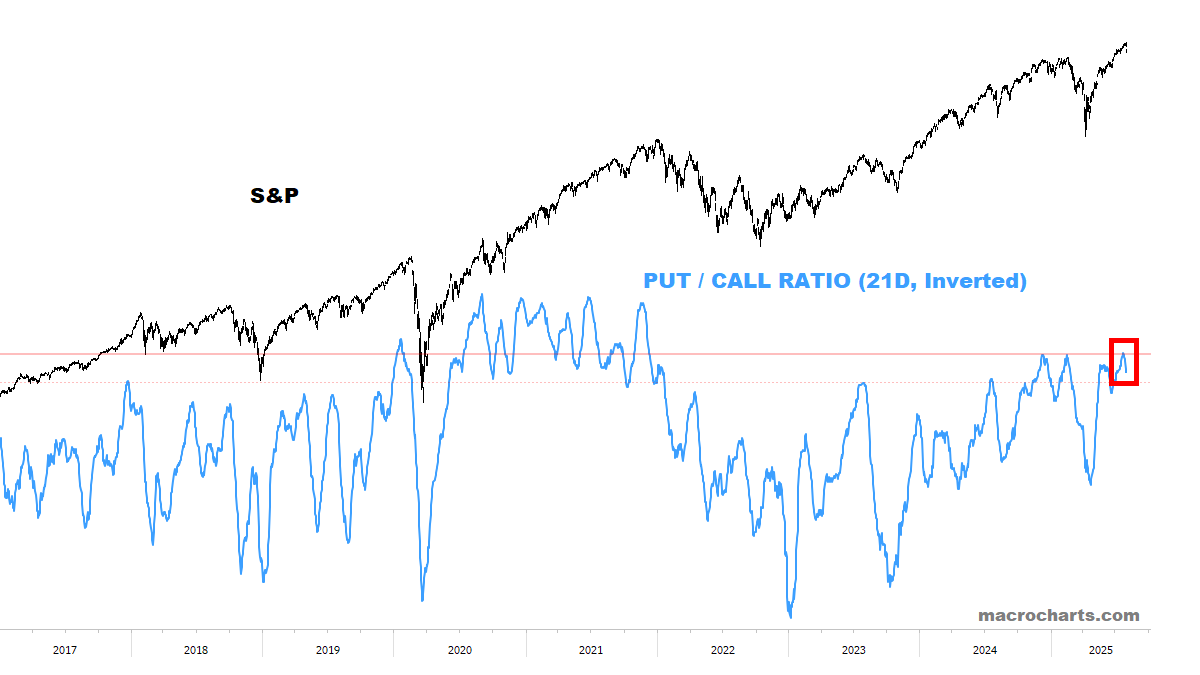
Put/Call Ratios have turned from February topping levels — another important Sell signal.
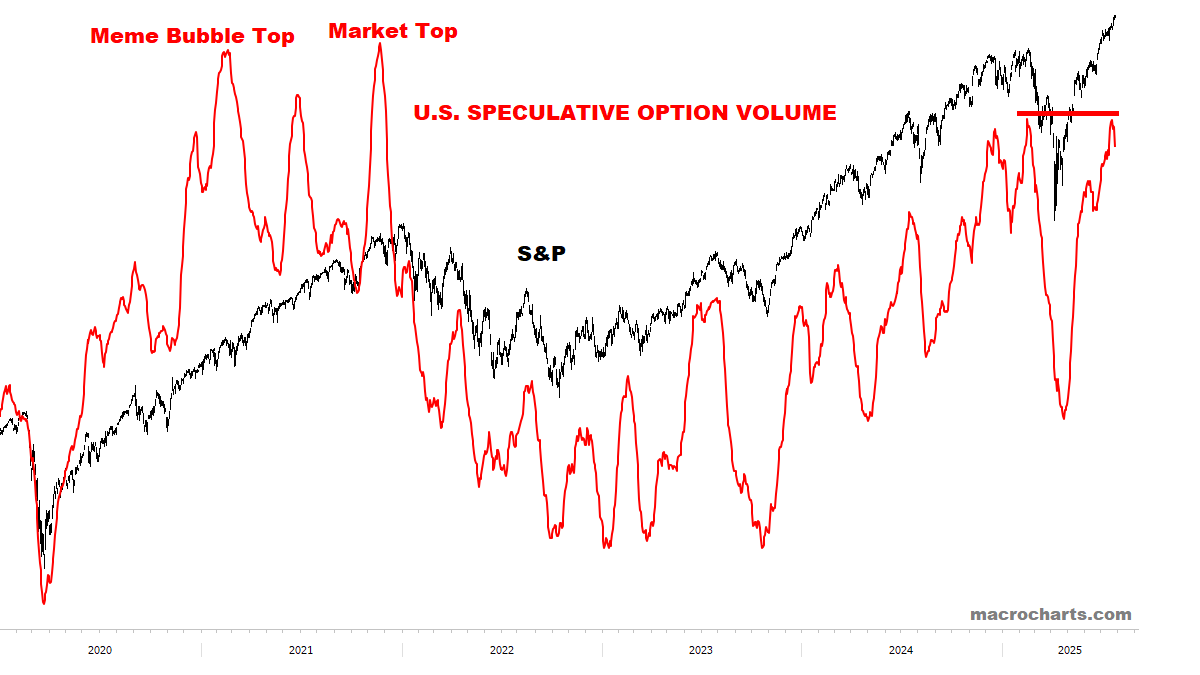
Speculative Option Volumes have likely topped:
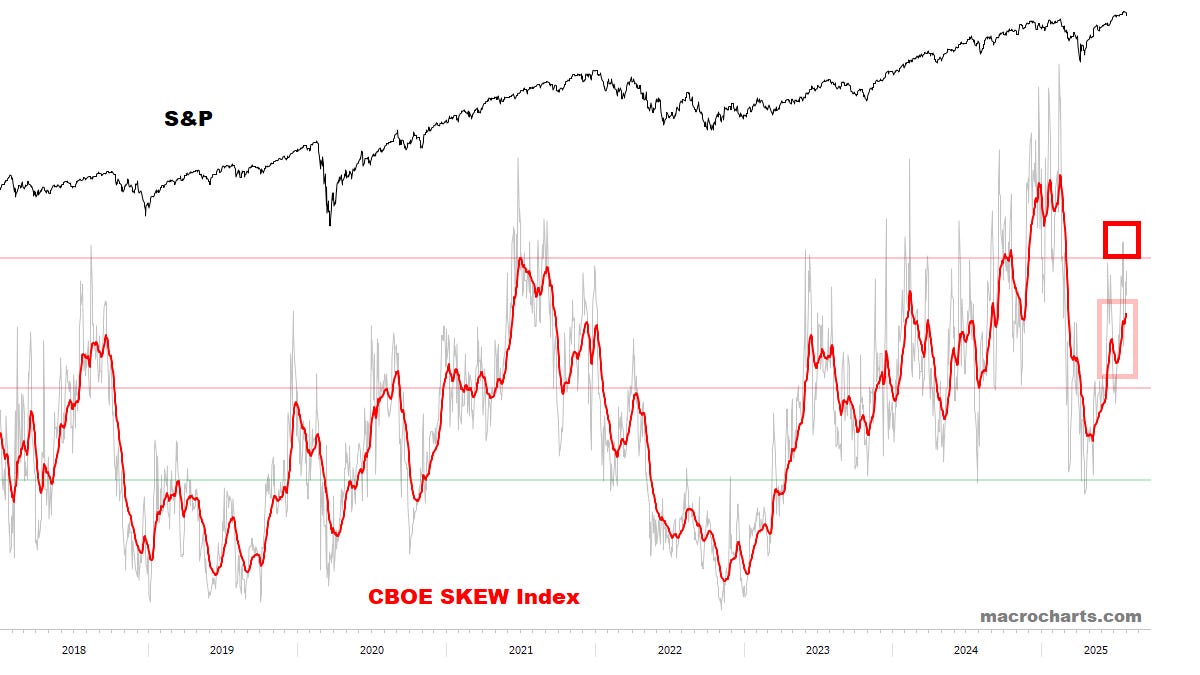
Option Skews remain elevated:
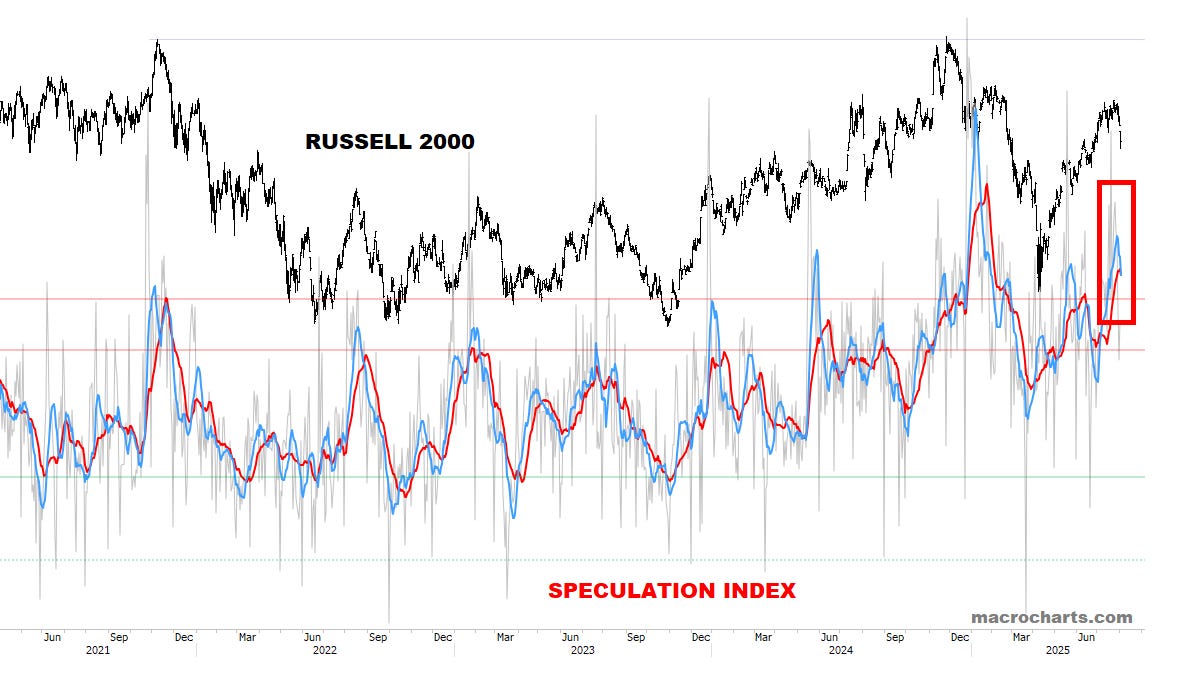
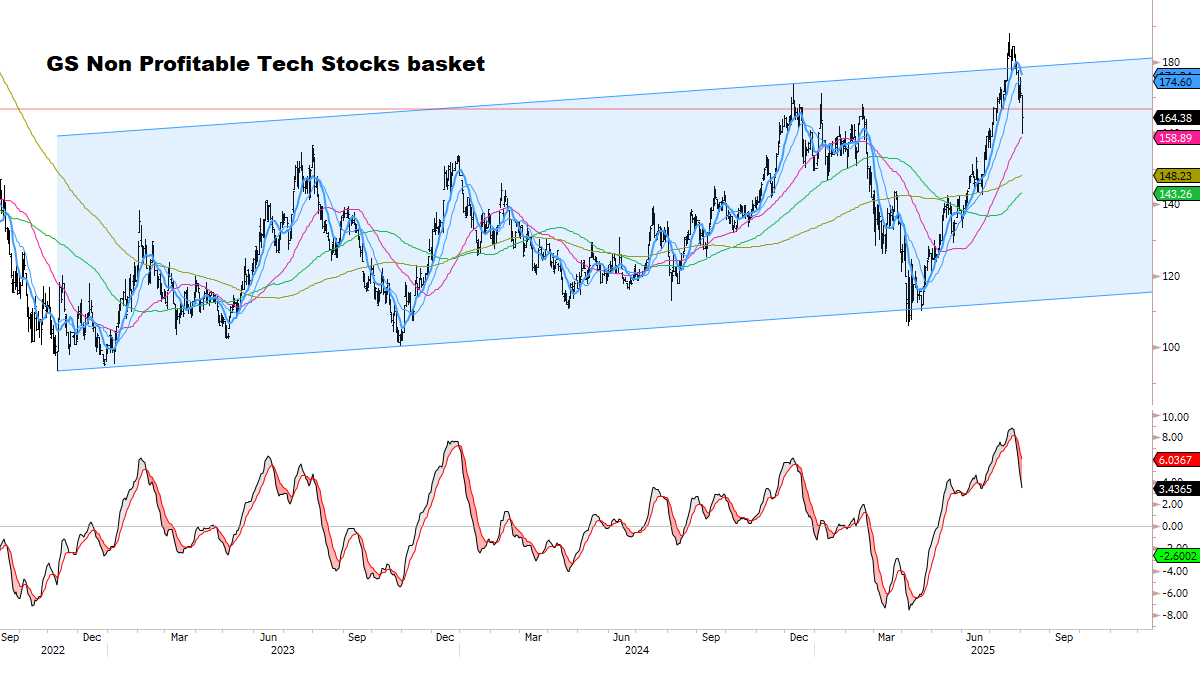
Speculation Index remains a major concern:
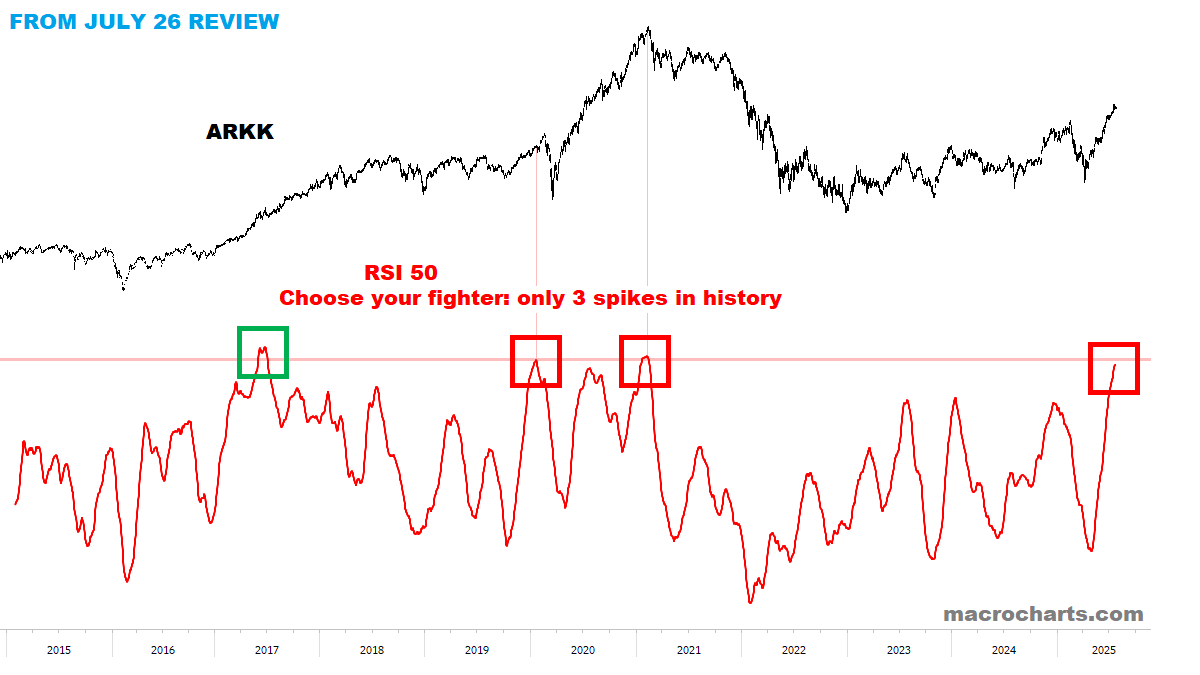
*Reiterate: consider avoiding exposure to low-quality / speculative stocks — as discussed recently. This likely signals a peak in “Animal Spirits” is now IN.
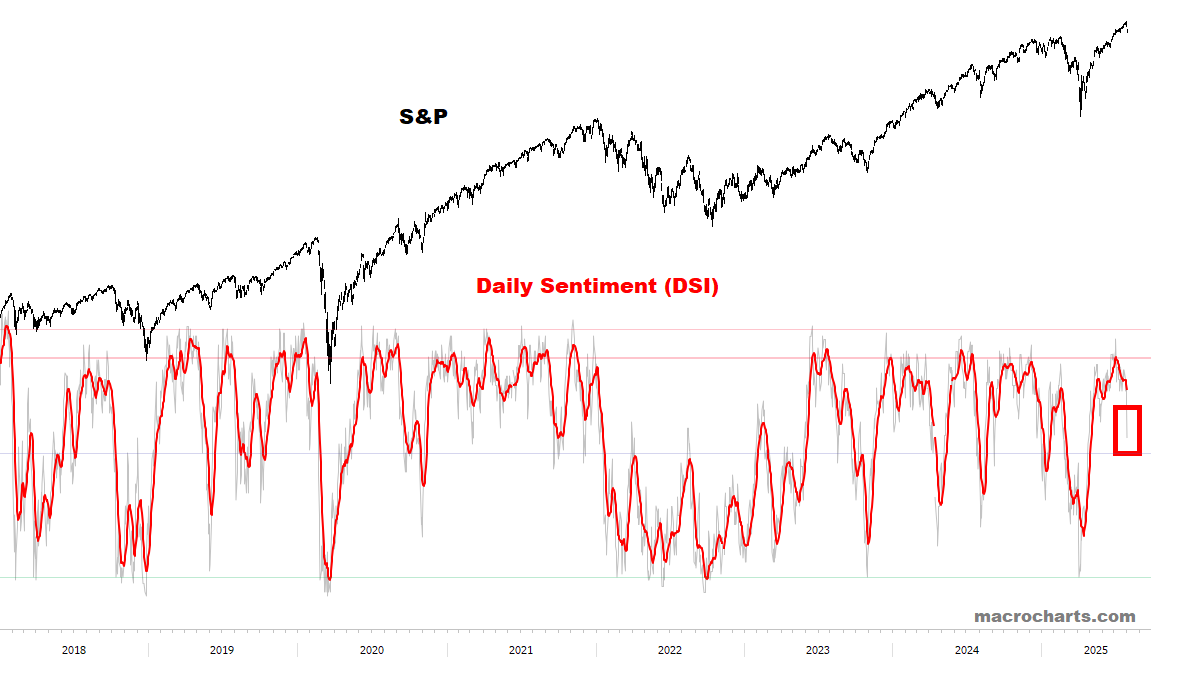
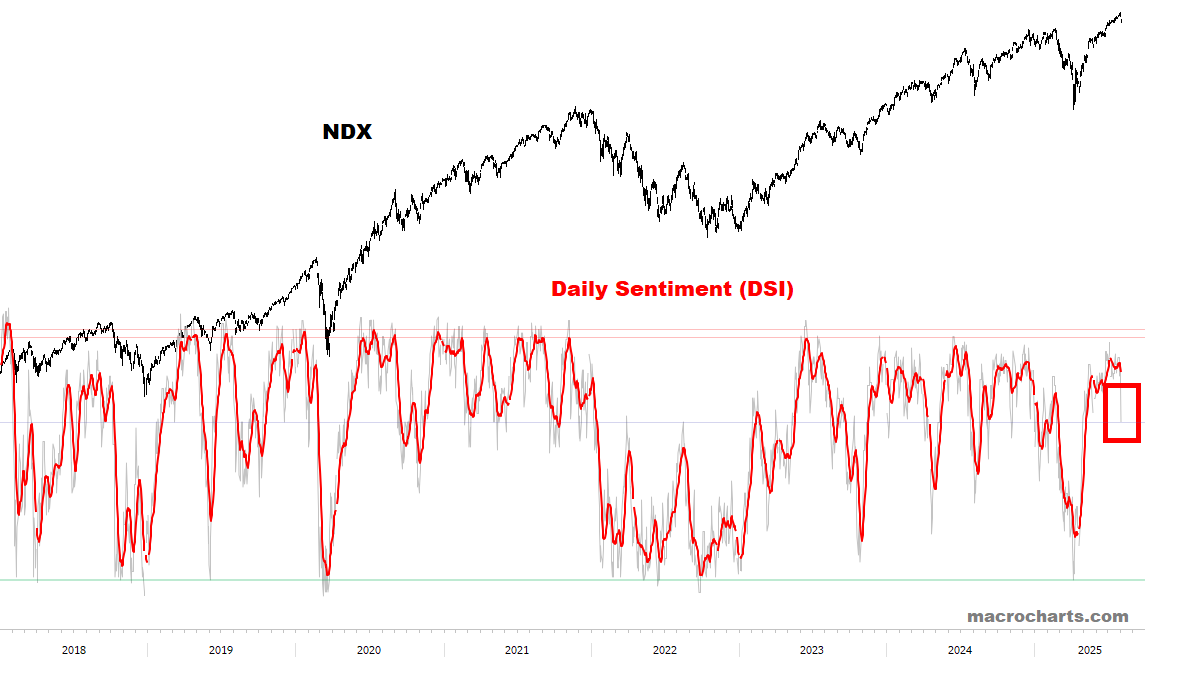
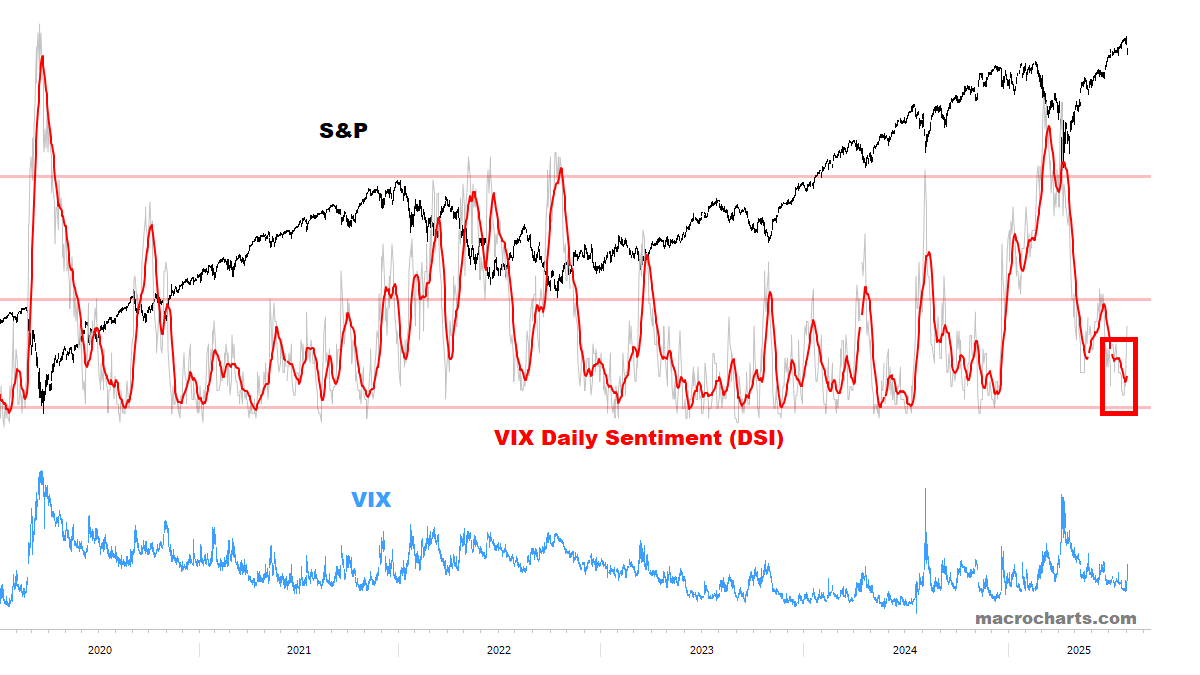
Equity Sentiment has turned down / has room to fall:
VIX Sentiment may have turned up ahead of schedule — not ideal, but have to adjust to what’s happening:
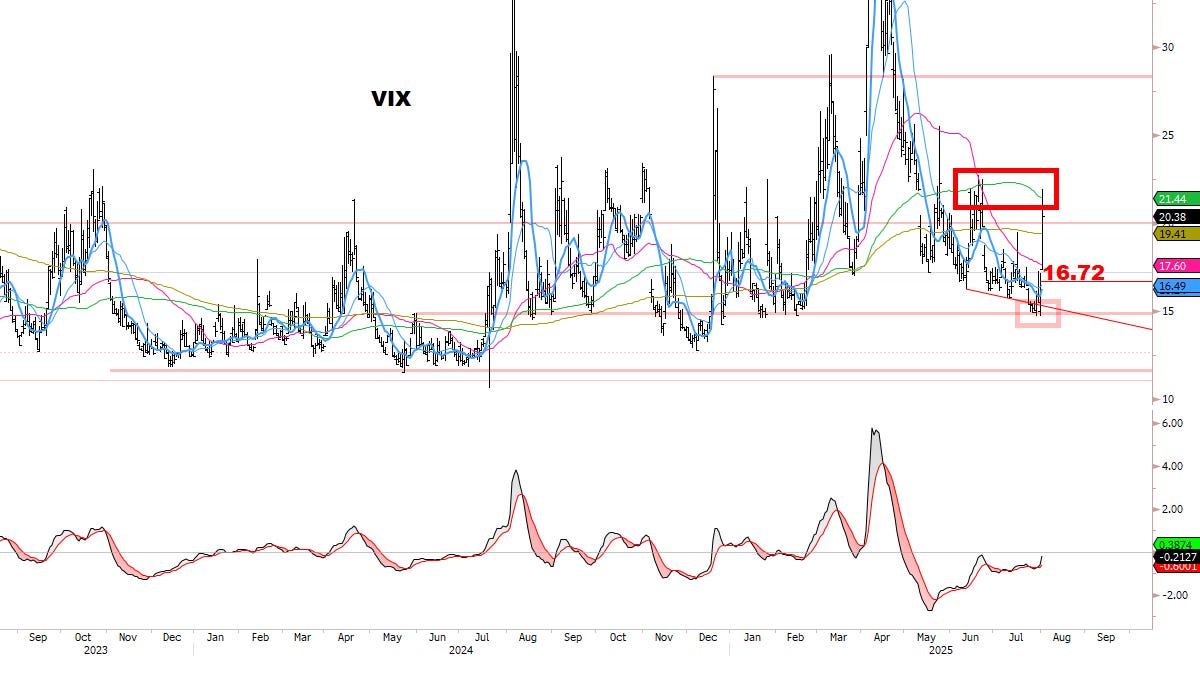
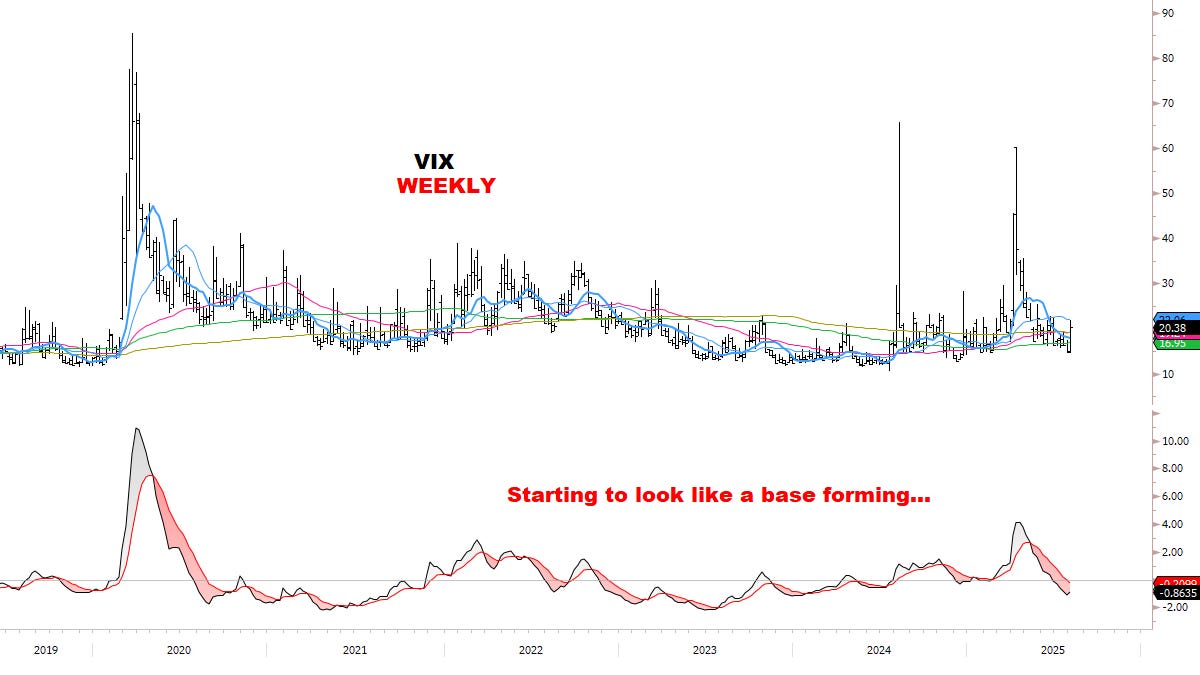
VIX reached our target range last week and has turned up:
VIX is testing June resistance (red box).
If VIX pulls back, monitoring the 16.72 GAP for possible retracement.
*Lean to put on SPY Put hedges if this gap gets retested.
DOLLAR
Dollar buy signals confirmed.
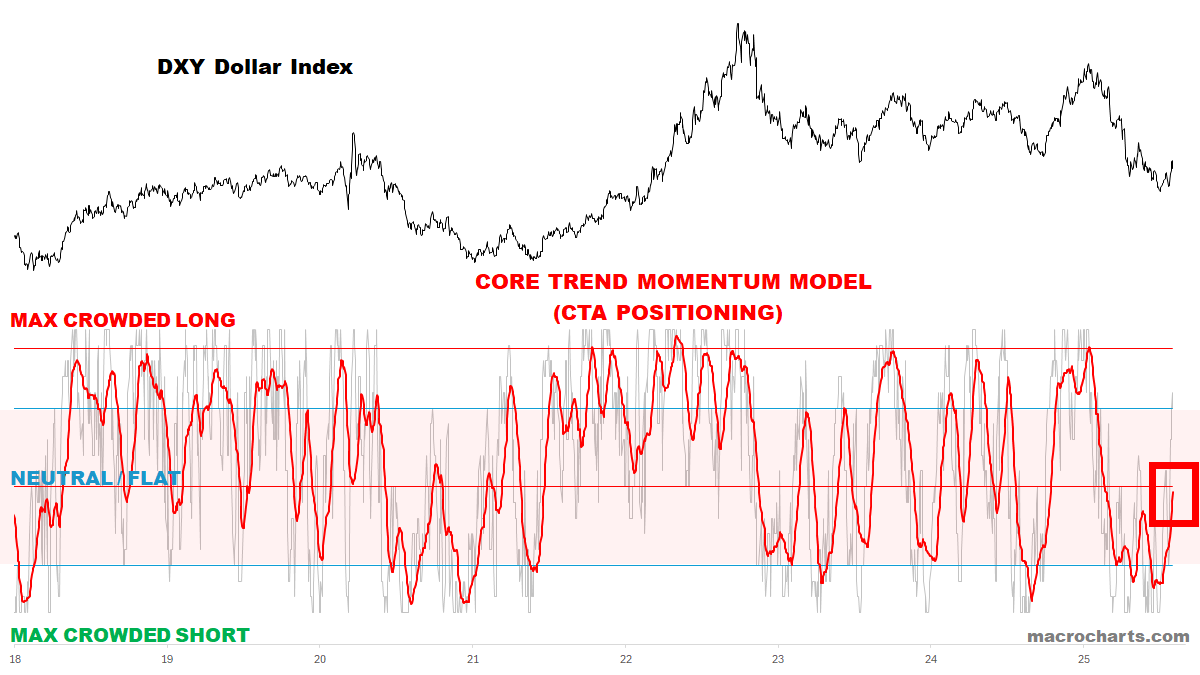
CTA Dollar Trend positioning continues to build:
Dollar Sentiment has room to recover higher:
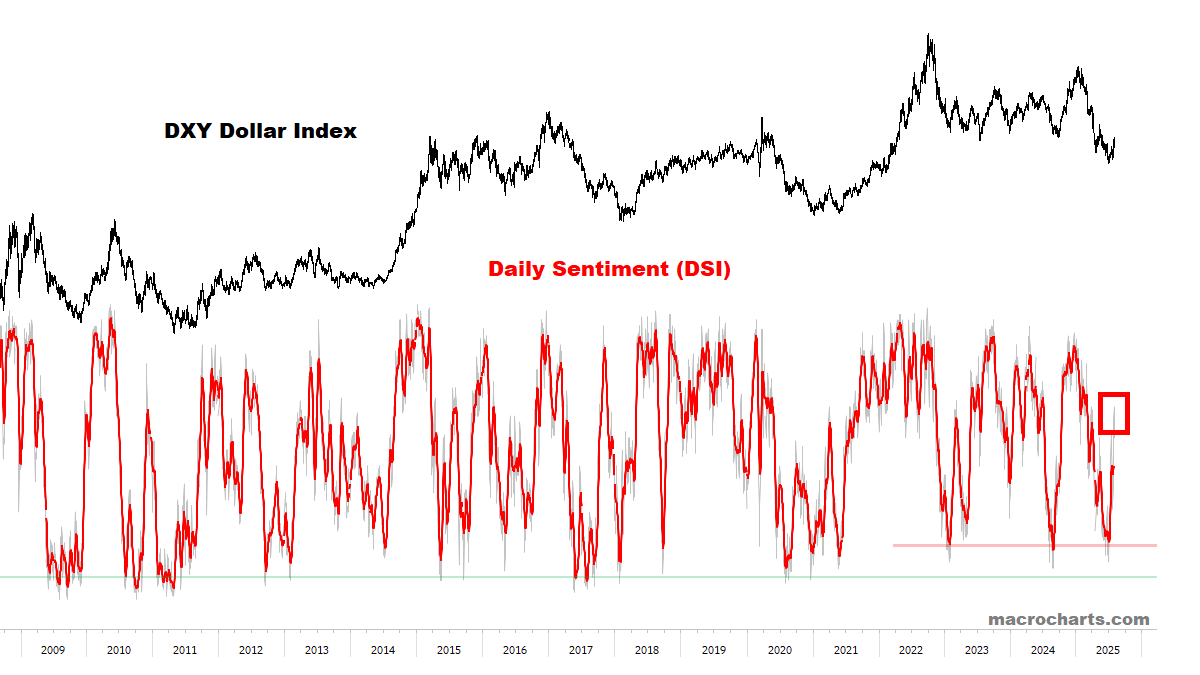
Investors remain extremely Short the Dollar — an important reason why I think downside should be limited, and the worst-case scenario may be more basing (discussed earlier). “Hard to fall from the basement”:
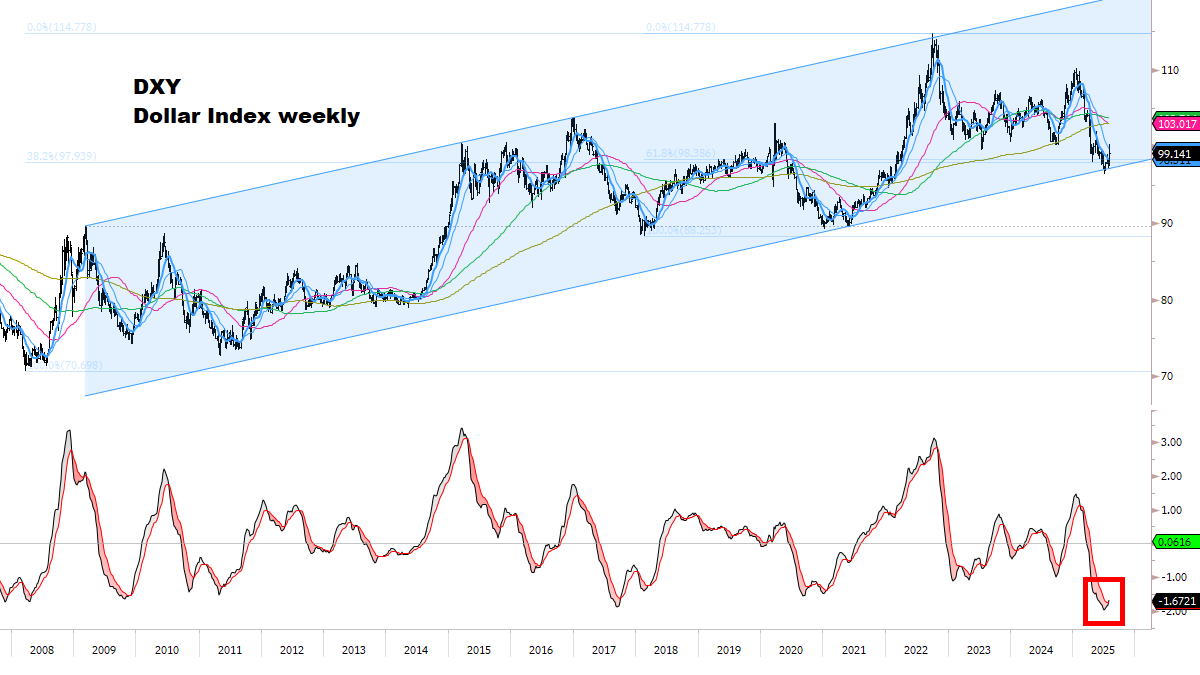
Dollar momentum has room to recover:
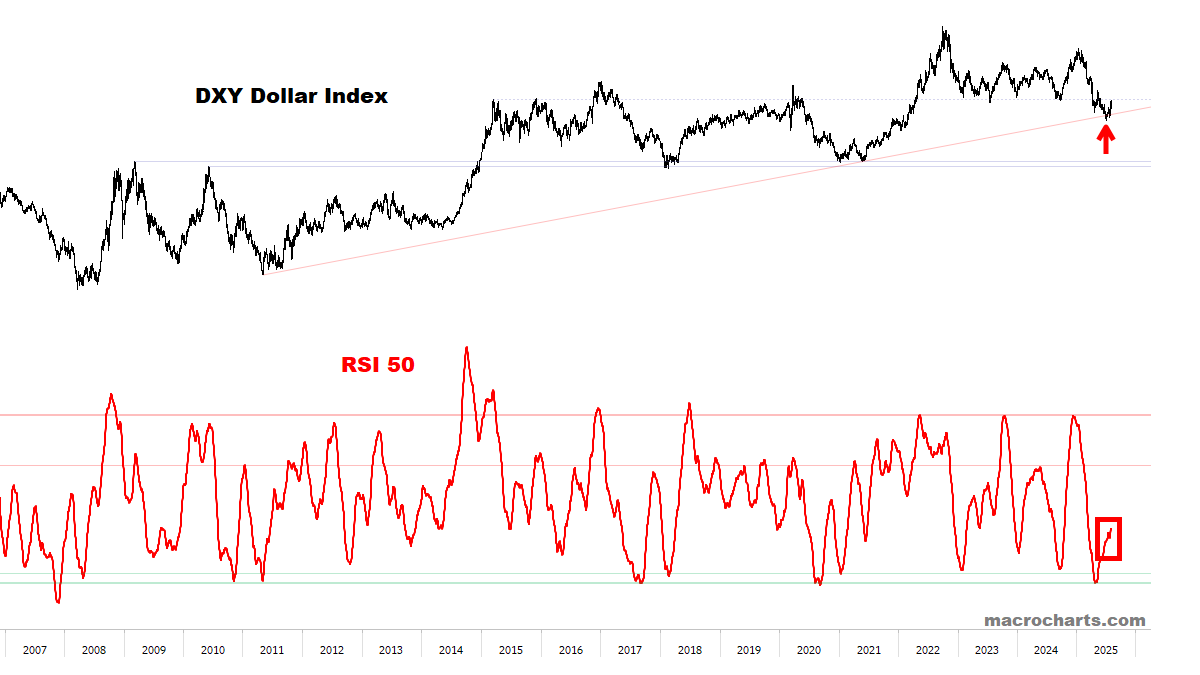
The chart continues to develop a historic bottom:
Updated:
Daily:
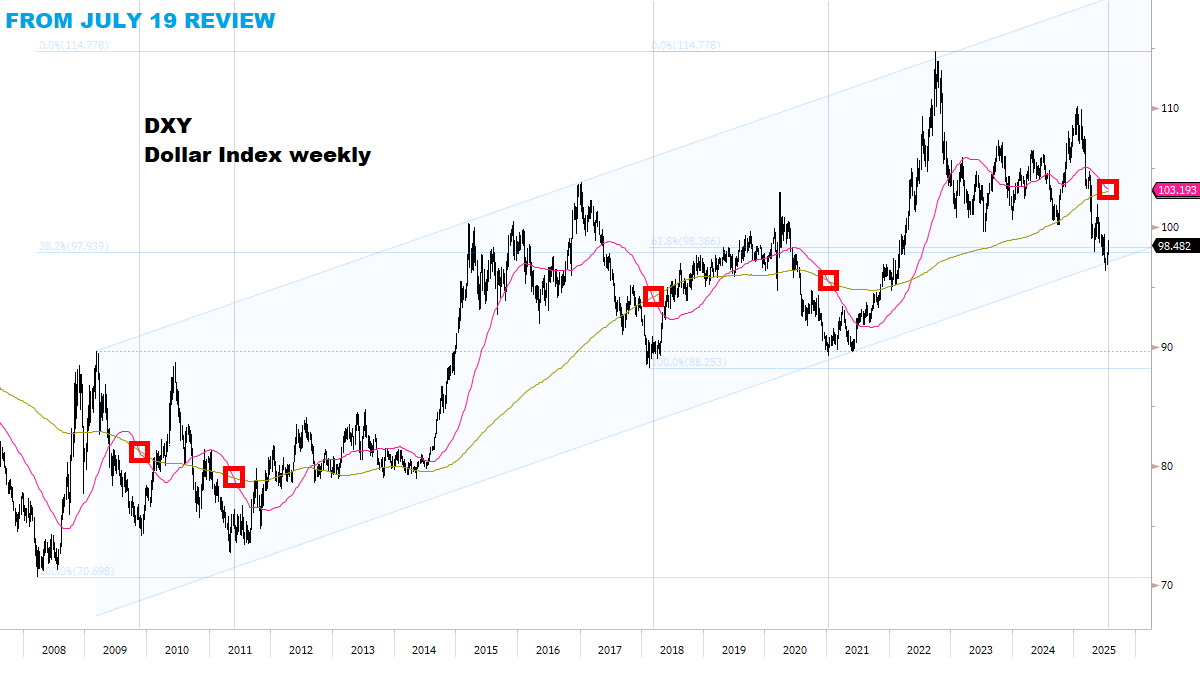
From July 19:
For more than twenty years, when the Dollar triggered a weekly Sell cross, it bottomed — and then rallied to the 200-week average (and beyond). The initial ~103 upside target may be conservative — but I’m working with this for now:
BONDS
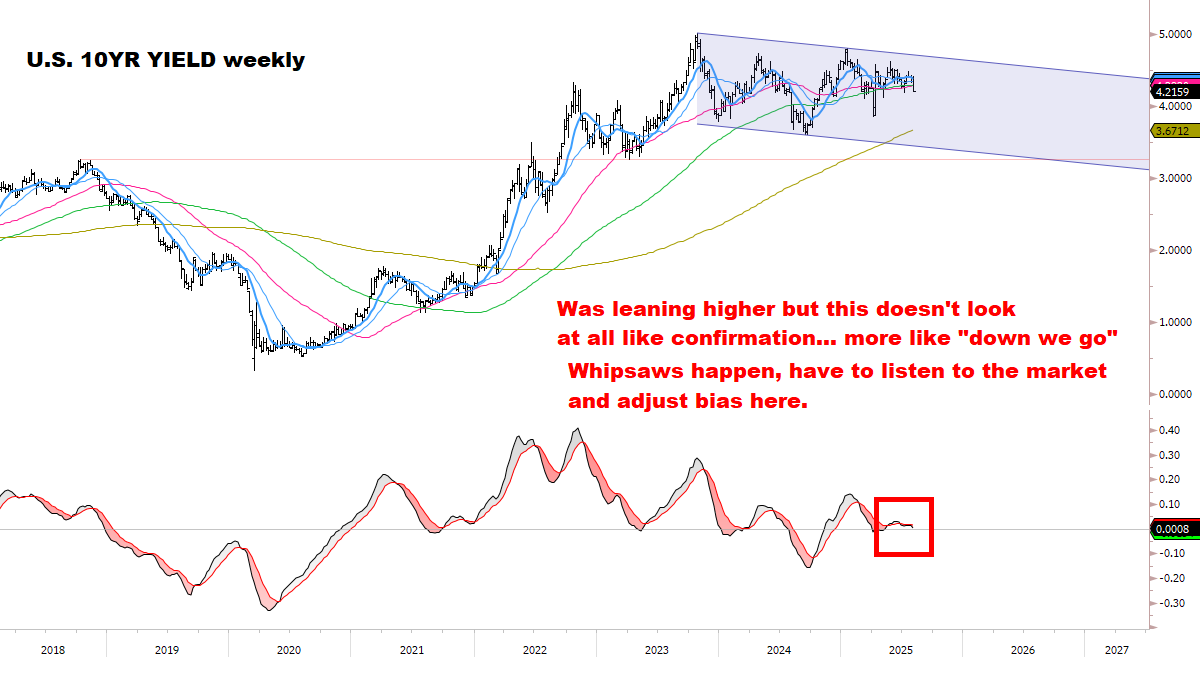
Rates screaming “Too Late”…
NEW big signals — looks like a major shift:
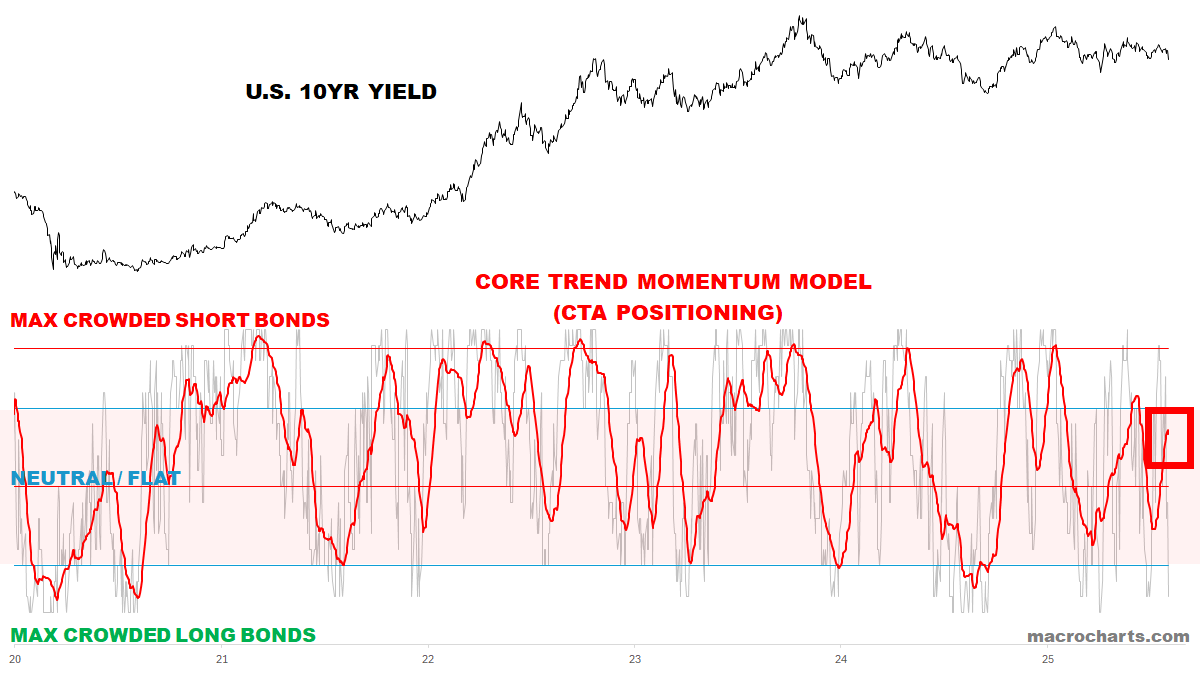
CTA Rates Trend positioning may be turning to lower Yields:
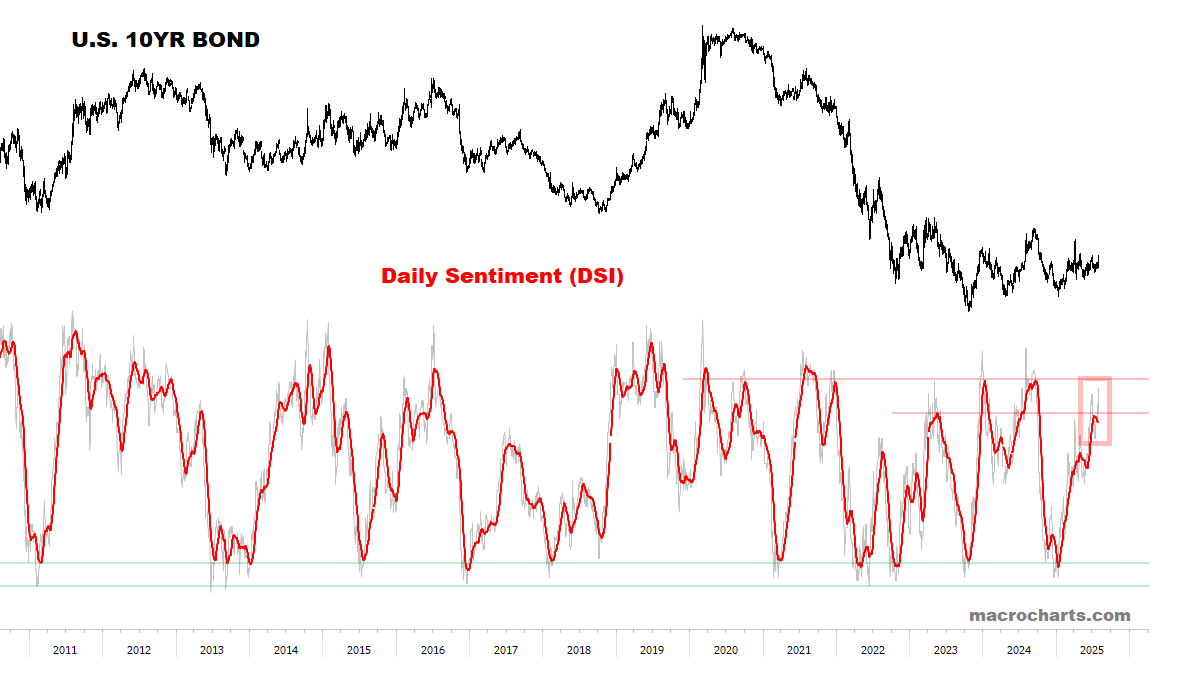
Bond Sentiment is extending higher:
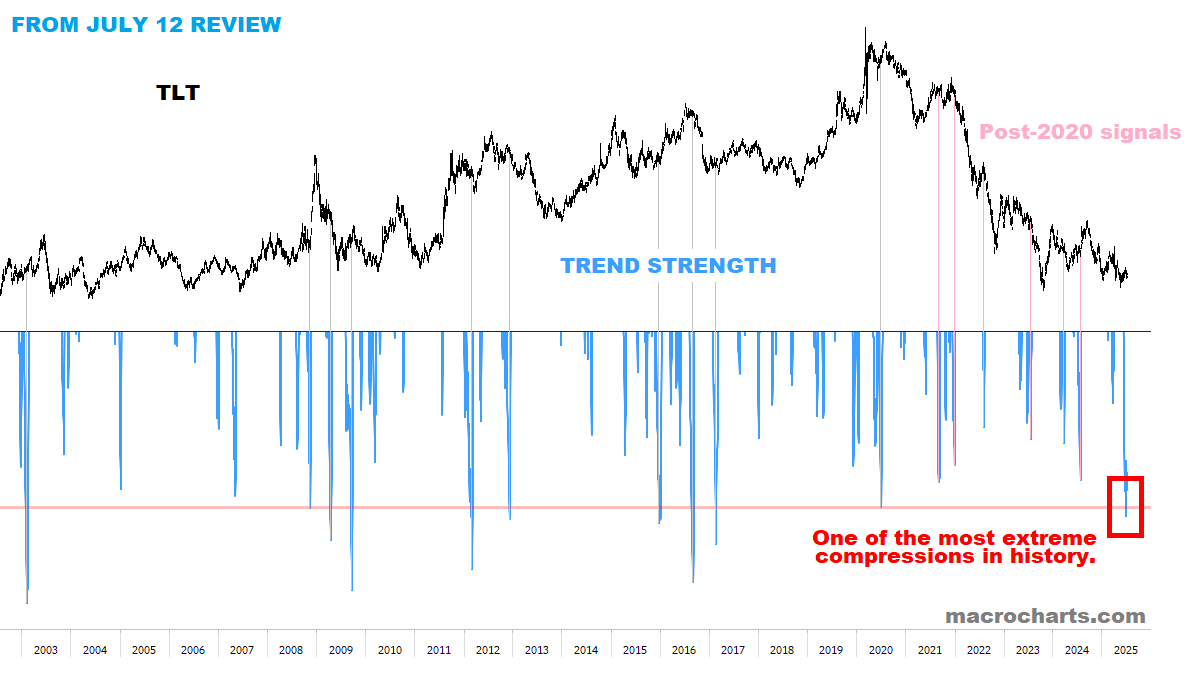
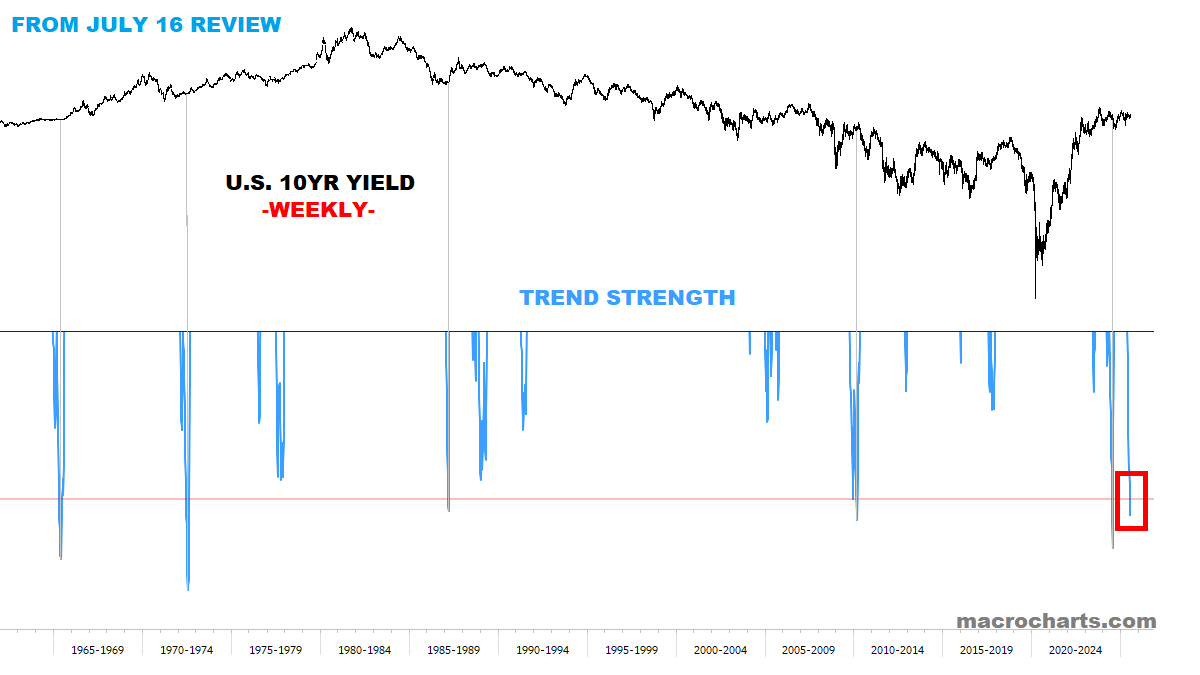
Rates were recently among the most coiled in history:
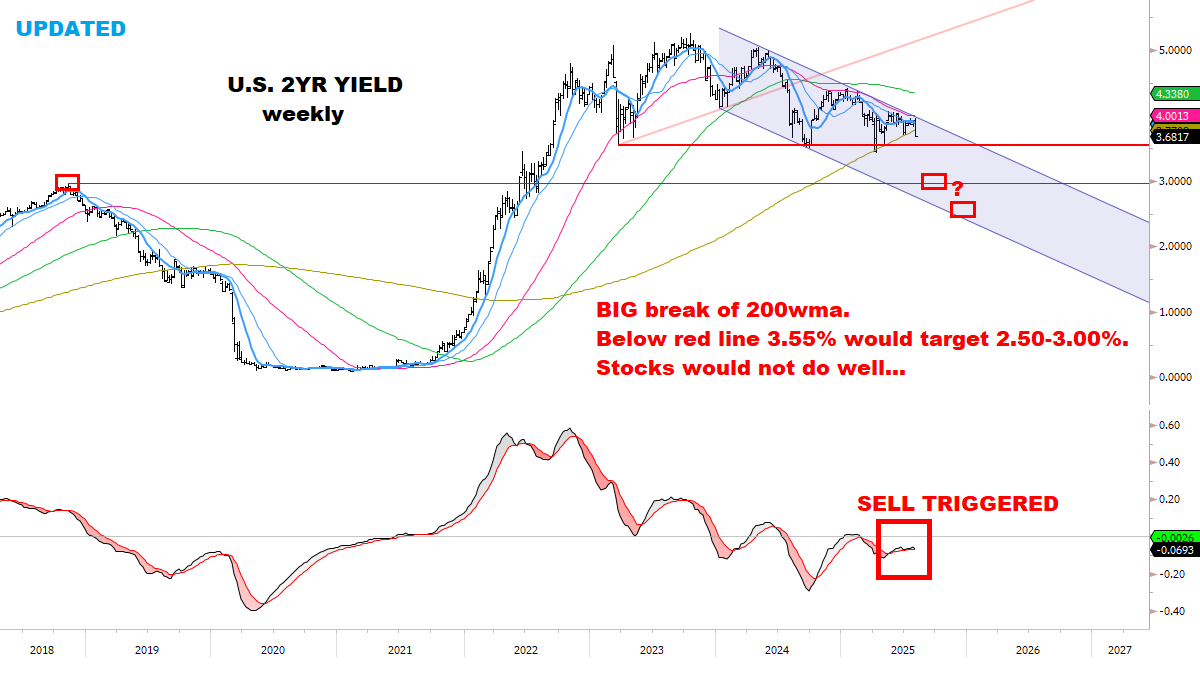
The Trillion Dollar Rates Chart: 2YR Yields look like a “BAD NEWS IS BAD NEWS” regime starting — if so, then the Fed is “Too Late” indeed…
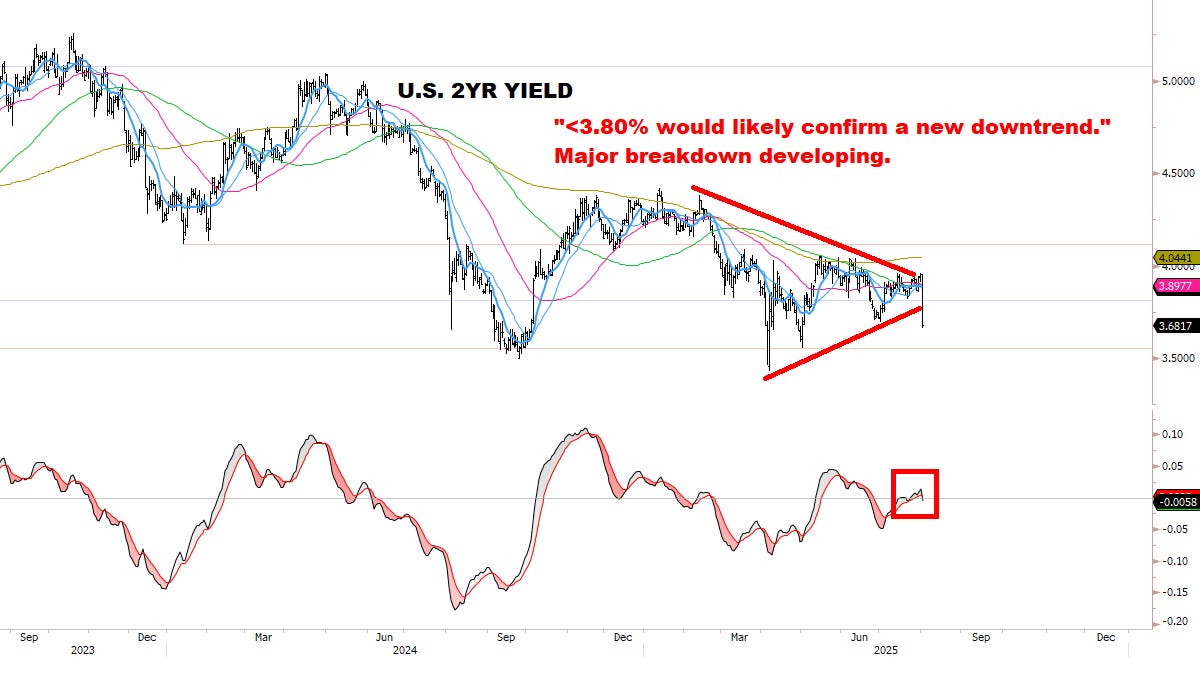
2YR Yields are finally moving OUT of the multi-month coil. The BIG action is in the front end of the curve, leading the entire Rates complex. Looking to open a Long position in Two-Year Futures.
The Trillion Dollar Question: is 2YR about to break down?

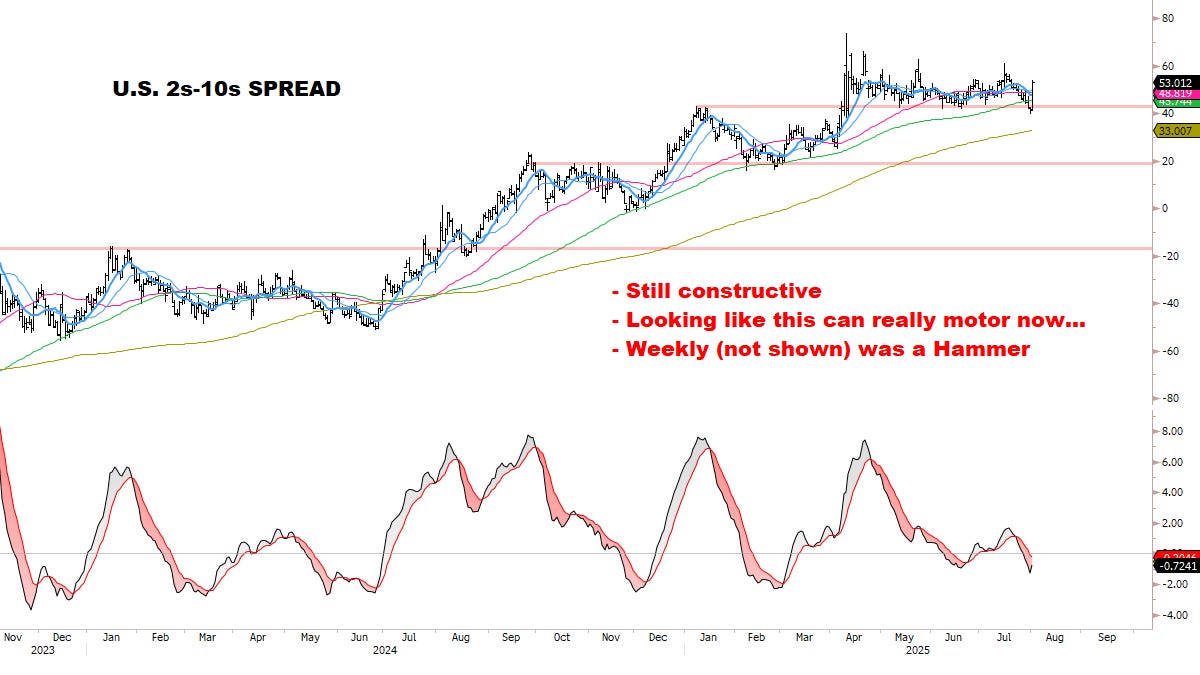
Steepeners are launching higher — this week’s action increases our conviction further:
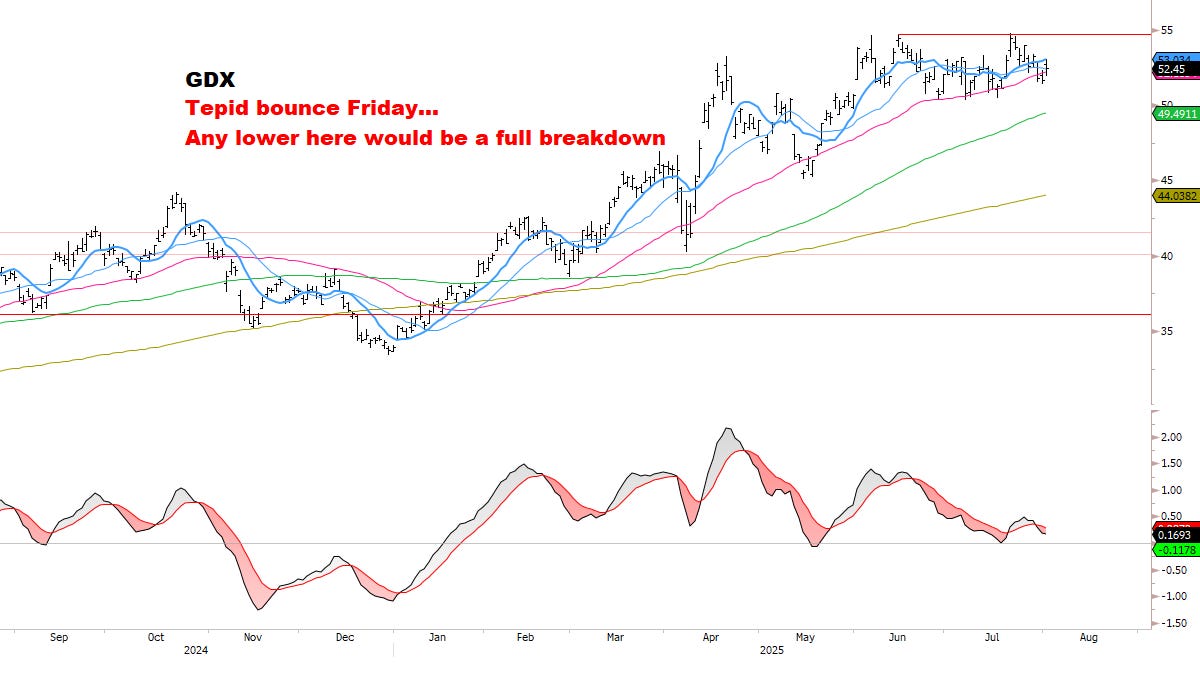
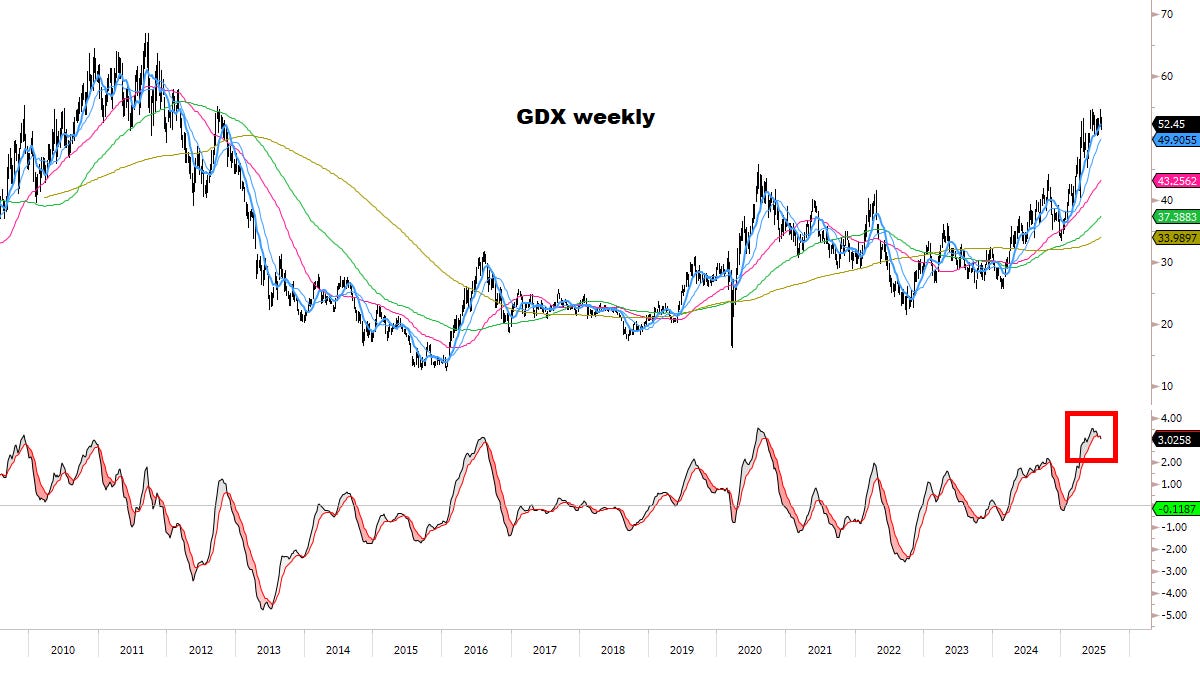
PRECIOUS METALS
Last week’s exhaustion patterns have been confirmed.
We continue to avoid the group for now. And remember: PMs and Miners did NOT trade well in the April Equity decline (beware).
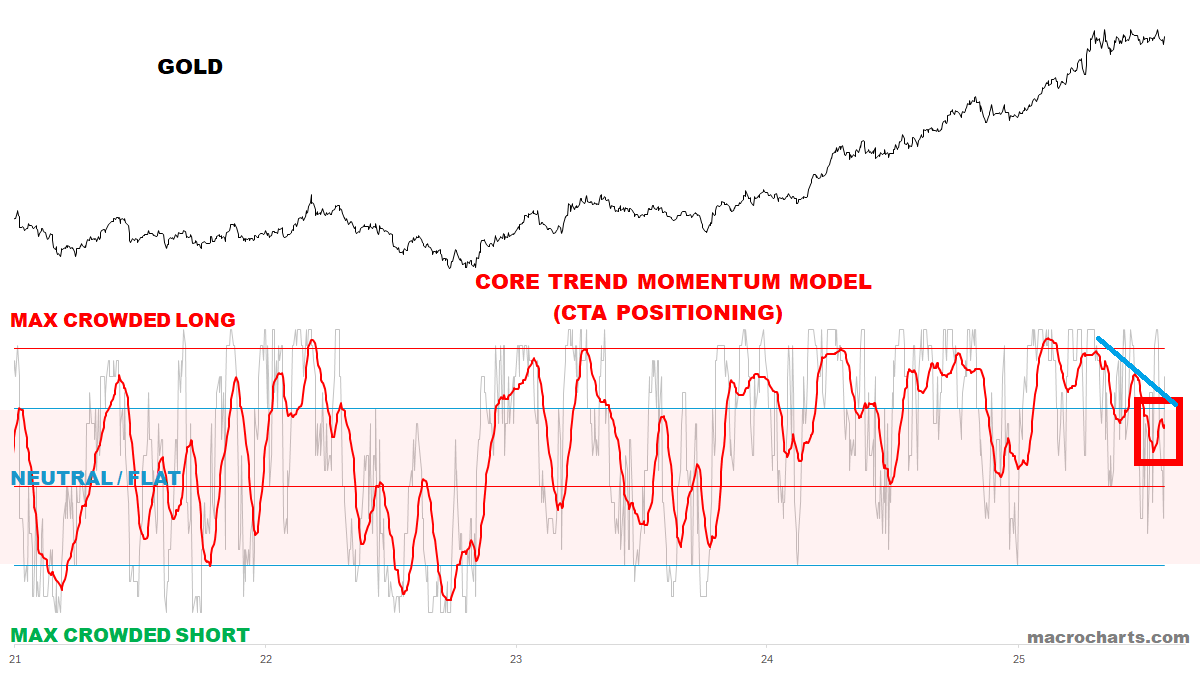
CTA Gold Trend positioning may be ready to break down:
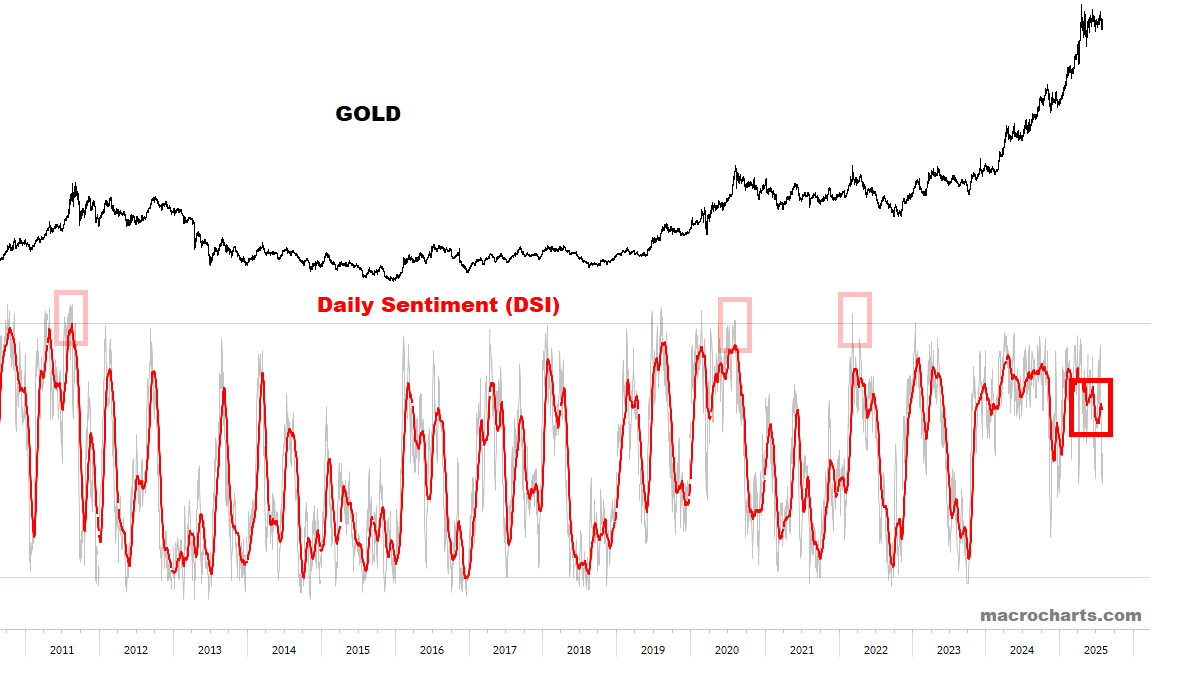
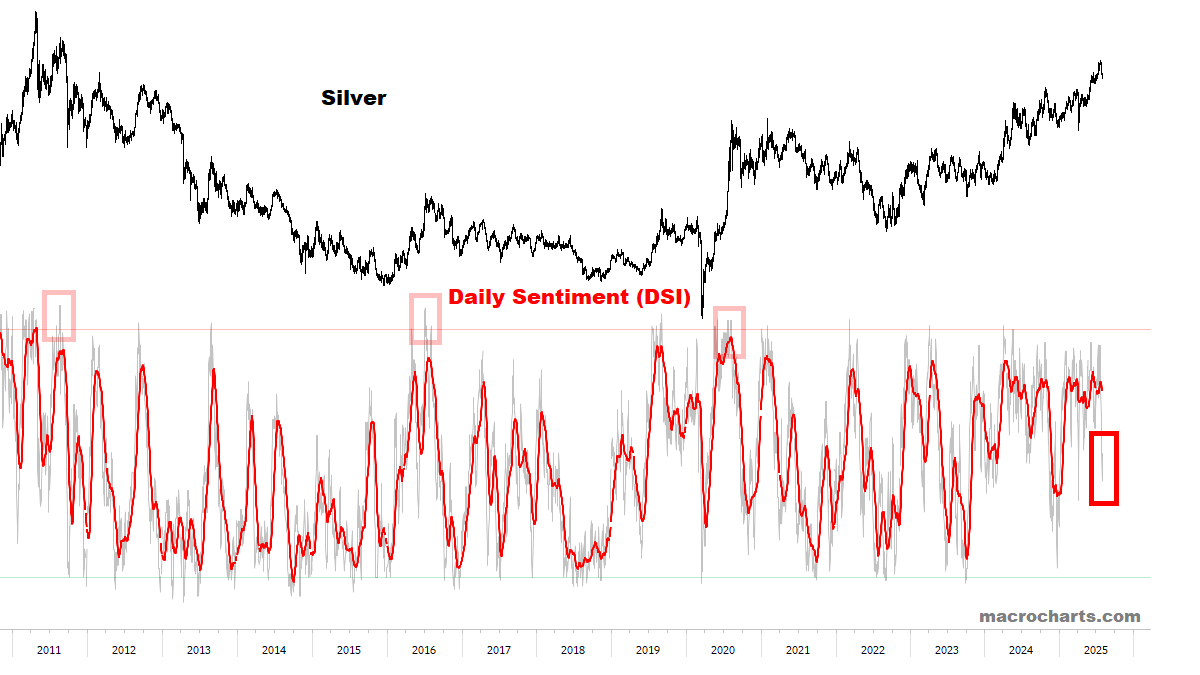
Sentiment remain in limbo — no big signal either way:
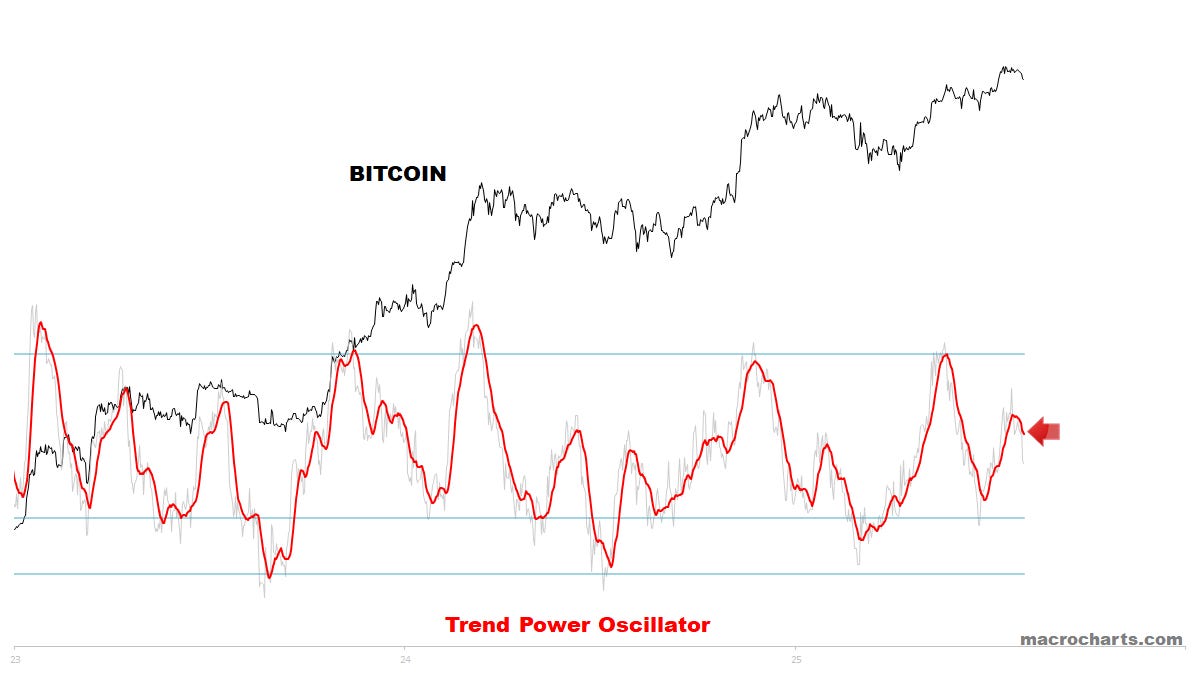
BITCOIN
Trend Power Oscillator never reached “big top” conditions — so this turn down suggests a tactical top only:
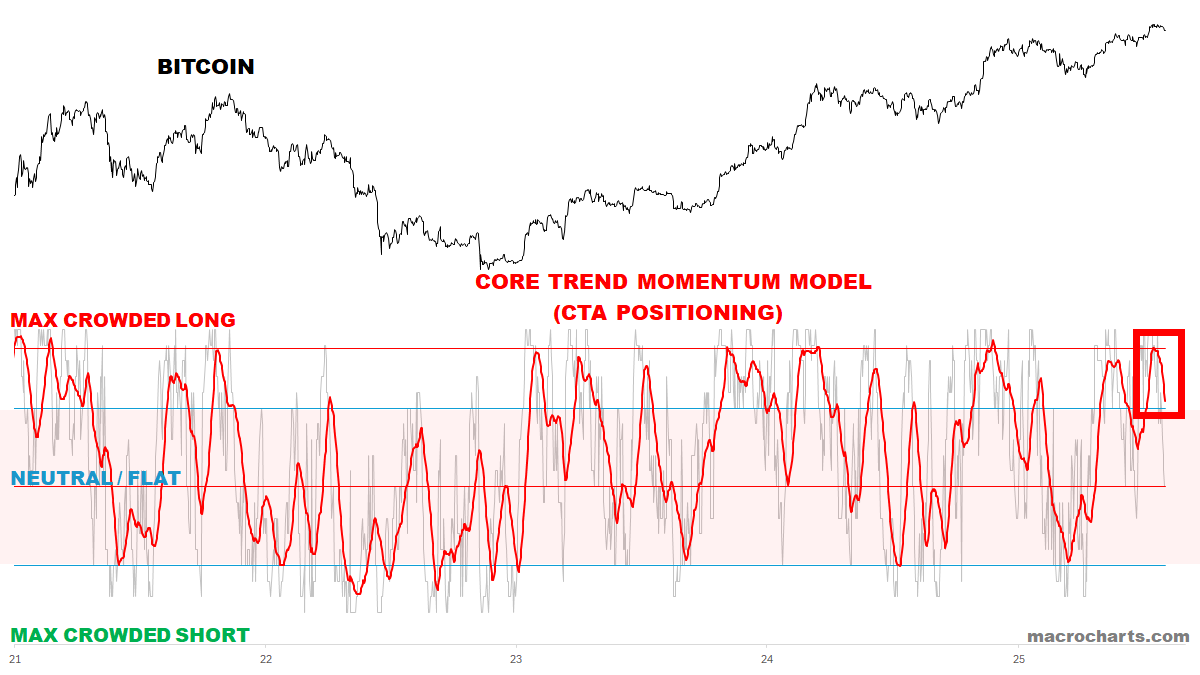
CTA Trend Positioning is on tactical Sell:
KEY TECHNICAL CHARTS
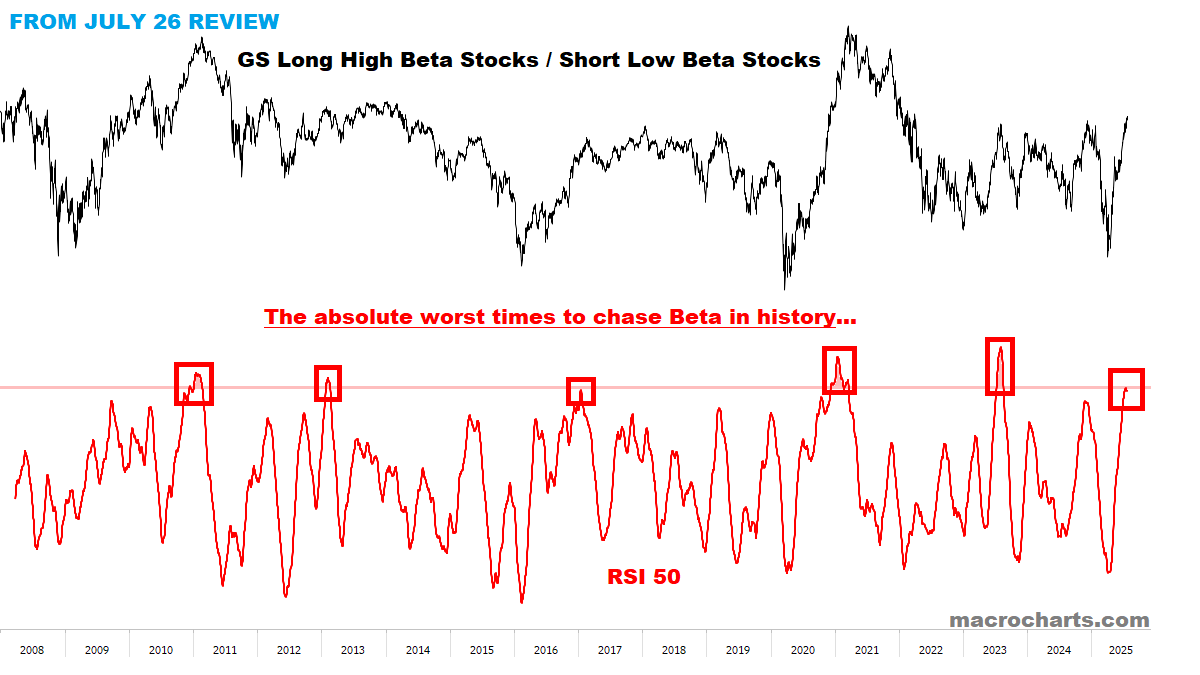
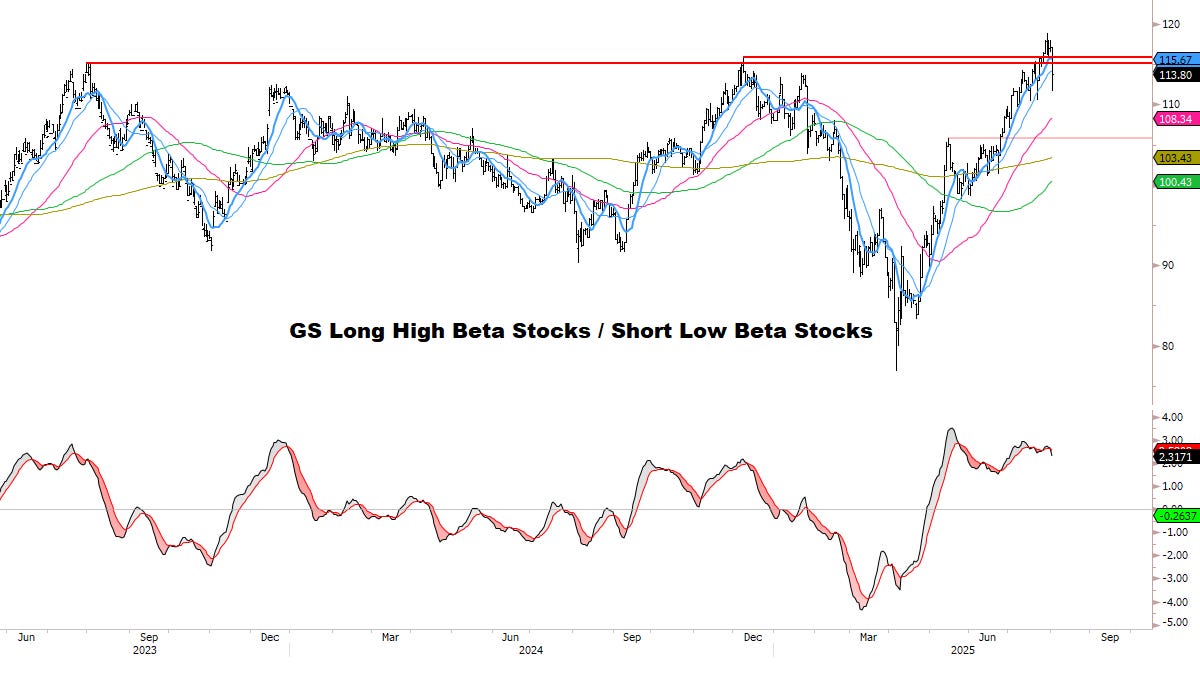
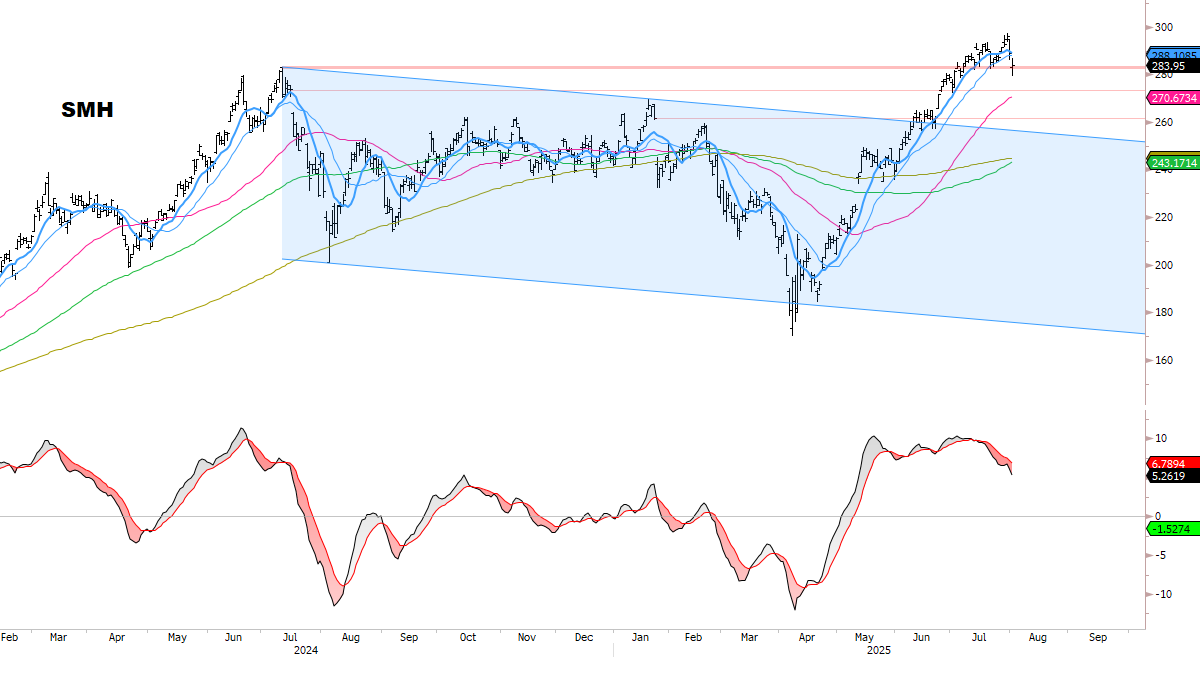
High Beta Stocks are turning down from a big top — ”Animal Spirits” now under threat:
*If the market continues to price weakening data coupled with a too-late Fed, this whole group is *the* most vulnerable. Catalyst for a nasty factor unwind…
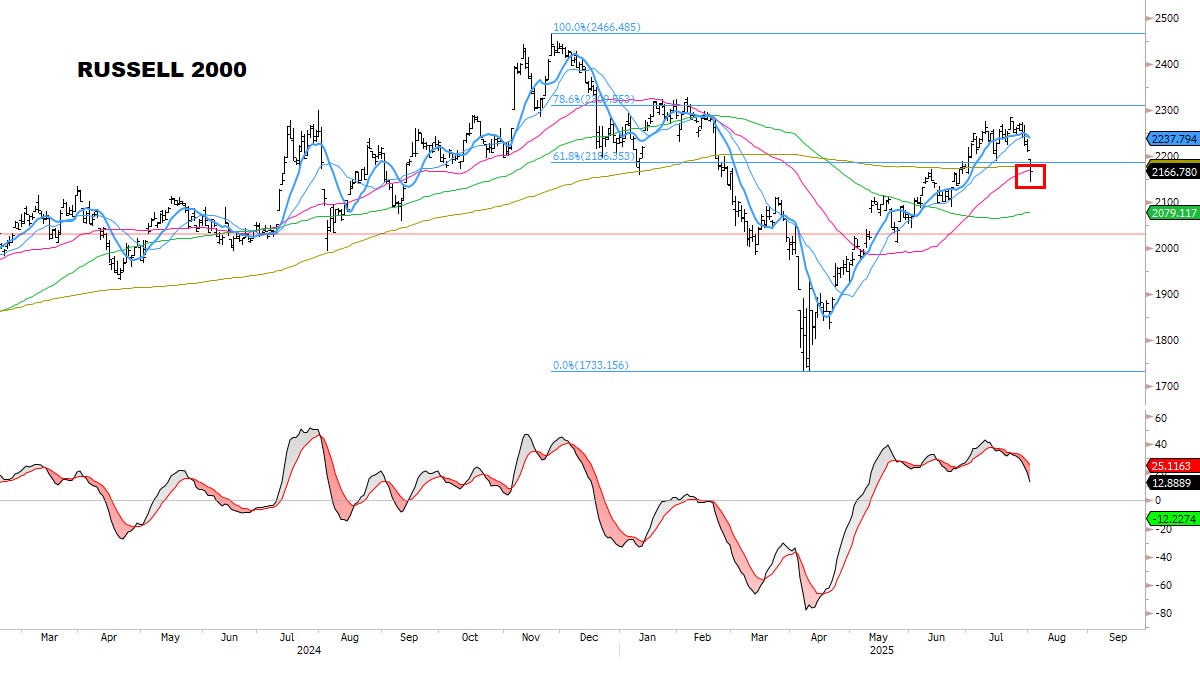
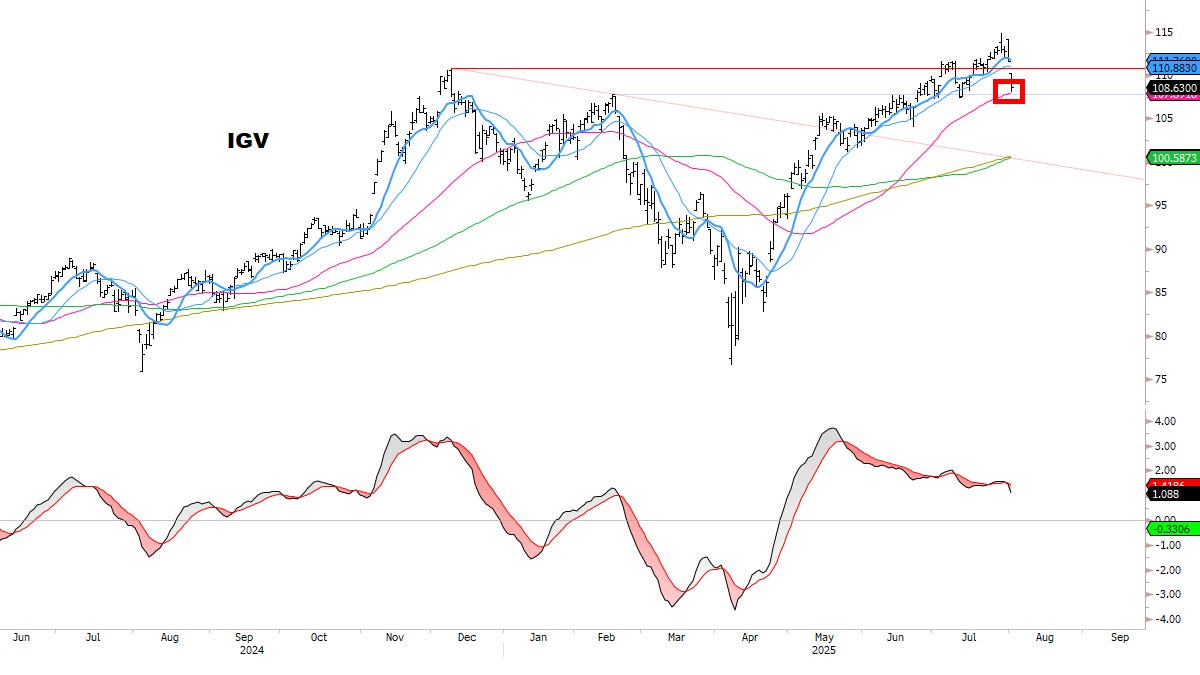
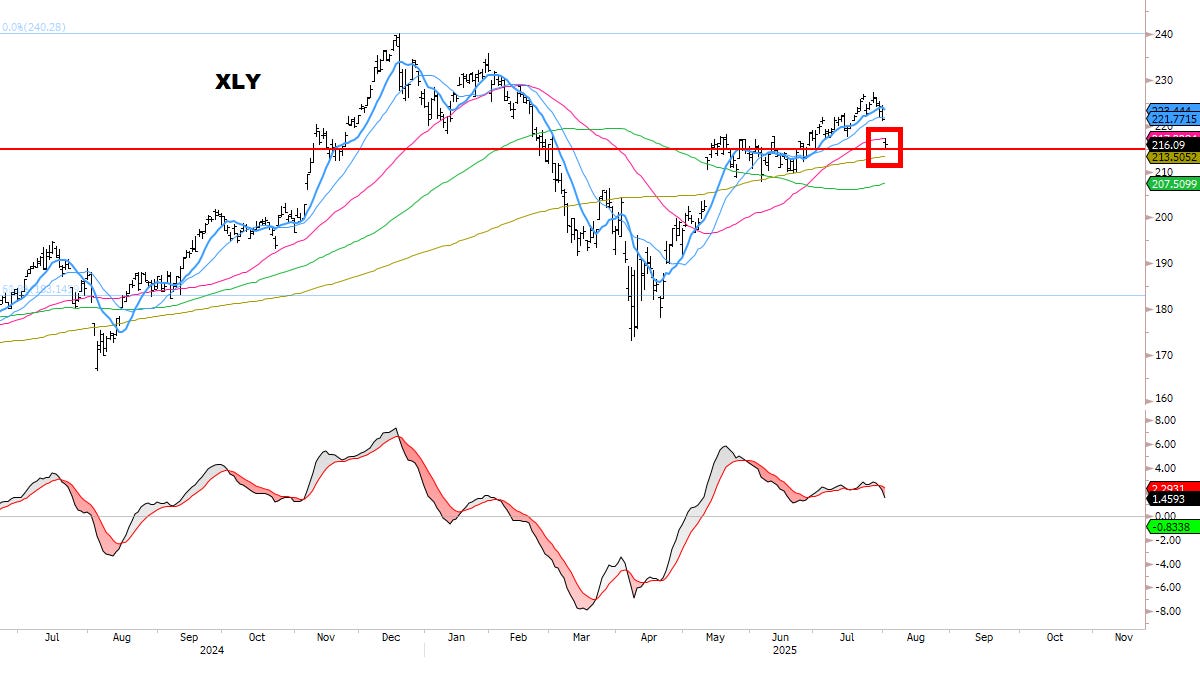
Bull Trap reversals everywhere:
Core Indexes / Big picture
Core Indexes are under threat, with Bearish reversals triggered.
Participation has weakened significantly under the surface.
VIX and Credit Spreads are starting to turn up.
Base case / conservative estimate is a flat 3-Month range.
NEXT WEEK: lean to Sell/Hedge on bounces and watch GAP BEHAVIOR.
SHORT-TERM SCENARIOS
Indexes are approaching conditions for a short-term bounce — ideally to fill Friday’s gaps down:
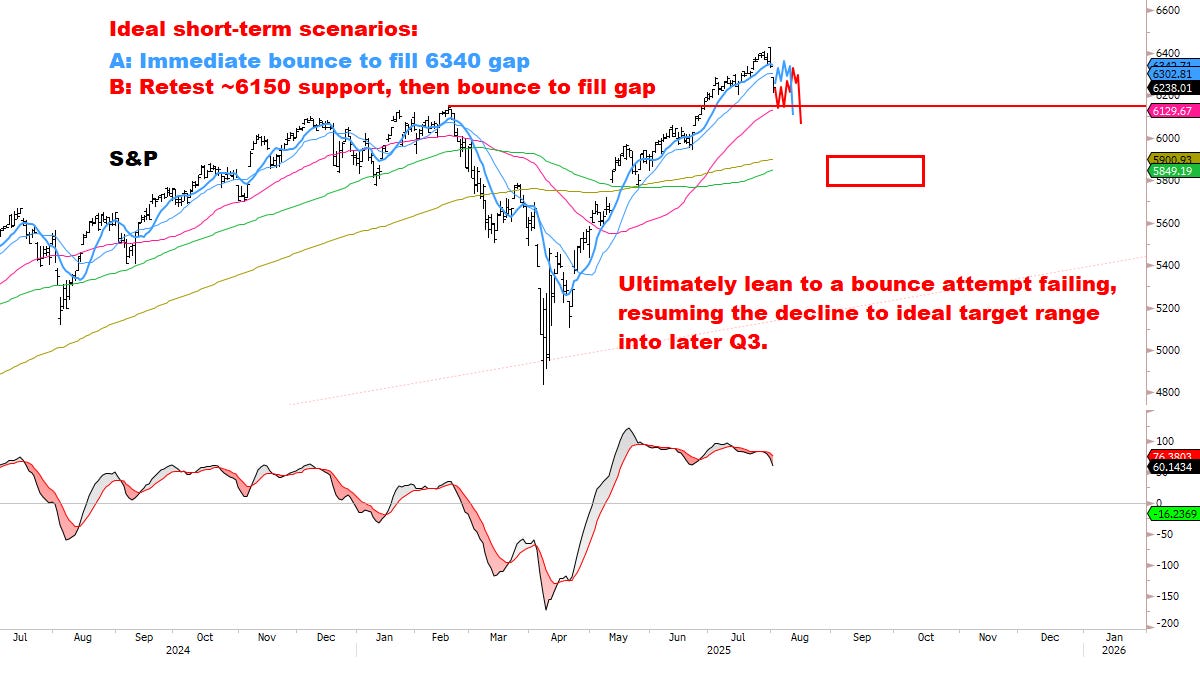
Testing trend support — setup for short-term bounce?
UPDATED STOCKS SCAN:
Through the end of June 2025, the average stock in our Core Watchlist was up +45%, with several names near/over 2x — a strong outperformance relative to the market.
As before, focused on: Stocks meeting strict criteria for (1) relative strength, (2) improving momentum, (3) defined risk. Building on this list as signals develop.
✅ “Have a plan and follow it” — remain selective and disciplined on Equity exposure.
✅ Portfolio Beta lowered significantly as discussed. Continue to avoid new Longs for now. No exposure to High Beta stocks, which look vulnerable to collapse (and were crushed on Friday).
✅ More than half of Core Watchlist stocks have likely peaked, or are on the cusp of rolling over.
✅ Continue to raise cash / operate in capital preservation mode, making incremental decisions.
Still working (could hold the market a bit longer):
ANET (pullback to 10dma, could still make a move to January gap), APP (barely blinked on Friday), AVGO (tiny pullback to 20dma again), CDNS (gave back a bit but still in full breakout territory), CEG (big recovery off the lows Friday and still glued to the breakout line), DASH (barely blinked on Friday), EBAY (big post-earnings gap up and held at the highs on Friday), GEV (barely blinked on Friday), GOOGL (small pullback for now may test 20dma), GS (small pullback), JBL (small pullback), JPM (small pullback, 50dma and February high are directly underneath), META (big post-earnings gap up and faded but still above all key MAs = will be a tough nut to crack), MPWR (big move up Friday from 50dma coil), MSFT (big post-earnings gap up and faded but still above all key MAs = will be a tough nut to crack), NRG (glued to the high), NVDA (small pullback and still holding well), ORCL (small pullback and still holding well), PLTR (small pullback and still holding well), SMCI (got the pop higher this week but faded and holding 10dma), VST (barely blinked on Friday)
Testing trend support:
AMZN (50dma, 200dma, and June breakout), AMAT (50dma, 200dma and June breakout), ARM (at 200dma), AXON (holding above 700 breakout and 20dma with a tiny drop Friday), BKNG (Dec 2024 high), COF (50dma and breakout retest), CRWD (approaching 100dma), CSCO (at 50dma and February high), DDOG (almost at 50dma though 200dma a bit lower), EXPE (tagged 50dma and 200dma with a bullish hammer on Friday), IBM (extremely oversold with hammer at 200dma), LRCX (50dma and Feb 2025 high with a strong rally Friday), MSTR (100dma), RGTI (almost at 50dma but rest of the group has been weaker), SHOP (almost testing 50dma), SPOT (trying to hold 100dma but seems vulnerable down to 200dma), TSLA (at 100dma but daily on Sell looks vulnerable)
Support broken:
ASML (200dma), FTNT (<200dma), IONQ (50dma, whole group looks similar), MU (downside to 100/200dma likely), UBER (<50dma looks vulnerable to retest of ~82), ZS (<50dma looks vulnerable to retest of ~260 breakout)
Rolling down:
AAPL, SE
Extremely overbought & reversed down:
AMD (holding trend but filled July 2024 gap and turned), COIN (v-shaped top and collapse), HOOD (vulnerable), RBLX (spiked to new ATH and turned immediately), SOFI (spiked to new ATH and turned immediately)
COMMODITY CASCADE
Commodities may be on the cusp of a cascade lower. Commodity books were blown out this week on Copper’s biggest one-day plunge in history. This was beyond all “modeled” downside risk — Thursday’s decline of -22% was TWICE the prior record of -11% (set in 2004). Until this week, Copper’s second-largest decline was during the October 2008 crash (-10.87%). Thursday blew every risk model to oblivion. And it will have huge implications for institutional risk appetite in the entire Commodity space.
RELATED: There’s a strong chance we’ll SOON reload Short WTI Crude Oil. If Sells trigger, think the theme taking hold could be a commodity cascade — with disinflation fears, China and EM getting hit sharply (a lot of money stuck in “China M2—Commodities up” trade). Short Oil could be a critical portfolio hedge/alpha generator in this scenario — maybe THE best out there (along with Bonds/Cash).
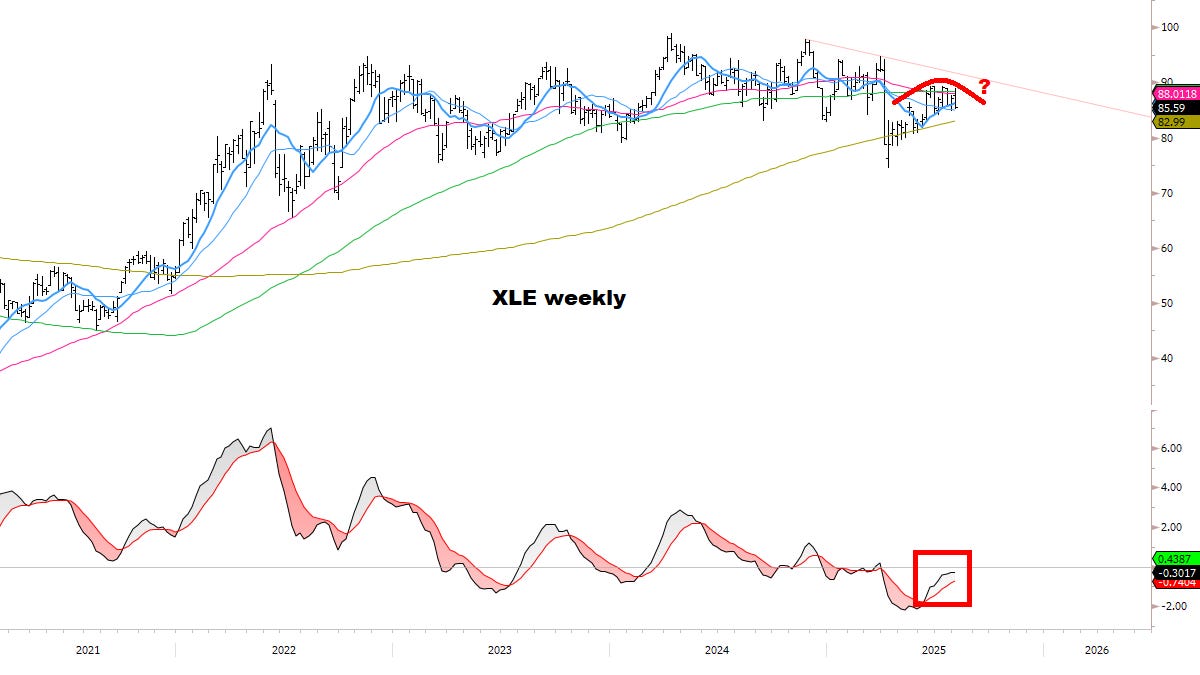
Monitoring:
CURRENCIES
Dollar buy signals confirmed this week.
✅ It looks like a classic Dollar rally starting, especially vs. EMFX (USDCNH, USDBRL, USDMXN, and others).
✅ Unfortunately the Dollar may remain choppy another 1-2 months against the Majors (DXY). Leaning lower on EURUSD and GBPUSD, but USDJPY and USDCHF are trading risk-off. These cross-currents reduce the chance of a full-power DXY rally here. Maybe it continues basing.
✅ Monitoring for pullback buys within an ongoing, potential multi-week/multi-month uptrend.
*Quick announcement: if Volatility continues to rise, we’ll be using Threads for brief updates. Important to check Notification Settings for preferred delivery method (Email/Push).
Good luck in August. Patience, process, and discipline…
Thanks for reading.
Onwards and upwards, -MC
*If you enjoyed this report, likes are much appreciated!