Prometheus - AlertManager
 Stopped
Prometheus
4. AlertManager
Let's recap: the Prometheus Server is in charge of scraping data from different services that expose their metrics. It pulls this information and stores it in a Time Series Database. At regular interval of time, it computes custom metrics, either to store the result or to create an alert. If an alert is raised it can be pushed to another daemon: the Alert Manager.
This daemon will take a list of instructions to follow when an alert is noticed by the Prometheus Server. The Alert Manager can send notifications to admins or to other clients via e-mail, Slack, WeChat, ... But sometimes, sending a notification for each failure in a large system might be a wrong idea because it will over-flood the receiver. Prometheus Alert Manager offers certain possibilities to deal with this.
- grouping: alerts can be grouped. When an alert is raised, the Alert Manager will wait for other alerts of the same type to be raised. At the end, it will send a notification for all the alerts. We can define how alerts are supposed to be grouped, and how long to wait for other alerts.
- inhibition: alerts can be inhibited. When an alert is raised, we decide that other alerts should not be dealt with: for example, if you have a lot of services that are using a database, and if this databases crashes, the Alert Manager will receive an alert for the database and then numerous for the APIs. To prevent the end user from receiving all notifications, we can tell the Alert Manager to inhibit these APIs notifications.
- silence: alerts can be silenced. They will not generate any notification for a certain period of time.
While grouping and inhibition have to be defined in a configuration file, silences are defined in the web interface of the Alert Manager.
The AlertManager is to be downloaded separately.
To install it, run the following commands :
wget https://github.com/prometheus/alertmanager/releases/download/v0.22.2/alertmanager-0.22.2.linux-amd64.tar.gz
tar -xvf alertmanager-0.22.2.linux-amd64.tar.gz
mv alertmanager-0.22.2.linux-amd64 alertmanager
We will define a simple config to deal with alerts. Open a
alert_manager.ymlfile:
nano alertmanager/alertmanager.yml
Copy/paste these lines:
global:
  smtp_from: 'test.prometheus.datascientest@gmail.com'
  smtp_smarthost: 'smtp.gmail.com:465'
  smtp_auth_username: 'test.prometheus.datascientest@gmail.com'
  smtp_auth_password: 'test_prometheus_datascientest'
  smtp_require_tls: true
First in global, we put several general information to connect to notification services. Here we are using SMTP to send e-mails.
This address is used solely for this course: we are giving you the credentials to it in order to make your lesson easier. *Please do not mess with this ! *
Then we are going to design a tree of routes which will contain the information on what to do if an alert is received by the Alert Manager:
route:
  group_by: ['alertname']
  group_wait: 30s
  group_interval: 5m
  repeat_interval: 3h
  receiver: 'default-receiver'
This part contains the default behavior to adopt: if a first alert is raised, we create a group according to its name. The system will then wait group_wait time to send a first notification to the receiver. Then a second notification will be sent after group_interval collecting all the alerts from this group and sending a message for all of them at once. Then the system will wait repeat_interval before sending notifications for this group.
Note that we can choose different ways to group alerts: by cluster if multiple Prometheus Server are linked to this Alert Manager, by alertname, by any labelname or if we do not want to group alerts, we can use ... : in this case, only alerts that are exactly the same will be grouped together.
Then we can add receivers:
receivers:
- name: 'default-receiver'
  email_configs:
    - to: 'test.prometheus.d4tascientest@gmail.com'
    - to: 'example@example.org' # change this if you want
- name: 'admin'
  email_configs:
  - to: 'test.prometheus.datascientest@gmail.com'
You can change the default-receiver e-mail address and put your own if you want to see what the Alert Manager is sending. We will not cover every type of notification system but the documentation is extensive on Prometheus website.
We can save and exit the file. As for the rule files, we have a tool to check our file:
alertmanager/amtool check-config alertmanager/alertmanager.yml
Now let's get back to our Prometheus Server and indicate in its configuration file where to find the Alert Manager.
nano prometheus/prometheus.yml
In the
alertingkey, we will change the address of the service. By default it runs on port9093.
alerting:
  alertmanagers:
  - static_configs:
    - targets: ['localhost:9093']
Note that we can have multiple Alert Managers working with the same Prometheus Server.
Once this is saved, you can launch Prometheus Server in a console and the Alert Manager in another console.
prometheus/prometheus --config.file=prometheus/prometheus.yml
alertmanager/alertmanager --config.file=alertmanager/alertmanager.yml
You can open the
9093port to see the AlertManager web interface.
Now let's use the interface to silence our second alert: open the New Silence menu: we will set alerts with alertname MySecondAlert to go silent for 2h. You can add comments and a author name to your silence if you work with other ones. Create it and come back to the consoles.
The menu should look like this :
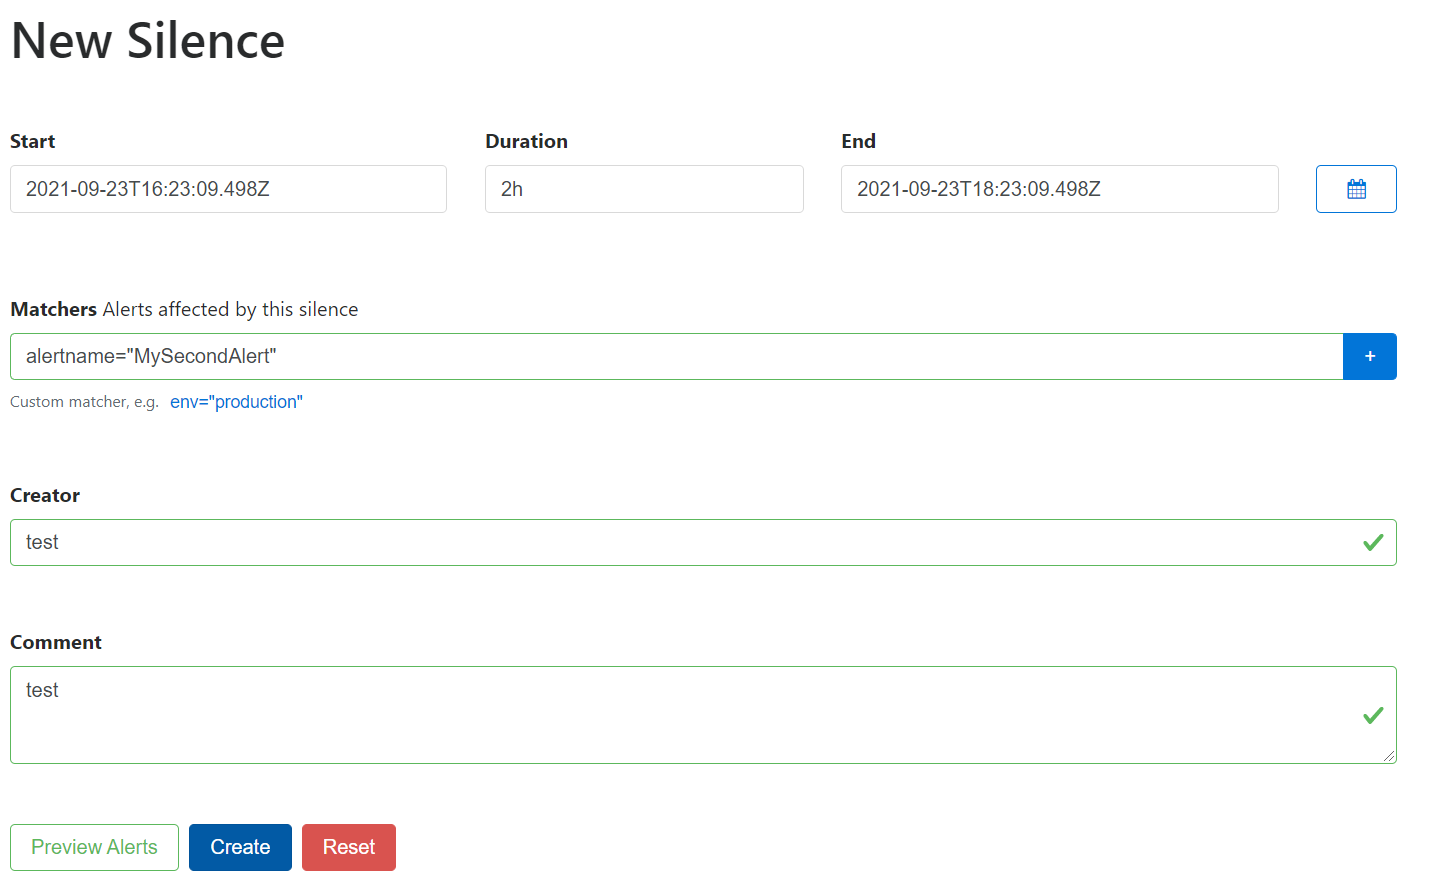
Don't forget to press the + button in blue to add the matcher before pressing the create button.
If it is down, relaunch the Python app (the Flask server contained in the app_metrics.py file) in another console and in another console, use the quick_client.py that we used to trigger our alerting rules. Remember that we have set the evaluation_interval to 15s. So the alert might be triggered 15s after our script is launched. Then you should see the alert in the Alert Manager web interface. After group_wait, you should receive an e-mail with a description of the alerts that were raised. And after group_interval, you should receive another e-mail containing information about all the alerts that were raised during this period of time. If you want to trigger this alert anew, you will need to wait repeat_interval before receiving a new notification.
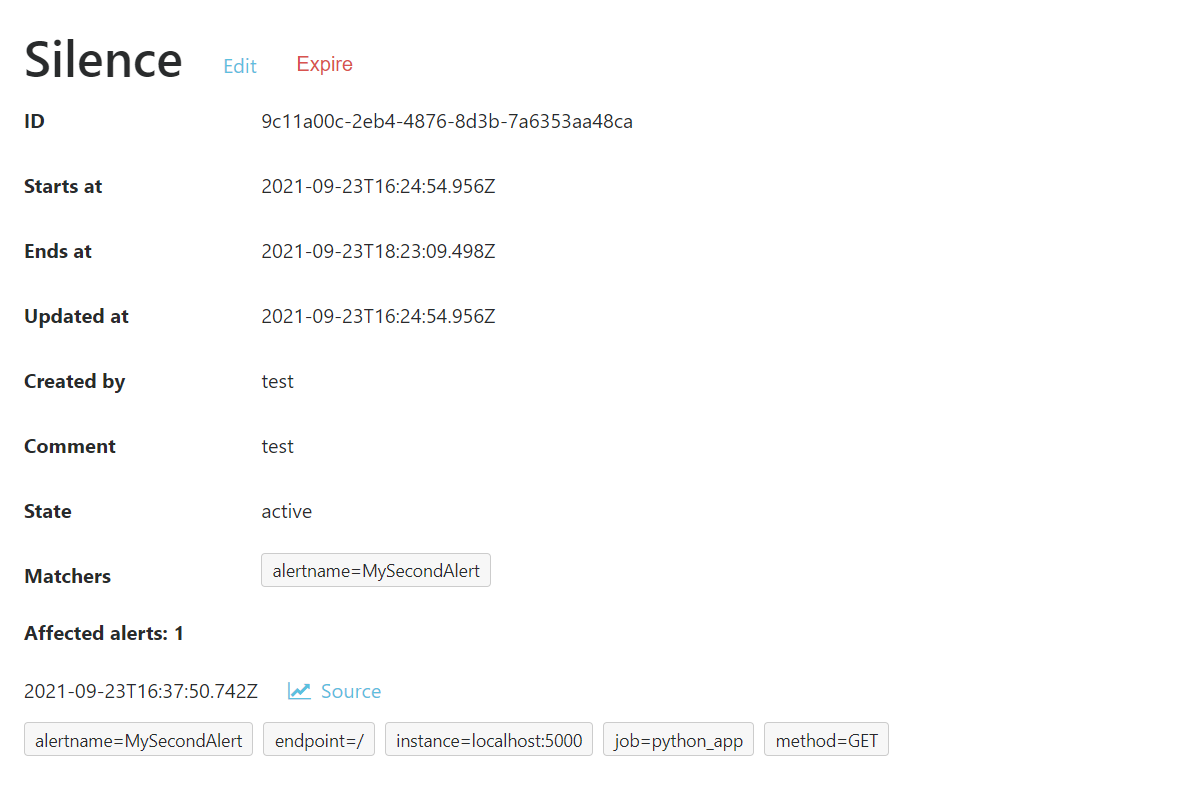
If you go in the Silences menu of the web interface, you should see your Silence and if you click on View you should see if alerts were caught by this Silence.
We should have a result that looks like this :
Now we will add a few more rules to check if our services are up. Open a new rule file:
nano prometheus/monitoring_rules.yml
And paste these lines:
groups:
  - name: monitoring_group
    rules:
      - alert: PythonAppDown
        expr: up{job="python_app"} == 0
        labels:
          severity: operation
        annotations:
          summary: 'Our Python App is down'
      - alert: MySQLDown
        expr: up{job="mysql_exporter"} == 0
        labels:
          severity: operation
        annotations:
          summary: 'Our MySQL Server is down'
      - alert: PrometheusDown
        expr: up{job="prometheus"} == 0
        labels:
          severity: operation
        annotations:
          summary: 'Our Prometheus Server is down'
      - alert: NodeDown
        expr: up{job="node"} == 0
        labels:
          severity: critical
        annotations:
          summary: 'The server is down'
Basically, we are checking if each of our device is up or down. We have added a description for those alerts and a label: if the machine is down, it's more important than other services. Moreover, if the machine is down, the other services will be down necessarily. So we do not need notifications for other alerts: we will use inhibition.
Once you have saved and exited this file, open the AlertManager configuration file:
nano alertmanager/alertmanager.yml
Under a new
inhibit_ruleskey, write the following lines:
inhibit_rules:
  - source_match:
      severity: critical
    target_match:
      severity: operation
Here, if an alert with a label severity set to critical is raised, then operation alerts will not be notified. Those match need to be exact. We can use regular expressions with source_match_re and target_match_re.
Save and exit the file.
We need to modify Prometheus configuration file to include our new rule:
nano prometheus/prometheus.yml
Just add the path to the new rule file:
rule_files:
  - "recording_rules.yml"
  - "alerting_rules.yml"
  - "monitoring_rules.yml"
Now we need to launch all of our exporters (if they are stopped) and relaunch our daemons:
# in 1st console
node_exporter/node_exporter
# in 2nd console
docker run -d -p 9104:9104 --network my-sql-network -e DATA_SOURCE_NAME="user:password@(hostname:3306)/" prom/mysqld-exporter
# in 3rd console
prometheus/prometheus --config.file=prometheus/prometheus.yml
# in 4th console
alertmanager/alertmanager --config.file=alertmanager/alertmanager.yml
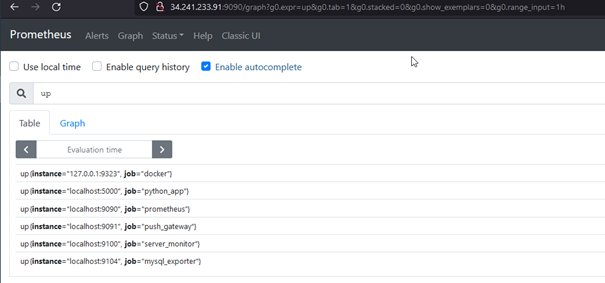
To check that everything is up, you can make the following query in Prometheus dashboard:
up
We should have this result :
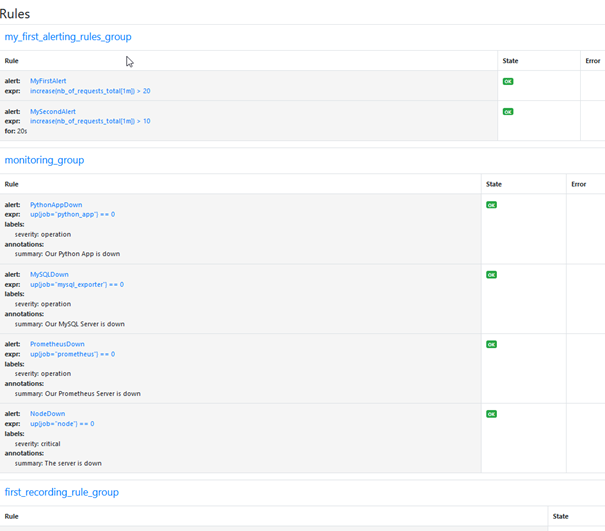
You can also check Status > Rules menu to see if your monitoring rules are indeed up.
You should see this menu :
Now we can shut down our Python app. Go to the corresponding console and type ctrl + c. Go to the alert manager and check that the alert is raised.
Now we are going to shut down in that order, the Node Exporter and the MySQL Exporter. If you go to the dashboard the alert for MySQL will appear, but if you check your e-mails, you should have received an e-mail for Python app being down and another for the Node Exporter and not for the MySQL Exporter: our inhibition rules came into play !
Notice that in our alert_manager.yml configuration file, all the alerts behave in the same way in regard to the route key. We can change this by using the routes key inside route and imply specific changes to alerts that will match or match_re certain conditions. The documentation is available here.
Templating is not really in the scope of the course but it can be a useful tool to enhance you notifications. Prometheus lets you customize you notifications through a templating system. In our case we do not have a lot of information but in some case, you may have a lot of information to display and you want a way to prioritize information.
