这是用户在 2025-7-7 19:51 为 https://www.mdpi.com/2304-6732/9/5/277 保存的双语快照页面,由 沉浸式翻译 提供双语支持。了解如何保存?


Review  开放访问评论

Review of a Specialty Fiber for Distributed Acoustic Sensing Technology
用于分布式声传感技术的特种光纤综述

by ,   作者 Yixiang Sun,
, 李浩
,
, 范存正
,
, 闫宝强
,
, 陈俊峰
and
, 闫志军
*
和 Qizhen Sun
National Engineering Laboratory for Next Generation Internet Access System (NGIA), Wuhan National Laboratory for Optoelectronics (WNLO), School of Optical and Electronic Information, Huazhong University of Science and Technology, Wuhan 430074, China
华中科技大学 光学与电子信息学院, 下一代互联网接入系统国家工程实验室 (NGIA), 武汉光电国家实验室 (WNLO), 中国 武汉 430074
*
Author to whom correspondence should be addressed.
通信应收件人的作者。
Photonics 2022, 9(5), 277; https://doi.org/10.3390/photonics9050277
光子学 2022, 9(5), 277;https://doi.org/10.3390/photonics9050277
Submission received: 29 January 2022 / Revised: 14 March 2022 / Accepted: 15 March 2022 / Published: 20 April 2022
收到意见:2022 年 1 月 29 日 / 修订日期:2022 年 3 月 14 日 / 接受日期:2022 年 3 月 15 日 / 发布时间:2022 年 4 月 20 日
(This article belongs to the Special Issue Novel Specialty Optical Fibers and Applications)
(本文属于特刊 新型特种光纤及应用)

Abstract  抽象

Specialty fibers have introduced new levels of flexibility and variability in distributed fiber sensing applications. In particular, distributed acoustic sensing (DAS) systems utilized] the unique functions of specialty fibers to achieve performance enhancements in various distributed sensing applications. This paper provides an overview of recent preparations and developments of specialty-fiber-based DAS systems and their sensing applications. The specialty-fiber-based DAS systems are categorized and reviewed based on the differences in scattering enhancement and methods of preparation. The prospects of using specialty fibers for DAS systems are also discussed.
特种光纤在分布式光纤传感应用中引入了新的灵活性和可变性。特别是,分布式声学传感 (DAS) 系统利用特种光纤的独特功能来增强各种分布式传感应用的性能。本文概述了基于特种光纤的 DAS 系统及其传感应用的最新制备和发展。基于特种纤维的 DAS 系统根据散射增强和制备方法的差异进行分类和审查。还讨论了将特种纤维用于 DAS 系统的前景。
Keywords:
specialty fibers; distributed acoustic sensing; DAS; distributed fiber sensor; scattering enhancement fiber
关键词:特种纤维;分布式声学传感;DAS;分布式光纤传感器;散射增强光纤

1. Introduction  1. 引言

The identification of the internal properties of a medium is an important way to understand nature and explore the world, which can be obtained using both direct and indirect measurements. Regarding acoustic waves, the transmission form of sound travels in different directions with the help of various media in the environment. Therefore, the internal properties of the medium can be recognized by measuring and tracking the information carried by the acoustic field [1,2,3]. In recent years, acoustic sensing technology has been widely used in the analysis of material properties at different scales, such as in geological structure detection [4], resource exploration [5], structural health monitoring [6], and perimeter security [7].
识别介质的内部特性是了解自然和探索世界的重要方式,这可以通过直接和间接测量来获得。关于声波,声音的传输形式在环境中各种介质的帮助下向不同的方向传播。因此,可以通过测量和跟踪声场携带的信息来识别介质的内部特性 [ 1, 2, 3]。近年来,声学传感技术已广泛应用于不同尺度的材料性能分析,如地质结构检测 [ 4]、资源勘探 [ 5]、结构健康监测 [ 6] 和周界安全 [ 7]。
Acoustic sensors allow people to analyze media through acoustic information. With the increases in the range and scale of acoustic detection, the demand for distributed high-capacity acoustic sensors is also expanding. Furthermore, distributed acoustic sensing (DAS) has become a research hotspot because of its advantages in terms of anti-electromagnetic interference, high sensitivity [8], and the small volume and light weight of the systems. DAS is a rising acoustic sensing technology that uses passive optical fibers as the transmission and sensing medium at the same time, squeezing information from optical fiber Rayleigh backscatters to achieve acoustic detection in the surrounding environment. Most DAS systems are based on phase-sensitive optical time domain reflectometry (φ-OTDR), since the phase change in Rayleigh backscattered light has a linear relationship with the acoustic wave acting on the optical fiber [9].
声学传感器允许人们通过声学信息分析媒体。随着声学检测范围和规模的增加,对分布式大容量声学传感器的需求也在不断扩大。此外,分布式声学传感 (DAS) 因其在抗电磁干扰、高灵敏度 [ 8] 以及系统体积小、重量轻等优点而成为研究热点。DAS 是一种新兴的声学传感技术,它同时使用无源光纤作为传输和传感介质,从光纤 Rayleigh 反向散射中挤压信息,以实现对周围环境的声学检测。大多数 DAS 系统都基于相位敏感光时域反射计 (φ-OTDR),因为瑞利背向散射光的相位变化与作用在光纤上的声波呈线性关系 [ 9]。
Common DAS systems usually use a single-mode fiber (SMF) as the sensing fiber. However, with such fibers the Rayleigh backscattered light is extremely weak and the signal-to-noise ratio (SNR) of the optical sensing signal is low, which leads to a poor SNR of the demodulation phase signal in DAS systems based on φ-OTDR [10]. In addition, since a laser pulse with a narrow linewidth and high coherence is injected into the fiber, the interference between the Rayleigh scattering points in one pulse will produce interference cancellation, resulting in coherent fading of the backscattered light, forming a “dead zone” on the sensing fiber [11]. In recent years, in order to solve the defects of the poor SNR values and the sensitivity of phase demodulation in SMF-DAS systems, many suppression technologies for noise have been studied, such as coherent fading, while at the same time the complexity and cost of the systems has increased, leading to sacrifices in terms of the response frequency band and sensing distance [12,13,14,15,16,17,18]. Furthermore, it is also important to enhance the performance of the sensing fiber itself. The development of a specialty fiber for DAS technology will have broad prospects.
常见的 DAS 系统通常使用单模光纤 (SMF) 作为传感光纤。然而,使用这种光纤时,瑞利背向散射光非常弱,并且光传感信号的信噪比 (SNR) 很低,这导致在基于 φ-OTDR 的 DAS 系统中解调相位信号的 SNR 较差 [ 10]。此外,由于将线宽窄、相干性高的激光脉冲注入光纤中,一个脉冲中瑞利散射点之间的干涉会产生干涉抵消,导致背向散射光的相干衰落,在传感光纤上形成“死区” [ 11]。近年来,为了解决 SMF-DAS 系统中 SNR 值差和相位解调灵敏度高的缺陷,人们研究了许多噪声抑制技术,例如相干衰落,同时系统的复杂性和成本增加,导致响应频段和感应距离方面的牺牲 [ 12, 13, 14, 15, 16, 17, 18].此外,提高传感光纤本身的性能也很重要。用于 DAS 技术的特种纤维的开发将具有广阔的前景。
This paper intends to provide a comprehensive review of the different sensing features and performance enhancements provided by the specialty fibers that are used in DAS systems. The principle of the DAS technology is introduced in Section 2, followed by a discussion of the specialty-fiber-based DAS system with enhanced sensing capability and performance in Section 3. Firstly, two types of specialty fibers are introduced, a continuous scattering-enhanced (CSE) fiber and discrete scattering-enhanced (DSE) fiber, with the latter one being more widely used because of its ability to completely suppress coherent fading. Secondly, several fabrication techniques for introducing scattering enhancement points (SEP) into the fiber are summarized, including femtosecond writing and UWFBG inscription. Thirdly, a variety of methods to enhance the performance of DAS systems for discrete scattering are reviewed. Fourthly, the applications of the specialty fiber DAS system are reviewed in Section 4. Lastly, the prospects of using specialty fibers for DAS systems are discussed in Section 5.
本文旨在全面回顾 DAS 系统中使用的特种光纤提供的不同传感特性和性能增强。第 2 节介绍了 DAS 技术的原理,随后在第 3 节中讨论了具有增强传感能力和性能的基于特种光纤的 DAS 系统。首先,介绍了两种类型的特种光纤,连续散射增强 (CSE) 光纤和离散散射增强 (DSE) 光纤,后者因其能够完全抑制相干衰落而得到更广泛的应用。其次,总结了几种在光纤中引入散射增强点 (SEP) 的制备技术,包括飞秒写入和 UWFBG 铭文。其次,综述了提高 DAS 系统离散散射性能的多种方法。第四,第 4 节回顾了特种纤维 DAS 系统的应用。最后,第 5 节讨论了将特种纤维用于 DAS 系统的前景。

2. Fundamental Principle
2. 基本原则

2.1. Principle of DAS Technology
2.1. 戴思 DAS 技术的原理

DAS is achieved by measuring the optical phase change caused by the axial strain variation of the optical fiber [19]. When the sound wave acts on the fiber, the fiber will produce axial strain, which changes the phase of the Rayleigh backscattering signal in the fiber. According to the photoelastic effect, there is a linear relationship between the axial strain and the optical phase change:
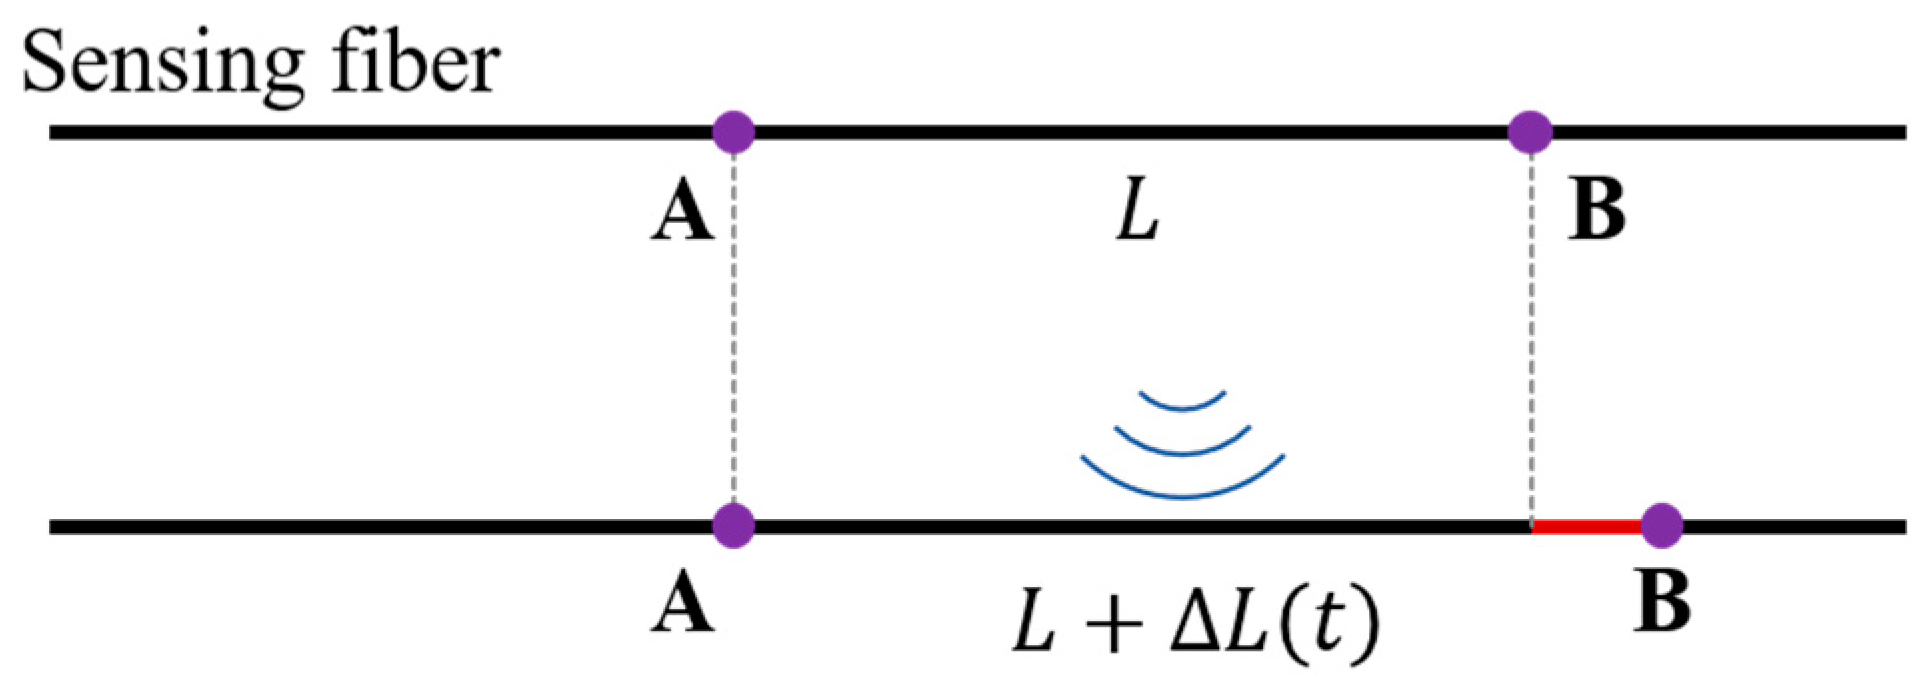
DAS 是通过测量由光纤的轴向应变变化引起的光学相位变化来实现的 [ 19]。当声波作用在光纤上时,光纤会产生轴向应变,从而改变光纤中瑞利背散射信号的相位。根据光弹性效应,轴向应变与光学相位变化呈线性关系:
φ=β[1n22(P12+2P11)]L
where β is the propagation constant of light, n is the refractive index of the optical fiber, P12 and  P11 are tensor coefficients of the optical fiber, ∆L is the change in fiber length from equation L=εsL, εs is the axial strain of the fiber, and L is the length of the fiber. Thus, as shown in Figure 1, as long as the changes in the phase difference between the two points A and B of the probe light can be extracted, the changes in axial strain can be known and the quantitative perception of acoustic waves or vibrations can finally be measured. It is crucial for DAS to achieve distortion-free phase demodulation in all positions of the fiber.
其中 β 是光的传播常数, n 是光纤的折射率, P 12   P 11 是光纤的张量系数,∆L 是纤维长度与方程的变化 L = ε s L ε s 是光纤的轴向应变, L 是光纤的长度。因此,如图 1 所示,只要能提取出探针光两点 A 和 B 之间的相位差变化,就可以知道轴向应变的变化,最终可以测量到声波或振动的定量感知。对于 DAS 来说,在光纤的所有位置实现无失真的相位解调至关重要。
Figure 1. The sensing principle of the fiberoptic DAS.
图 1.光纤 DAS 的传感原理。
Since Rayleigh scattering is an elastic scattering method without any nonlinear effect, and as the Rayleigh scattered light at different positions can be distinguished via the time of reflection back to the fiber launch end, the optical fiber phase extraction technique based on phase-sensitive optical time domain reflection (φ-OTDR) is widely used in DAS systems [20,21]. In 2011, using heterodyne coherent detection technology, the phase of the Rayleigh scattering signal was successfully demodulated for the first time [22]. The scheme of the heterodyne coherent detection is shown in Figure 2. The local oscillator light and the Rayleigh scattering signal at point A can be expressed as:
由于瑞利散射是一种没有任何非线性效应的弹性散射方法,并且由于可以通过反射回光纤发射端的时间来区分不同位置的瑞利散射光,因此基于相位敏感光时域反射 (φ-OTDR) 的光纤相位提取技术在 DAS 系统中得到了广泛应用 [ 20, 2011 年,利用外差相干检测技术,首次成功解调了瑞利散射信号的相位 [ 22]。外差相干检测的方案如图 2 所示。本振光和点 A 处的瑞利散射信号可以表示为:
ELO=ALOexp[j2πft+jφLO]
EA=AAexp[j2π(f+f)t+jφA]
where ALO and AA are the amplitude of the local oscillator light and the Rayleigh scattering signal at point A, f is the frequency of the probe light, f is the frequency shift of the pulse modulator, φLO and φA are the optical phases of the local oscillator light and the Rayleigh scattering signal at point A, respectively. After these two signals are coupled by a 3 dB coupler and interfere with the photosensitive surface of the balanced photoelectric detector (BPD), the light intensity detected by the BPD can be expressed as:
其中 是本振光的振幅和瑞利散射信号在点 A, 是探测光的频率, 是脉冲调制器的频移, 分别 是本振光和瑞利散射信号在点 A 的光相位。当这两个信号被 3 dB 耦合器耦合并干扰平衡光电检测器 (BPD) 的感光面后,BPD 检测到的光强度可以表示为:
I2ELOEAcos(ft+φA)
where φA=φAφLO is the phase difference between the two signals. Then, φA can be calculated using a digital coherent IQ demodulation algorithm. Similarly, φB can also be calculated at point B by the same algorithm. Through the spatial differential calculation of the phase, the phase difference φAB between two points A and B can be finally obtained, which linearly shows the axial strain of the optical fiber and finally allows the quantitative perception of sound waves and vibrations.
其中 是两个信号之间的相位差。然后, 可以使用数字相干 IQ 解调算法进行计算。同样, 也可以使用相同的算法在 B 点计算。通过相位的空间差分计算,最终可以得到两点 A 和 B 之间的相位差 ,线性地显示光纤的轴向应变,最终允许对声波和振动进行定量感知。
Figure 2. Typical heterodyne coherent detection scheme [22].
图 2.典型的外差相干检测方案 [ 22]。
In addition to the heterodyne-based coherent detection scheme, researchers have also proposed other phase demodulation schemes, such as the 3 × 3 coupler scheme [23], phase-generated carrier (PGC) [24], and linear frequency sweeping pulse method [25]. Some representative schemes are shown in Figure 3, all of which can achieve distributed optical phase demodulation.
除了基于外差的相干检测方案外,研究人员还提出了其他相位解调方案,例如 3 × 3 耦合器方案 [ 23]、相位产生载波 (PGC) [ 24] 和线性频率扫描脉冲方法 [ 25]。一些代表性方案如图 3 所示,所有这些方案都可以实现分布式光相位解调。
Figure 3. Rayleigh scattering model of the single-mode optical fiber [26].
图 3.单模光纤的瑞利散射模型 [ 26]。

2.2. Limitations of Single-Mode Fiber (SMF) DAS
2.2. 单模光纤 (SMF) DAS 的局限性

Despite SMF DAS technology having been applied in many fields, such as geological monitoring, pipeline monitoring, and oil exploration, and with the advantages of distributed detection, high spatial resolution, and high sensitivity, it still has been limited by interference fading and poor signal consistency. The reasons are analyzed below.
尽管 SMF DAS 技术已应用于地质监测、管道监测、石油勘探等多个领域,并具有分布式探测、高空间分辨率、高灵敏度等优点,但仍受到干扰衰落和信号一致性差的限制。原因分析如下。
In particular, when the pulse width is narrow enough, the Rayleigh backscattering signals of point A and B as discussed in Section 2.1 can be obtained according to the arrival time of the Rayleigh backscattering light. In fact, the probe pulse has a certain pulse width, and the Rayleigh scattering signals of different scattering points in the pulse width will interfere with each other because of the high coherence of the probe light. The interference result of the Rayleigh scattering can only represent a section fiber near point A and B. Due to the inhomogeneous doping in the preparation of the optical fiber, the interference phenomenon of the Rayleigh scattering is random, which will inevitably affect the phase demodulation performance. In order to describe the Rayleigh scattering phenomenon in SMF accurately, researchers established a SMF scattering model [26].
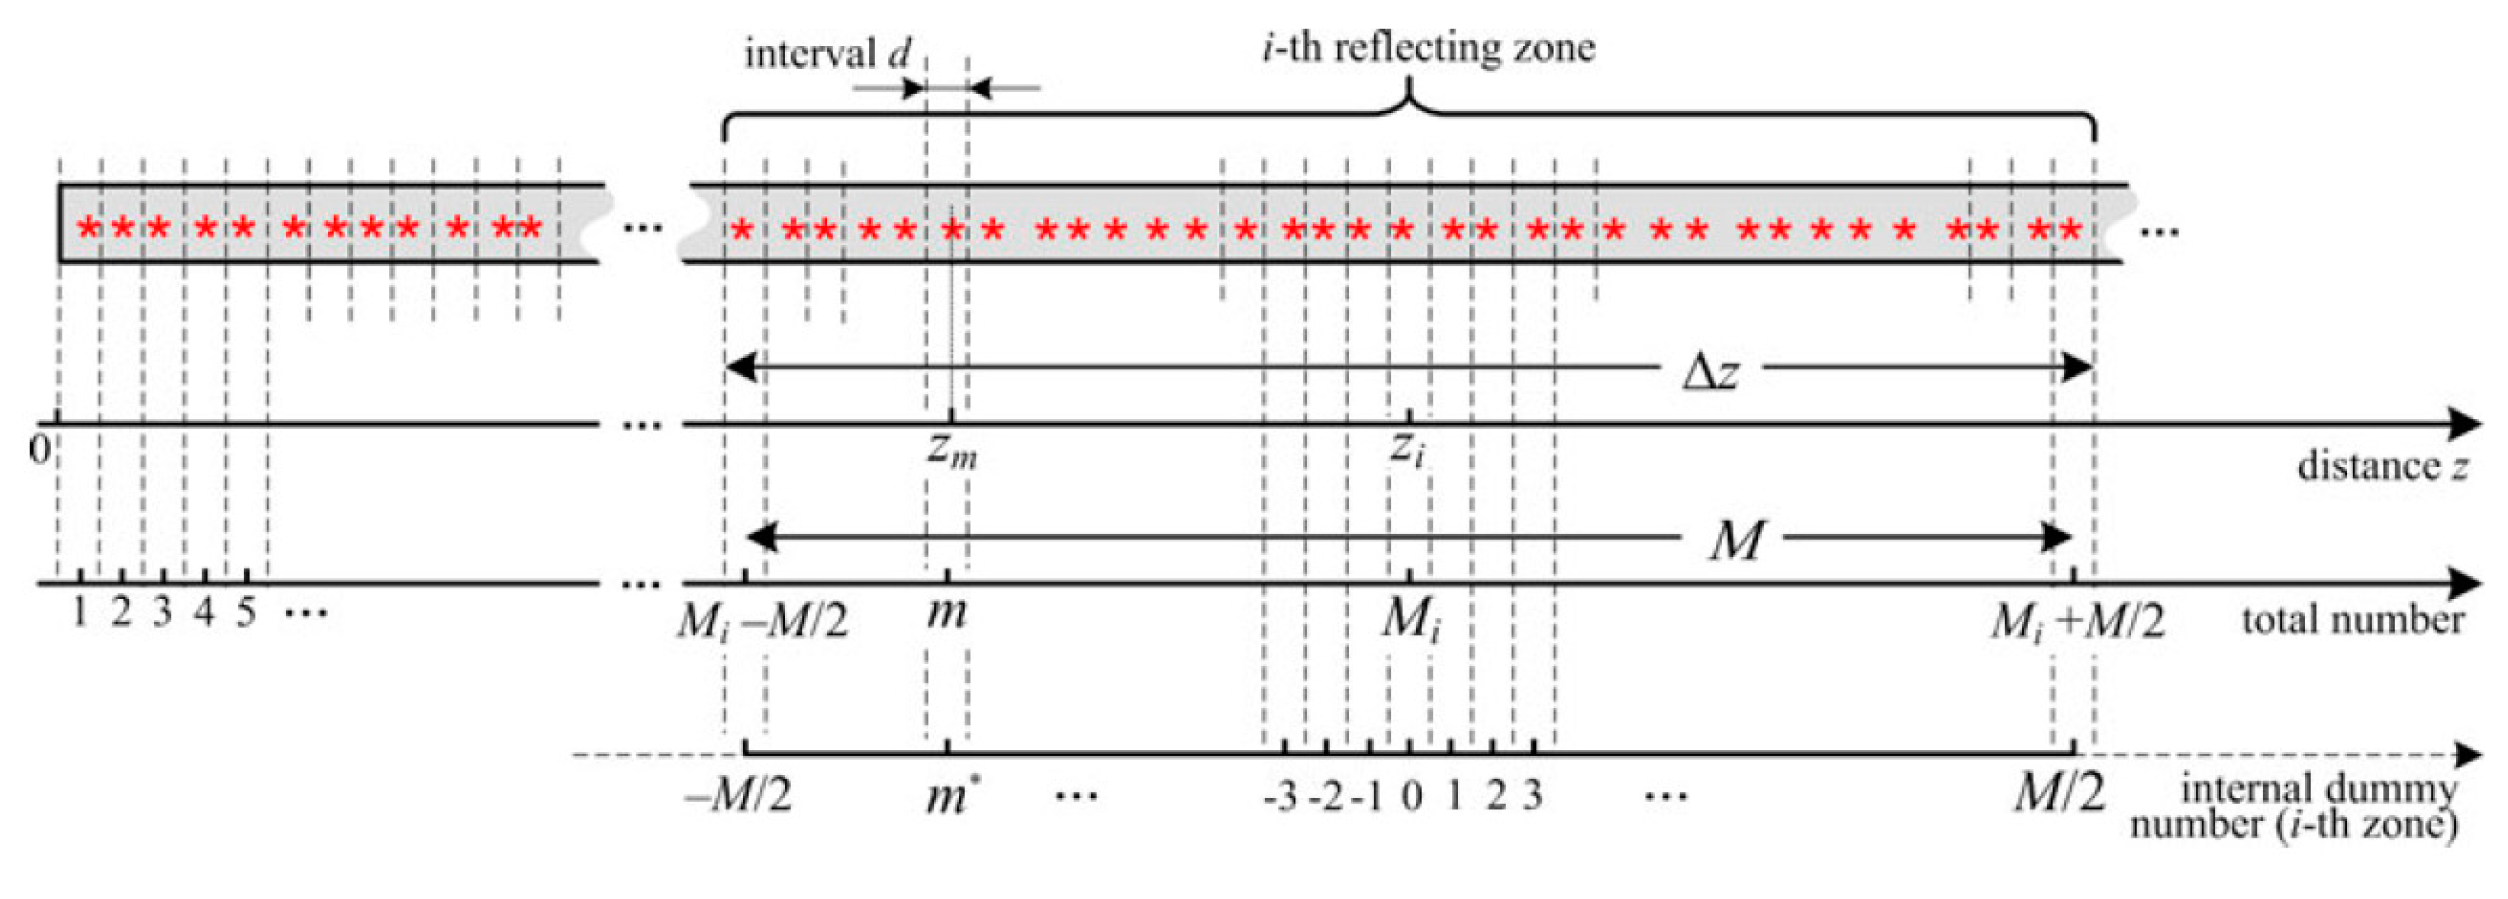
特别是,当脉冲宽度足够窄时,可以根据瑞利背向散射光的到达时间获得第 2.1 节中讨论的点 A 和 B 点的瑞利反向散射信号。其实探测脉冲具有一定的脉冲宽度,由于探测光的高相干性,脉冲宽度中不同散射点的瑞利散射信号会相互干扰。瑞利散射的干涉结果只能代表靠近 A 点和 B 点的一段光纤。由于光纤制备过程中的掺杂不均匀,瑞利散射的干涉现象是随机的,必然会影响相位解调性能。为了准确描述 SMF 中的瑞利散射现象,研究人员建立了 SMF 散射模型 [ 26]。
The Rayleigh scattering model is shown in Figure 4. First, the SMF is discretized and the nonuniform distribution of impurities in the core is regarded as a series of equivalent Rayleigh scattering points (ERSP) of micron or submicron size, which are numbered as 1, 2, 3, , M, respectively. Each backscattering coefficient and the position of the scattering point can be presented as (am,zm); that is, the M-th scattering point is on  zm, while the reflectivity is am. Since the ERSP can be regarded as the superposition of multiple scattering points with a smaller scale, its position can be expressed as zm=md+d, where ∆d obeys the uniform distribution in [d2,d2] and am obeys the Rayleigh distribution. According to the above analysis, the Rayleigh scattering signal received at the i-th time can be expressed as the superposition of interference of the Rayleigh scattering signal of a section of fiber:
Ei=zi1<zm<zi2 Aam·exp(j2πλ·2nzm)
where n is the refractive index of the fiber, zi1 and zi2 are related to the pulse width, which satisfies zi2zi1=Wc/2n, W is the pulse width of the probe pulse, and c is the speed of light in vacuum. Researchers have also verified this model [8]; when the interference signal involves interference cancellation, the signal intensity |Ei| will become weaker, leading to a worse optical SNR. Further, the light intensity declines to the same level as the acquisition noise and the demodulated phase information will be submerged in the noise, forming a blind detection area, which is called interference fading. In addition, due to the randomness of the reflectivity am of the equivalent scattering point, the equivalent positions of the signals received at different times are different. The signal received at time i in Equation (5) is taken as an example. Since the scattered signal at this time is the superposition of multiple complex numbers, its intensity Aam is the mode of the complex number, and the phase j2πλ2nzm related to position zm is the argument for the complex number, so Equation (5) can be expressed as the superposition of multiple vectors. As depicted in Figure 4, when the Rayleigh scattering intensity of the front-end equivalent scattering point is strong, the signal received at time i can be regarded as Rayleigh scattering near the zi1 position, while when the Rayleigh scattering intensity of the back-end equivalent scattering point is strong, the signal received at the same time can be regarded as Rayleigh scattering near the zi2 position.
瑞利散射模型如 所示。首先,将 SMF 离散化,将磁芯中杂质的不均匀分布视为一系列微米或亚微米大小的等效瑞利散射点 (ERSP),它们分别编号为 1、2、3、 、M。每个反向散射系数和散射点的位置可以表示为 (am,zm) ;也就是说,第 M 个散射点为 ,  zm 而反射率为 am 。由于 ERSP 可以看作是多个尺度较小的散射点的叠加,因此其位置可以表示为 zm=md+d ,其中 ∆服从均匀分布 [d2,d2]am 服从瑞利分布。根据上述分析,在第 -次接收到的瑞利散射信号可以表示为一段光纤的瑞利散射信号的干涉叠加:其中 n 是光纤的折射率, zi1 z 与脉冲宽度有关,满足 zi2zi1=Wc/2nW 是探测脉冲的脉冲宽度, 和 c 是真空中的光速。研究人员也验证了这个模型 [];当干扰信号涉及干扰消除时,信号强度 |Ei| 会变弱,导致光信噪比变差。此外,光强度下降到与采集噪声相同的水平,解调的相位信息将被淹没在噪声中,形成一个盲区检测区域,称为干扰衰落。此外,由于等效散射点反射率 am 的随机性,在不同时间接收到的信号的等效位置也不同。 以公式 (5) 中 time 接收到的信号为例。由于此时的散射信号是多个复数的叠加,它的强度 Aam 是复数的模式,而与位置 zm 相关的相位 j2πλ2nzm 是复数的参数,所以方程(5)可以表示为多个向量的叠加。如图所示,当前端等效散射点的瑞利散射强度较强时,此时接收到的信号可视为该 zi1 位置附近的瑞利散射,而当后端等效散射点的瑞利散射强度较强时,同时接收到的信号可视为该 zi2 位置附近的瑞利散射。
Figure 4. Schematic diagram of equivalent scattering positions in pulse interference.
图 4.脉冲干扰中等效散射位置的示意图。
In general, it is the randomness of the intensity and position of Rayleigh scattering of ordinary single-mode fibers that leads to the problems of interference fading and poor signal time consistency in DAS, making it difficult to perform high-fidelity sound wave tracking when analyzing the internal properties of the medium.
一般来说,正是普通单模光纤瑞利散射强度和位置的随机性导致了 DAS 中存在干扰衰落和信号时间一致性差的问题,使得在分析介质的内部性质时难以进行高保真声波跟踪。

3. Reviews of Specialty-Fiber-Based DAS Technology
3. 基于特种纤维的 DAS 技术综述

In order to solve the interference fading and poor consistency in SMF DAS, researchers have conducted a series of studies [13,27,28,29,30]. Among them, the most effective method is to improve the fibers to enhance the fiber backscattering, such as continuous scattering-enhanced fibers and discrete scattering-enhanced fibers formed by inscribing microstructures into the fibers. In addition, due to the characteristics of microstructure optical fibers, researchers also designed and improved the matching optical scheme to improve the performance of the DAS system. In this section, a comprehensive review of the specialty-fiber-based DAS with enhanced sensing capability and performance is presented.
为了解决 SMF DAS 中的干扰衰落和一致性差的问题,研究人员进行了一系列研究 [ 13, 27, 28, 29, 30]。其中,最有效的方法是改进纤维以增强纤维背散射,例如通过在纤维中刻入微结构而形成的连续散射增强纤维和离散散射增强纤维。此外,由于微结构光纤的特点,研究人员还设计并改进了匹配的光学方案,以提高 DAS 系统的性能。在本节中,全面回顾了具有增强传感能力和性能的基于特种光纤的 DAS。

3.1. Continuous Scattering-Enhanced Fiber-Based DAS
3.1. 基于连续散射增强光纤的 DAS

Continuous scattering enhancement (CSE) allows the suppression of coherent fading by enhancing the Rayleigh scattering of the whole fiber, whose essence is to enhance the scattering intensity am of the ERSP model described in Section 2.2 by doping or writing continuous grating in the fiber, so as to enhance the light intensity after interference superposition, finally allowing the suppression of interference fading.
连续散射增强 (CSE) 允许通过增强整个光纤的瑞利散射来抑制相干衰落,其本质是通过在光纤中掺杂或写入连续光栅来增强第 2.2 节中描述的 ERSP 模型的散射强度 am ,从而增强干涉叠加后的光强度,最终允许抑制干涉衰落。
In 2017, the OFS laboratory in the United States used the phase mask method to efficiently and continuously inscribe Bragg gratings in multicore fibers through ultraviolet (UV) exposure. The backscattering intensity of the fiber was increased by 14 dB, and the reflection spectrum is shown in Figure 5a. Then, in cooperation with Fotech in the UK, CSE fiber was used in a DAS system, and the SNR of 1 km of CSE fiber was increased by 15 dB [31,32,33,34]. Although this method effectively improves the SNR, the bandwidth of the Bragg grating reflection spectrum is narrow, and the reflection wavelength will drift with temperature and stress variation. When the external environment changes, the wavelength of the incident light and grating reflection may not correspond to each other, resulting in the loss of the scattering enhancement effect. Therefore, the application range of this kind of fiber is limited and cannot be used in fields where high temperature and high pressure are required on site. In addition to inscribing continuous gratings, changing the fiber doping is another way to increase the intensity of the Rayleigh scattering. In 2018, Butov et al. used nitrogen-doped fiber as the sensing fiber, which increased the SNR of the acoustic wave detection by 3 dB [35]. In the same year, Feng S et al. used an erbium-doped optical fiber for distributed optical fiber sensing, adopted a phase-generated carrier (PGC) optical scheme, which converts homodyne interference into heterodyne interference by modulating the frequency of the signal, decreased the phase noise by 14 dB, and achieved a high-SNR acoustic measurement on 1.9 km optical fiber [36].
2017 年,美国 OFS 实验室使用相位掩模方法,通过紫外线 (UV) 照射在多芯光纤中高效、连续地刻划布拉格光栅。光纤的背向散射强度增加了 14 dB,反射光谱如图 5a 所示。然后,与英国 Fotech 合作,在 DAS 系统中使用 CSE 光纤,1 km CSE 光纤的 SNR 提高了 15 dB [ 31, 32, 33, 34]。虽然该方法有效提高了信噪比,但布拉格光栅反射光谱的带宽较窄,反射波长会随着温度和应力的变化而漂移。当外部环境发生变化时,入射光和光栅反射的波长可能彼此不对应,从而导致散射增强效果的损失。因此,这种纤维的应用范围有限,不能用于现场需要高温高压的领域。除了刻划连续光栅外,改变光纤掺杂是增加瑞利散射强度的另一种方法。2018 年,Butov 等人使用氮掺杂光纤作为传感光纤,使声波检测的 SNR 提高了 3 dB [ 35]。同年,Feng S 等人使用掺铒光纤进行分布式光纤传感,采用了相位产生载波 (PGC) 光学方案,通过调制信号频率将零差干扰转换为外差干扰,将相位噪声降低了 14 dB,并在 1.9 km 光纤上实现了高信噪比声学测量 [ 36]。
Figure 5. Typical scheme of continuous scattering-enhanced optical fiber [33,36]: (a) the backscattering signal distribution of a typical continuous scattering-enhanced fiber; (b) scheme of improved Rayleigh scattering achieved by changing the fiber doping; (c) scattering spectrum of high Rayleigh scattering fiber.
图 5.连续散射增强光纤的典型方案 [ 33, 36]: (a) 典型连续散射增强光纤的背向散射信号分布;(b) 通过改变纤维掺杂实现的改进瑞利散射方案;(c) 高瑞利散射光纤的散射光谱。
For the CSE scheme, although it can effectively improve the scattering intensity and suppress the coherent fading noise, the enhanced fiber scattering results in doubling of the light loss, which greatly limits the detection distance. Taking the optical fiber doping scheme as an example, if the front-end SNR is increased by 10 dB, the Rayleigh scattering of the fiber needs to be increased by ten times, which reduces the detectable distance to 1/10. More importantly, the SCE fiber does not fundamentally change the nature of the optical interference in the pulse, and still cannot completely eliminate the coherent fading phenomenon.
对于 CSE 方案,虽然可以有效提高散射强度并抑制相干衰落噪声,但增强的光纤散射导致光损失加倍,极大地限制了探测距离。以光纤掺杂方案为例,如果前端信噪比提高 10 dB,则光纤的瑞利散射需要增加 10 倍,从而将可检测距离减少到 1/10。更重要的是,SCE 光纤并没有从根本上改变脉冲中光干涉的性质,仍然无法完全消除相干衰落现象。

3.2. Discrete Scattering-Enhanced Fiber Based DAS
3.2. 基于离散散射增强光纤的 DAS

In addition to continuous scattering enhancement, more researchers are focusing on the application of discrete scattering-enhanced (DSE) fiber in DAS. As shown in Figure 6, the essence of this fiber is to enhance the scattering intensity of one single ERSP with a certain interval in the model illustrated in Section 2.2. The intensity of the scattering-enhanced points (SEP) is far greater than that of the ordinary ERSP. In this way, the Rayleigh scattering interference light containing the SEP can be expressed as:
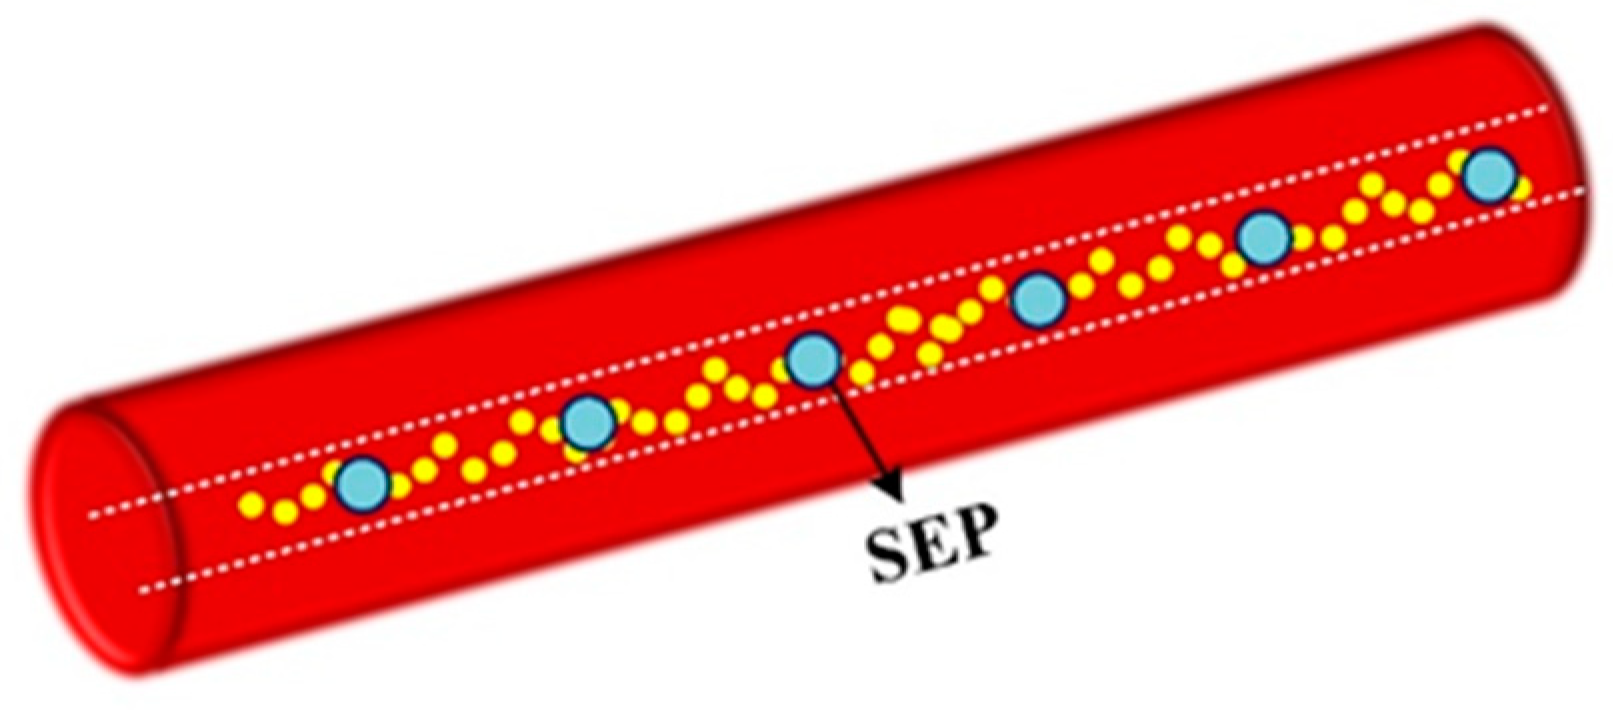
除了连续散射增强外,越来越多的研究人员正在关注离散散射增强 (DSE) 光纤在 DAS 中的应用。如图 6 所示,这种光纤的本质是在第 2.2 节所示的模型中以一定的间隔提高单个 ERSP 的散射强度。散射增强点 (SEP) 的强度远大于普通 ERSP 的强度。这样,包含 SEP 的瑞利散射干涉光可以表示为:
Ei=zi1<zm<zi2,zmzj am·exp(j2πλ·2nzm)+aj·exp(j2πλ·2nzj)
where the j-th ERSP is the scattering enhancement point. Because the scattering intensity of the SEP is much larger than that of the ordinary ERSP, the first term of the above formula can be ignored, which shows that the Rayleigh scattering signal is only determined by the SEP. Through the phase demodulation method in Section 2.1, the phase difference between the two SEP can be accurately obtained, and because of its high scattering intensity and high SNR, the interference fading can be completely eliminated, ensuring the good consistency of the signal.
其中 -th ERSP 是散射增强点。由于 SEP 的散射强度远大于普通 ERSP,因此可以忽略上述公式的第一项,由此可见瑞利散射信号仅由 SEP 决定。通过 2.1 节中的相位解调方法,可以准确获得两个 SEP 之间的相位差,并且由于其高散射强度和高 SNR,可以完全消除干扰衰落,保证了信号的良好一致性。
Figure 6. Schematic diagram of discrete scattering-enhanced fiber.
图 6.离散散射增强光纤的示意图。
To verify its effectiveness, we have theoretically analyzed the DSE model and the SMF scattering model. According to the parameters shown in Table 1, three SEPs are set at 3, 7, and 11 m on the fiber at intervals of 4 m. Figure 7a,b shows the distribution results of the scattering intensity obtained from the simulation. It can be seen that the DES fiber completely suppresses the random variation of the signal amplitude and interference fading. To further explore the suppression effect of the DSE fiber on the phase noise, we solve the phase differences between 3 and 7 m on the SMF and DSE fibers, respectively, the of which results are shown in Figure 7c. Compared with SMF, the DSE fiber is not affected by the random distribution of ordinary ERSPs, but is determined by the position of the SEPs, so the phase noise is greatly suppressed.
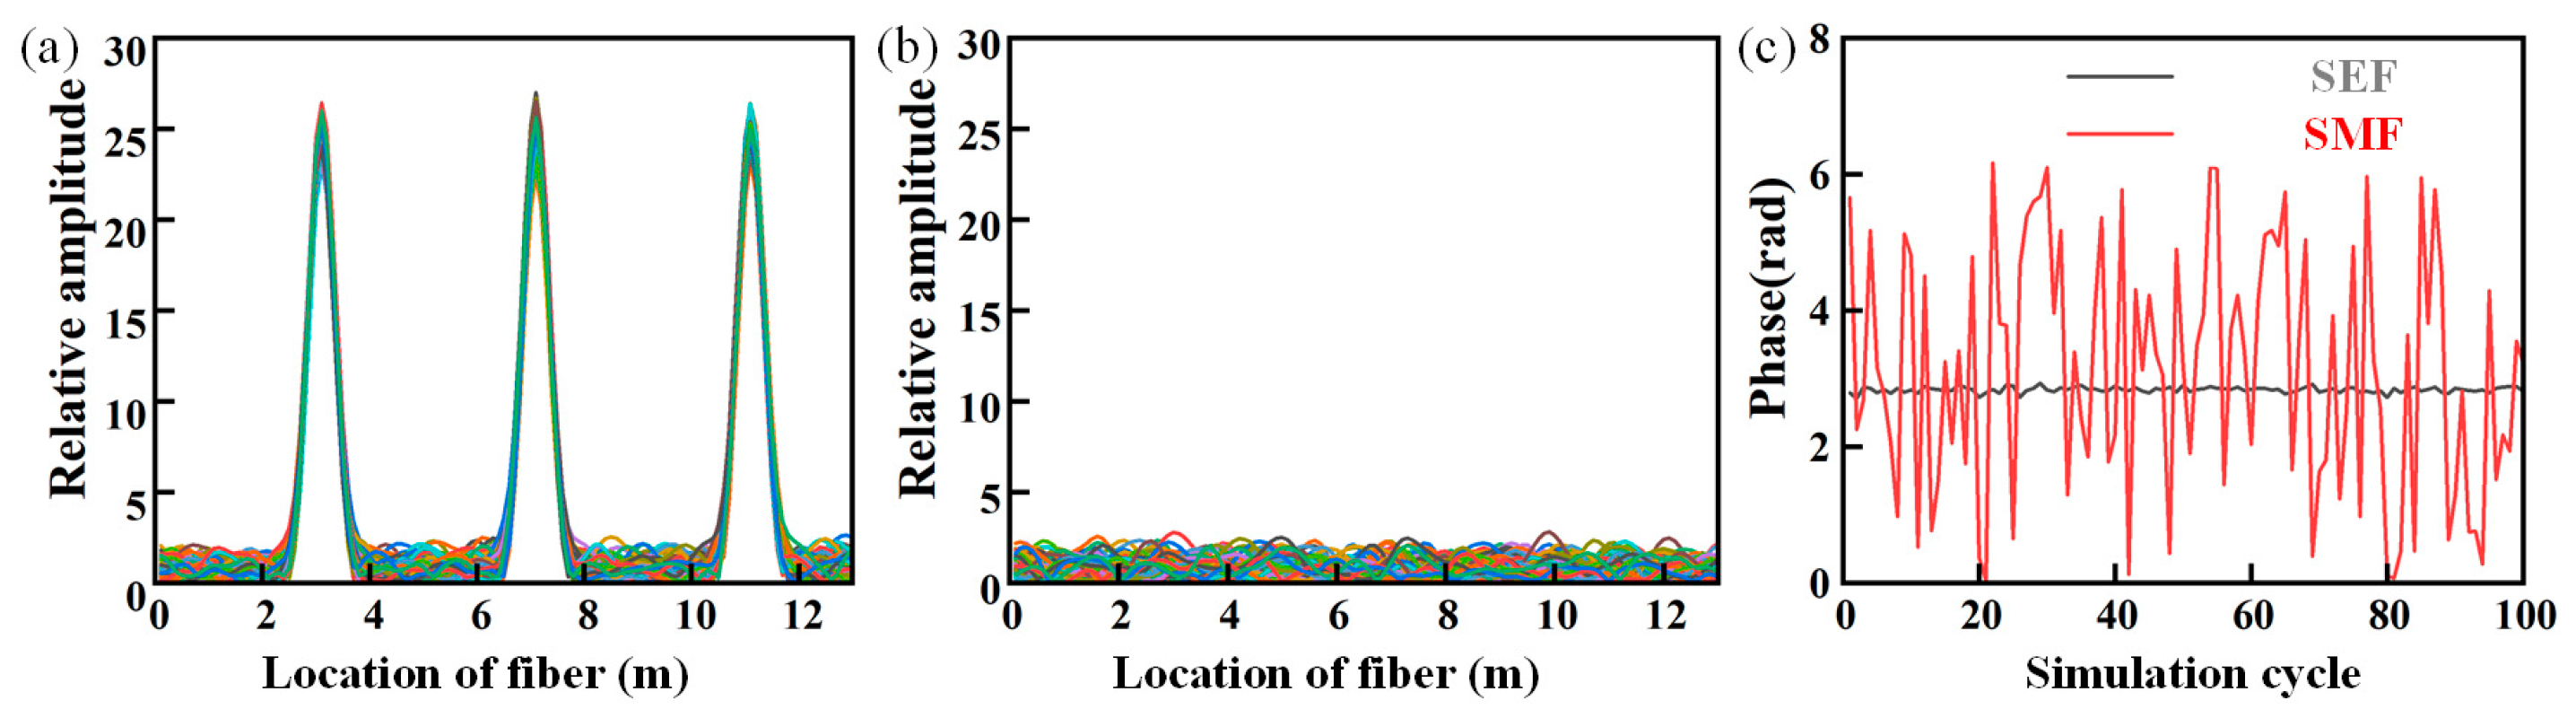
为了验证其有效性,我们从理论上分析了 DSE 模型和 SMF 散射模型。根据表 1 所示的参数,在光纤上的 3 m 、 7 m 和 11 m 处设置三个 SEP,间隔为 4 m。图 7a、b 显示了从模拟中获得的散射强度的分布结果。由此可见,DES 光纤完全抑制了信号幅度的随机变化和干扰衰落。为了进一步探究 DSE 光纤对相位噪声的抑制作用,我们分别解决了 SMF 和 DSE 光纤上 3 m 和 7 m 之间的相位差,其结果如图 7c 所示。与 SMF 相比,DSE 光纤不受普通 ERSP 随机分布的影响,而是由 SEP 的位置决定的,因此相位噪声受到很大抑制。
Figure 7. Simulation results of discrete enhanced scattering model: (a) reflection distribution of discrete enhanced fiber; (b) reflection distribution of single mode fiber; (c) phase demodulation result.
图 7.离散增强散射模型的仿真结果:(a) 离散增强光纤的反射分布;(b) 单模光纤的反射分布;(c) 相位解调结果。
Table 1. Parameters of discrete enhanced scattering model.
表 1.离散增强散射模型的参数。

3.3. Preparation and Implementation of DSE Fiber
3.3. DSE 纤维的准备和实施

At present, there are two ways to manufacture the discrete scattering-enhanced fiber, one is by inscribing the periodic ultra-weak Bragg grating (UWFBG) array [29,37] into the fiber, and the other is by introducing a local wavelength-independent weak reflection array into the fiber [38,39,40].
目前,有两种方法可以制造离散散射增强光纤,一种是将周期性超弱布拉格光栅(UWFBG)阵列[ 29, 37] 刻入光纤中,另一种是在光纤中引入局部波长无关的弱反射阵列 [ 38, 39, 40]。
UWFBG usually involves the use of ultraviolet light [41,42,43] or a femtosecond laser [44,45] to form a permanent periodic change in the refractive index of the optical fiber, so as to allow the backward reflection of a specific light wavelength. The most classic preparation system is shown in Figure 8a [46]. In the process of fiber drawing, through strict dynamic control, the UWFBG was written using the phase mask method, using periodic interference fringes of the ±1st diffraction light to irradiate the photosensitive fiber and periodically change the refractive index of the fiber core. Additionally, an FBG writing platform was mounted on the draw tower near the first coating to weaken vibrations in the fiber. The preparation results are shown in Figure 8b [47], and the scattering rate of the scattering-enhanced array is much higher than that of the single-mode fiber. However, as a Bragg grating method, UWFBG is sensitive to temperature and stress. When the temperature and strain of the environment are changed, the reflection wavelength of the UWFBG will drift. As shown in Figure 8c, the bandwidth of UWFBG is usually less than 2 nm and the central wavelength is determined according to the light source used in the specific experiment. Due to the limited bandwidth of UWFBG, there may be a mismatch between the reflective spectrum of UWFBG and the wavelength of the detection light when the UWFBG array fiber operates in special environments, such as for large temperature vibrations or high pressure, while the fiber will also suffer from twisting or pulling forces, meaning the reflection power from the UWFBG will degenerate into Rayleigh scattering, resulting in a blind sensing area. This characteristic of UWFBG hinders its application in underground, underwater, and other special environments [48,49].
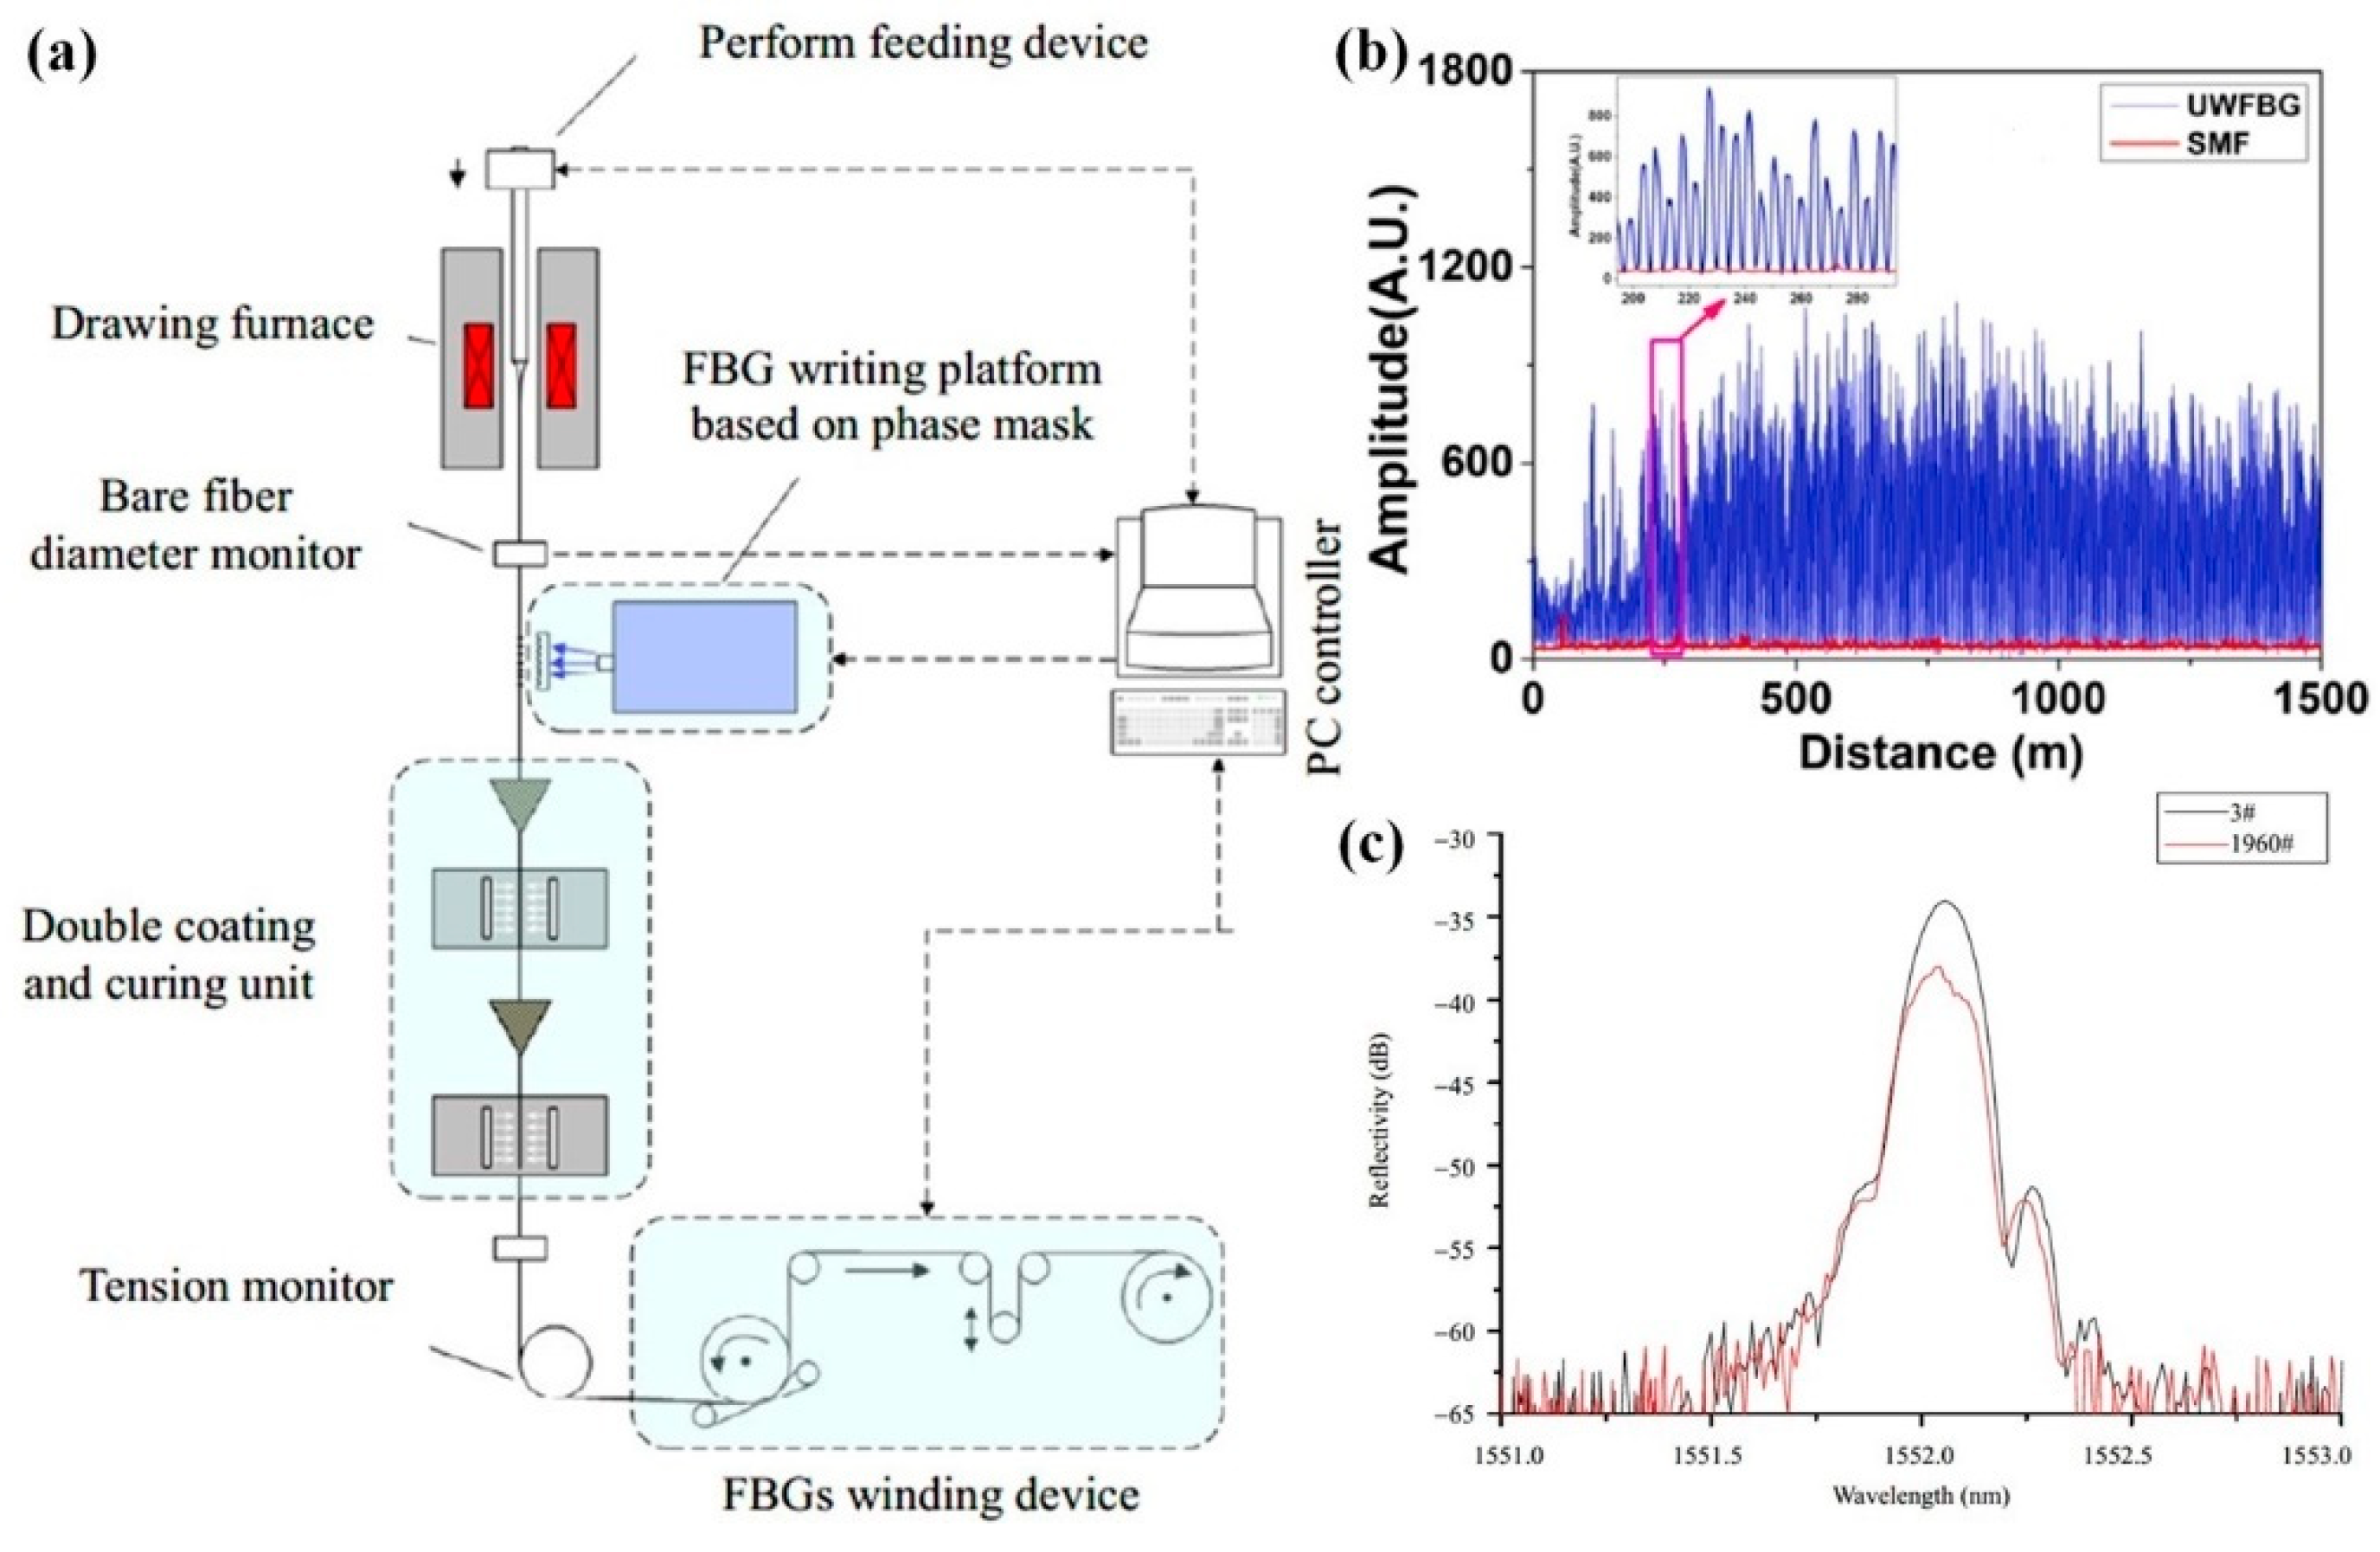
UWFBG 通常涉及使用紫外光 [ 41, 42, 43] 或飞秒激光 [ 44, 45] 在光纤的折射率上形成永久的周期性变化,从而允许特定光波长的反向反射。最经典的制备系统如图 8a [ 46] 所示。在拉丝光纤过程中,通过严格的动态控制,采用相位掩模法编写 UWFBG,利用±1 级衍射光的周期性干涉条纹照射感光光纤,周期性地改变纤芯的折射率。此外,在靠近第一涂层的牵伸塔上安装了一个 FBG 写入平台,以减弱光纤中的振动。制备结果如图 8b [ 47] 所示,散射增强阵列的散射率远高于单模光纤。然而,作为一种布拉格光栅方法,UWFBG 对温度和应力很敏感。当环境的温度和应变发生变化时,UWFBG 的反射波长会漂移。如图 8c 所示,UWFBG 的带宽通常小于 2 nm,中心波长根据具体实验中使用的光源确定。由于 UWFBG 的带宽有限,当 UWFBG 阵列光纤在特殊环境中工作时,例如大温度振动或高压,UWFBG 的反射光谱与检测光的波长可能会不匹配,同时光纤也会受到扭曲或拉力的影响,这意味着 UWFBG 的反射功率会退化为瑞利散射, 导致盲区感应区域。 UWFBG 的这一特性阻碍了其在地下、水下和其他特殊环境中的应用 [ 48, 49]。
Figure 8. Typical UWFBG preparation method: (a) online UWFBG preparation system [46]; (b) OTDR measurement results of the UWFBG array [47]; (c) reflection spectrum of UWFBG [46].
图 8.典型的 UWFBG 制备方法: (a) 在线 UWFBG 制备系统 [ 46];(b) UWFBG 阵列的 OTDR 测量结果 [ 47];(c) UWFBG 的反射光谱 [ 46]。
In recent years, the enhancement scheme of a local achromatic weak reflection array has also been used in DAS [50,51]. In order to prepare a more universal discrete scattering enhancement array, Sun et al. proposed a preparation method for microstructured optical fibers with a colorless reflection point. The mechanism of the microstructure involves the local refractive index change through UV exposure without the help of the phase mask to form a Fresnel reflecting surface. The fabrication system is shown in Figure 9a [52], while the preparation results are shown in Figure 9b–d [53]. A discrete scattering enhancement array with an interval of 5 m and 15 dB enhanced intensity was achieved. When the temperature changes, the scattering intensity of the microstructure is extremely stable. In addition, the University of Southampton and other universities in the UK also used a femtosecond laser to prepare a weak reflection array [40]. The preparation system, scheme, and results are shown in Figure 10. Compared with UWFBG, whose reflection bandwidth is limited, the weak reflection points are directly engraved in the optical fiber, without wavelength selectivity, avoiding the influence of temperature and strain [54].
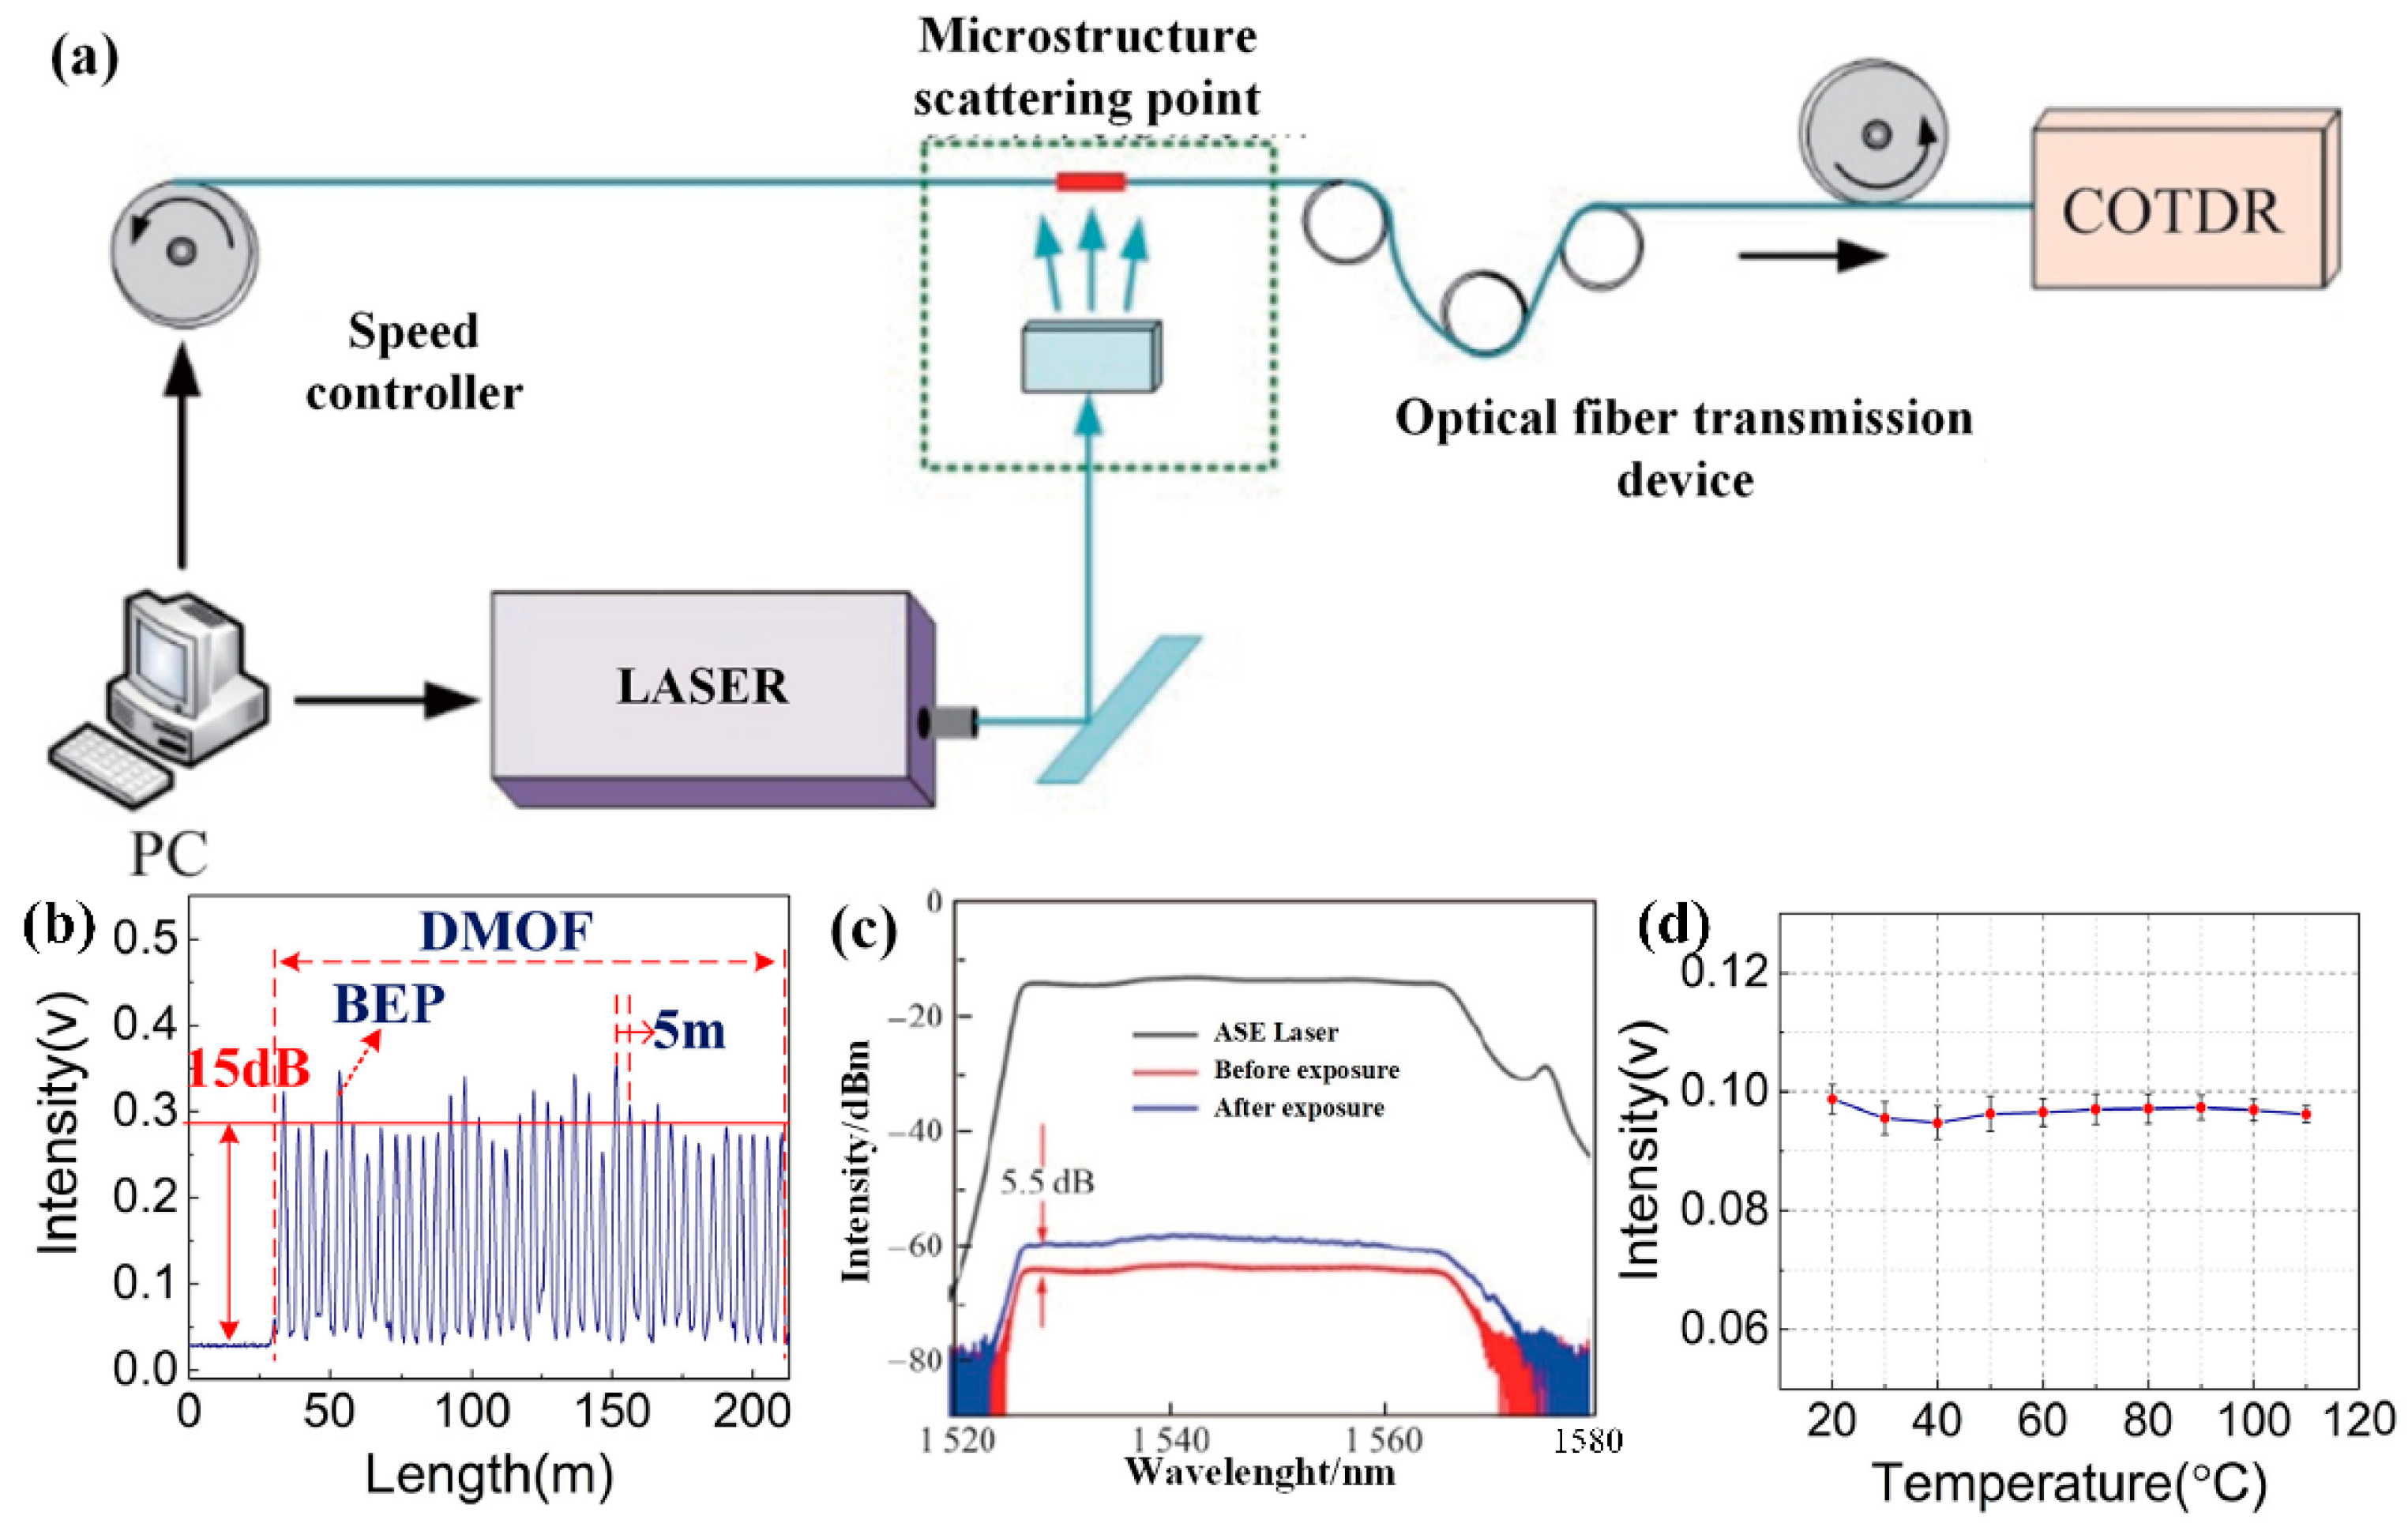
近年来,局部消色差弱反射阵列的增强方案也被用于 DAS [ 50, 51]。为了制备更通用的离散散射增强阵列,Sun 等人提出了一种无色反射点微结构光纤的制备方法。微观结构的机理涉及通过紫外线照射的局部折射率变化,而无需相位掩模的帮助,以形成菲涅耳反射表面。制造系统如图 9a [ 52] 所示,而制备结果如图 9b-d [ 53] 所示。实现了间隔为 5 m 且强度增强为 15 dB 的离散散射增强阵列。当温度变化时,微观结构的散射强度非常稳定。此外,英国南安普敦大学和其他大学也使用飞秒激光器制备了弱反射阵列 [ 40]。制备系统、方案和结果如图 10 所示。与反射带宽有限的 UWFBG 相比,弱反射点直接刻在光纤中,没有波长选择性,避免了温度和应变的影响 [ 54]。
Figure 9. Preparation method for a colorless microstructure array based on UV exposure: (a) automatic colorless microstructure preparation system [51]; (b) OTDR measurement results of colorless microstructure array [53]; (c) spectra of colorless microstructure arrays [51]; (d) temperature stability of colorless microstructure arrays [53].
图 9.基于紫外曝光的无色微结构阵列制备方法:(a) 全自动无色微结构制备系统 [ 51];(b) 无色微结构阵列的 OTDR 测量结果 [ 53];(c) 无色微结构阵列的光谱 [ 51];(d) 无色微结构阵列的温度稳定性 [ 53]。
Figure 10. Preparation method for a weak reflection array based on a femtosecond laser [40]: (a) weak reflection array preparation system; (b) schematic diagram of weak reflection array preparation method; (c) OTDR measurement results for the weak reflection array; (d) the result of a cut-back measurement on a separate fiber containing 300 reflectors.
图 10.基于飞秒激光器的弱反射阵列制备方法 [ 40]:(a) 弱反射阵列制备系统;(b) 弱反射阵列制备方法示意图;(c) 弱反射阵列的 OTDR 测量结果;(d) 对包含 300 个反射器的单独光纤的削减测量结果。

3.4. Methods to Improve the Performance of Specialty Fiber DAS
3.4. 提高特种纤维 DAS 性能的方法

In the early stages, researchers mainly focused on using UWFBG in various DAS schemes. In 2015, Wang et al. used UWFBG in DAS based on a 3 × 3 coupler demodulation for hydroacoustic testing, which can detect a water pressure of 0.112 Pa [55]. Subsequently, the team at Huazhong University of Science and Technology successively used DSE fiber in various DAS schemes, such as double-pulse, coherent detection, and PGC demodulation schemes [29,39,40,50,56,57,58]. These schemes are shown in Figure 11. In recent years, more attention has been paid to improving the DAS system performance by using the advantages of discrete scattering enhancement fiber, including low-frequency phase shift compensation, polarization fading suppression, pulse width compression, and system sampling rate expansion.
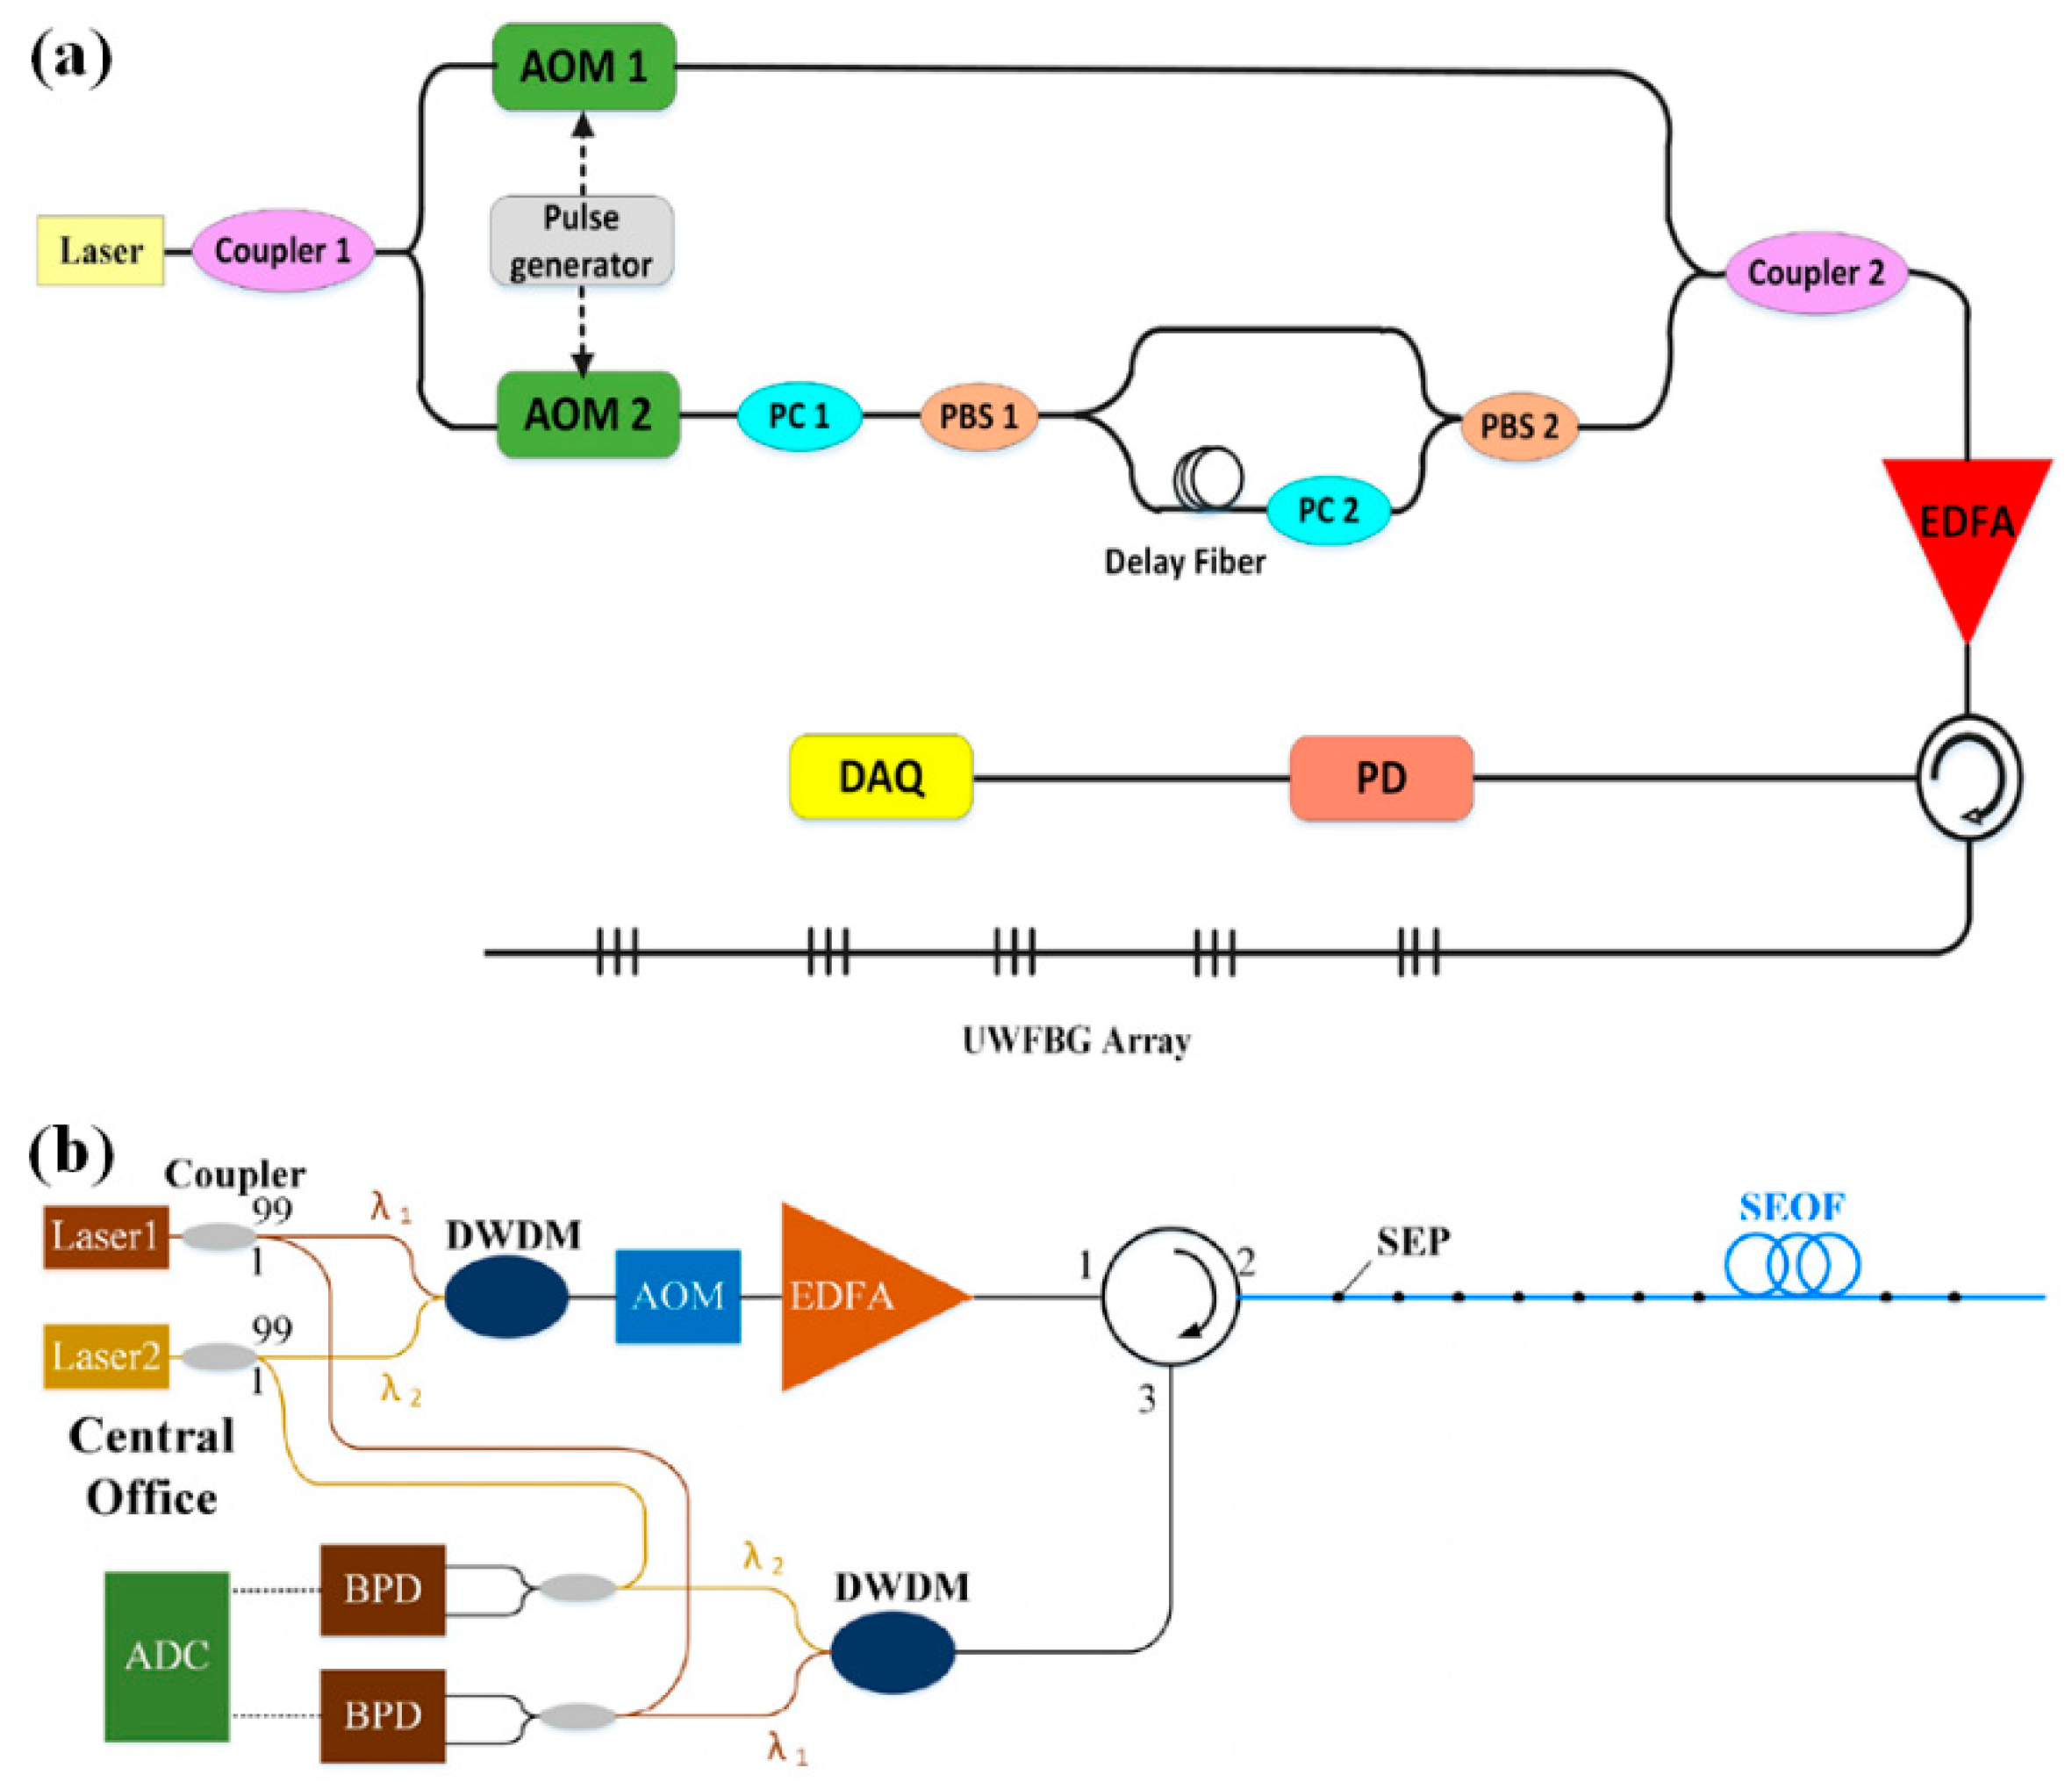
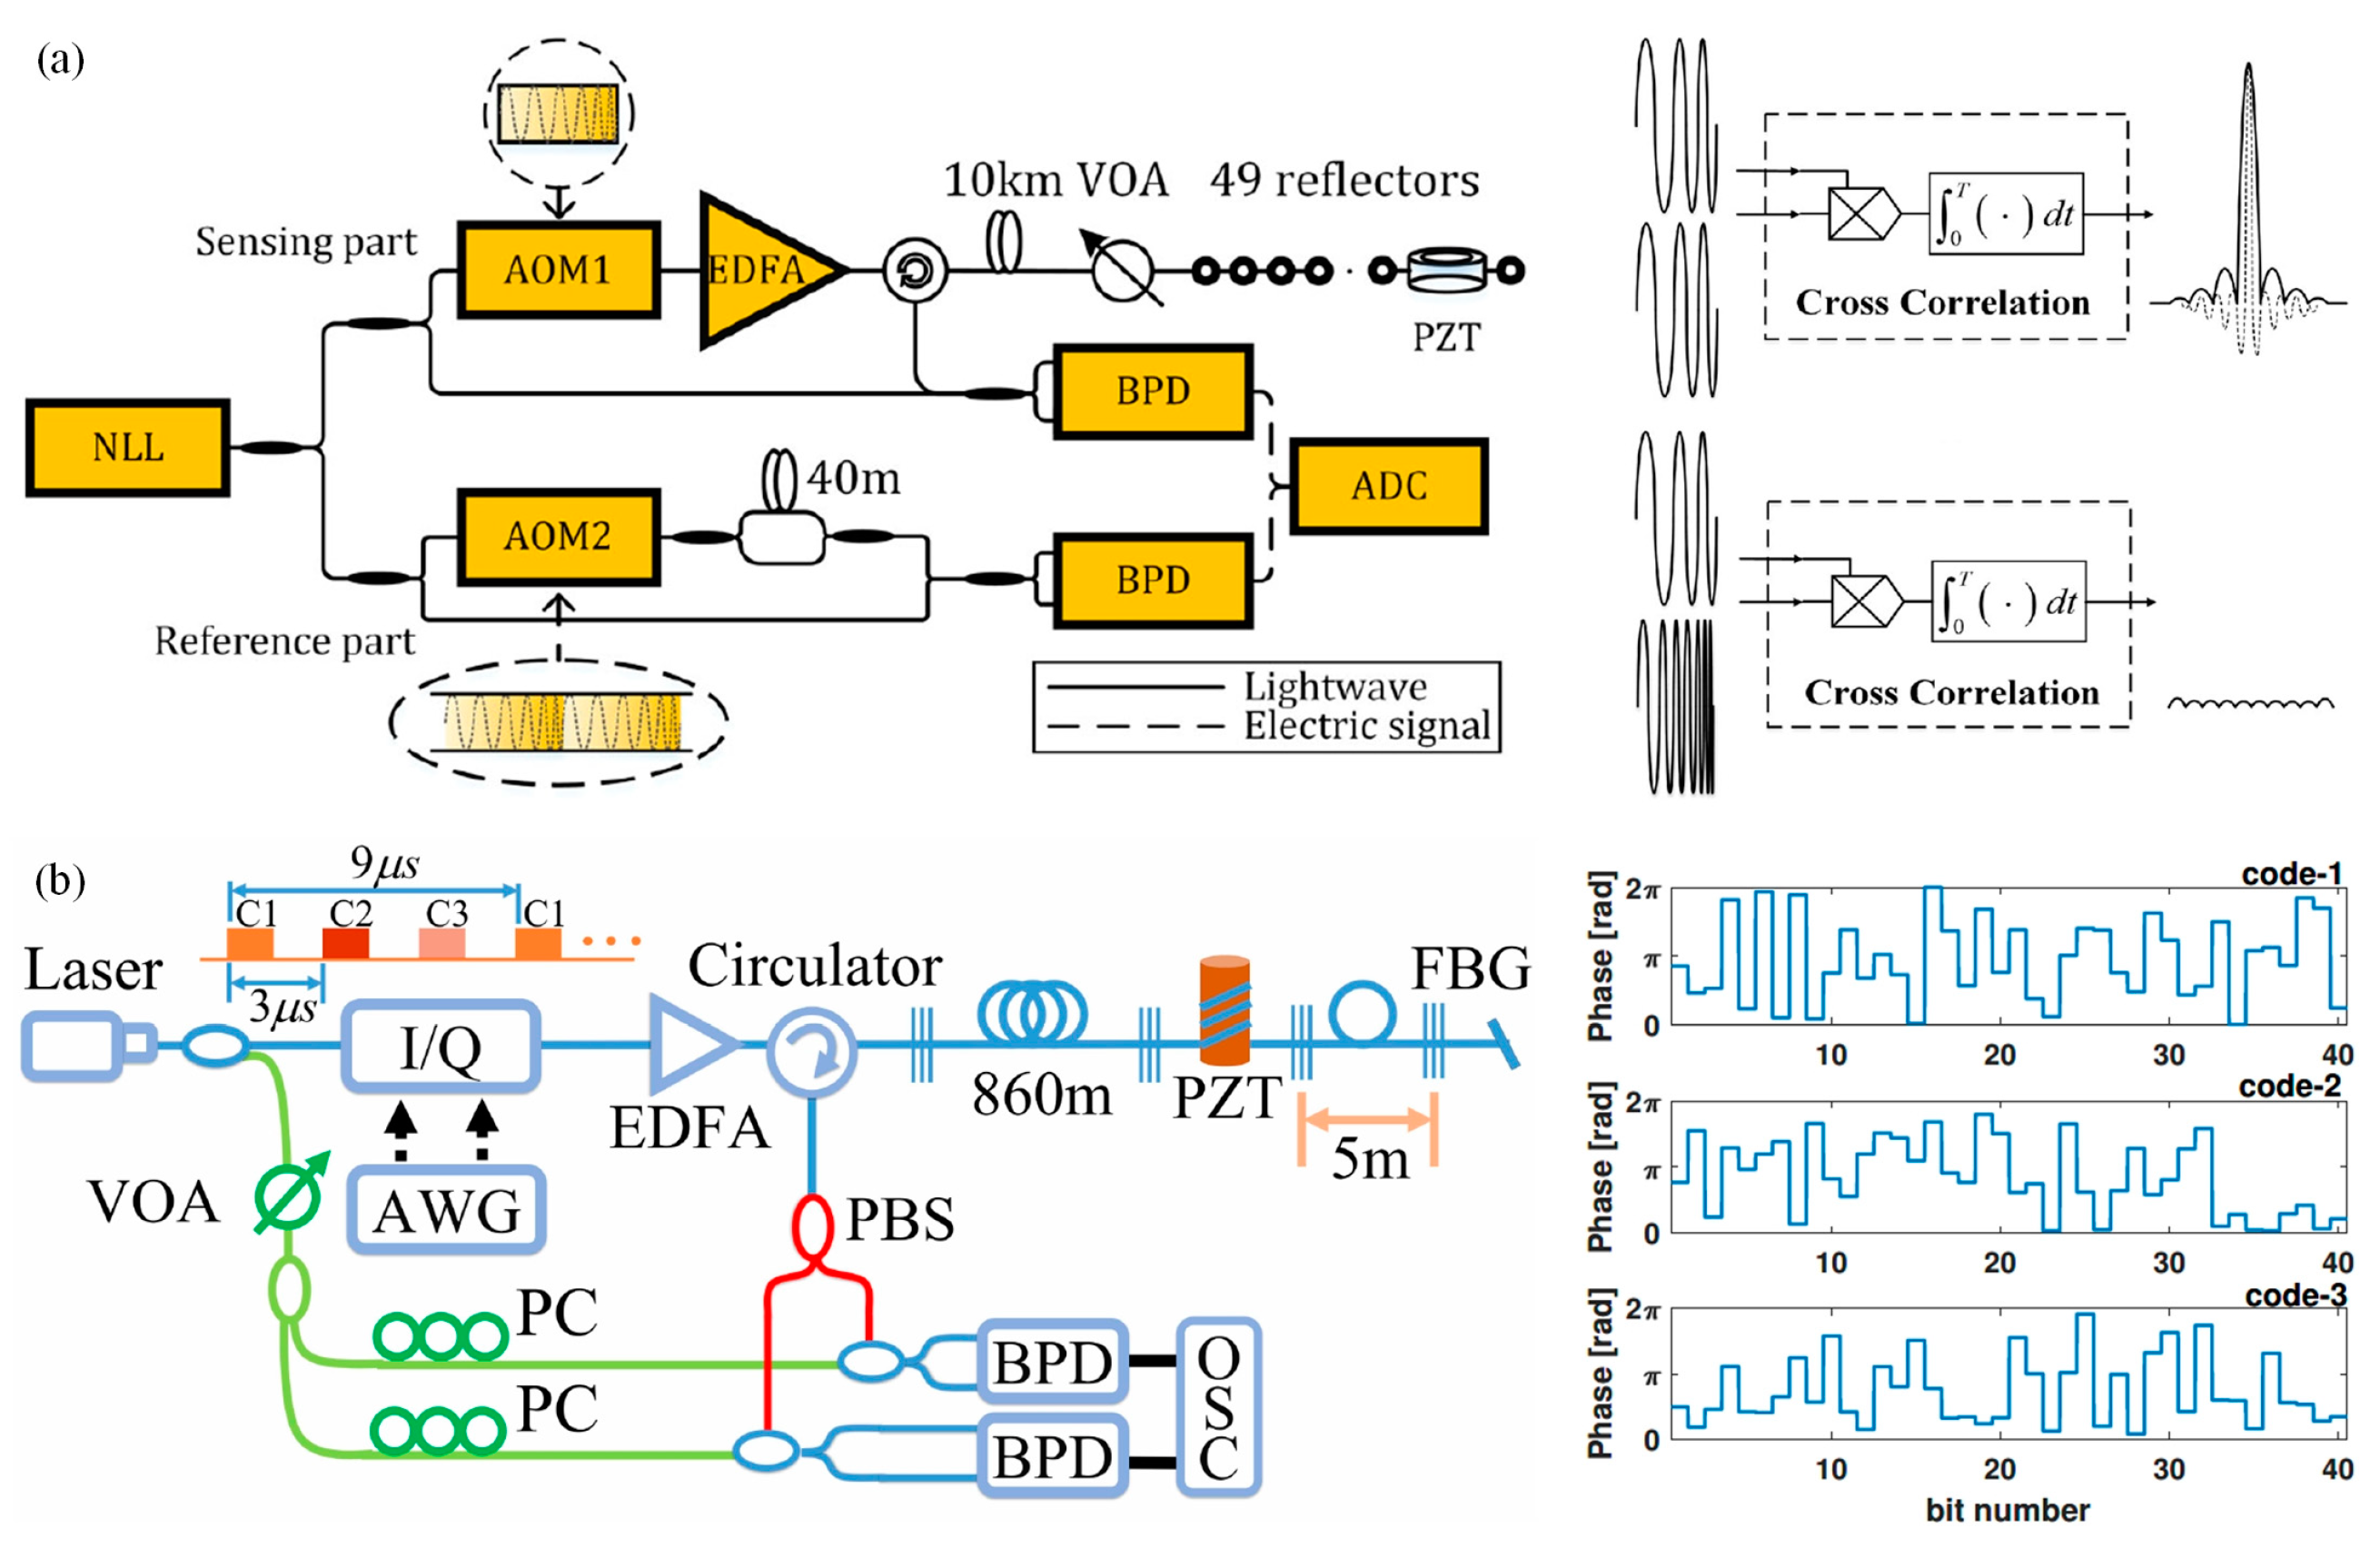
在早期阶段,研究人员主要集中在 UWFBG 在各种 DAS 方案中的使用。2015 年,Wang 等人在 DAS 中使用了基于 3 × 3 耦合器解调的 UWFBG 进行水声测试,可以检测到 0.112 Pa 的水压 [ 55]。随后,华中科技大学团队陆续将 DSE 光纤用于各种 DAS 方案,如双脉冲、相干检测和 PGC 解调方案[29,39,40,50,56,57,58]。这些方案如图 11 所示。近年来,人们越来越注重利用离散散射增强光纤的优势来提高 DAS 系统的性能,包括低频相移补偿、偏振衰落抑制、脉宽压缩和系统采样率扩展。
Figure 11. Representative DAS scheme based on UWFBG: (a) scheme using a 3 × 3 coupler [54]; (b) PGC scheme [55]; (c) heterodyne coherent detection scheme [29].
图 11.基于 UWFBG 的代表性 DAS 方案:(a) 使用 3 × 3 耦合器的方案 [ 54];(b) PGC 计划 [ 55];(c) 外差相干检测方案 [ 29]。

3.4.1. Low-Frequency Phase Drift Compensation Technology
3.4.1. 低频相位漂移补偿技术

The DSE fiber DAS has the potential for extremely low-frequency detection due to its good signal consistency and lac of interference of random Rayleigh scattering. In the DAS system, the low-frequency drift of the laser phase and the slow change of the external temperature will introduce greater low-frequency noise to the system, limiting the accuracy of the low-frequency detection [59]. The phase drift of the laser can be compensated by the auxiliary interferometer. As shown in Figure 12a, the phase noise of the laser is measured in real time by the auxiliary interferometer, and the measurement results are compensated to suppress the low-frequency noise. In this way, Fan et al. achieved a strain resolution of 3.84pε/Hz [60,61] at a frequency of 10 Hz. The team from Huazhong University of Science and Technology proposed a reference fiber compensation scheme via the discrete enhancement of UWFBG. The scheme is shown in Figure 12b, which can compensate for laser drift and temperature changes at the same time, achieving a resolution of 0.57nε/Hz at a frequency of 0.01 Hz and a resolution of 3.4nε/Hz at a frequency of 10 Hz [62]. Furthermore, the team introduced an LS-SVM operator during demodulation to track and compensate for the hysteresis effect of the temperature, allowing high-precision acoustic measurements in the 0.001 Hz frequency band [63].
DSE 光纤 DAS 具有良好的信号一致性和随机瑞利散射的干涉 lac,因此具有极低频检测的潜力。在 DAS 系统中,激光相位的低频漂移和外部温度的缓慢变化会给系统带来更大的低频噪声,限制了低频检测的精度 [ 59]。激光器的相位漂移可以通过辅助干涉仪进行补偿。如图 12a 所示,激光的相位噪声由辅助干涉仪实时测量,并对测量结果进行补偿以抑制低频噪声。通过这种方式,Fan 等人在 10 Hz 的频率下实现了 3.84pε/Hz [ 60, 61] 的应变分辨率。华中科技大学团队通过对 UWFBG 的离散增强提出了一种参考光纤补偿方案。该方案如图 12b 所示,它可以同时补偿激光漂移和温度变化,实现 0.01 Hz 频率 0.57nε/Hz 和 10 Hz 频率 3.4nε/Hz 的分辨率 [ 62]。此外,该团队在解调过程中引入了 LS-SVM 算子来跟踪和补偿温度的磁滞效应,从而可以在 0.001 Hz 频段进行高精度的声学测量[63]。
Figure 12. Representative scheme for low-frequency noise suppression: (a) auxiliary interferometer compensation [60,61]; (b) reference fiber compensation [62].

3.4.2. Polarization Fading Suppression Technology

In the DSE-fiber-based DAS system, the coherent fading is completely suppressed, while the polarization random fading problem must be urgently solved [16]. The random polarization fading is caused by the random change in polarization states of the two interference lights. When the polarization directions of the two interference lights are parallel, the interference light signal is the largest and the phase noise is the smallest. However, when the directions are orthogonal, the interference light intensity is decreased to zero and the phase information is completely overwhelmed by noise. In order to solve this problem, Zhang et al. improved the dual-wavelength DAS scheme. As shown in Figure 13, the polarization composite double pulse was used as the detection pulse to achieve polarization noise suppression [16,64]. For the coherent detection DAS scheme, Sun et al. used a polarization beam splitter to divide the reflected light into two orthogonal polarization states to interfere with the local oscillator light, so that the random polarization noise was reduced by 9.5 dB [65]. However, in this scheme, when the polarization states of the local oscillator light and the polarization beam splitter do not match, fading may still occur. To resolve this problem, the Huazhong University of Science and Technology team proposed a method for emitting dual-wavelength probe pulses and using the random polarization states of different wavelength parameters to greatly reduce the probability of polarization fading and to reduce polarization noise by 19.2 dB [66].
Figure 13. Representative scheme for polarization noise suppression: (a) orthogonal polarization scheme [16]; (b) multi-parameter scheme [66].

3.4.3. Pulse Width Compression Technology

In the DAS system, the interval between the SEPs determines the resolution of the system and also limits the width of the detection pulse. Assuming that the interval between the SEPs is d, the detection pulse is limited to τ2dn/c (where n is the refractive index of the fiber and c is the speed of light in the vacuum). In a radar system, a longer detection pulse is usually transmitted and the pulse is compressed at the receiving end, so as to obtain a signal with a high signal-to-noise ratio under the premise of ensuring the resolution. The common schemes are pulse linear frequency sweeping and pulse coding [67,68,69]. These techniques have also been used in DSE fiber DAS systems. Fan et al. adopted the sweeping pulse transmission scheme, whereby the receiving end compresses the pulses through matched filtering, achieving a noise level of 93.16dB re rad/Hz at 500–2500 Hz as shown in Figure 14a [70,71]. Wang et al. successively used pulse coding technology in UWFBG-based DAS systems and improved the systems’ SNR values by 6.9 dB as shown in Figure 14b [72].
Figure 14. Representative scheme for pulse width compression: (a) orthogonal polarization scheme [70,71]; (b) multi-parameter scheme [72].

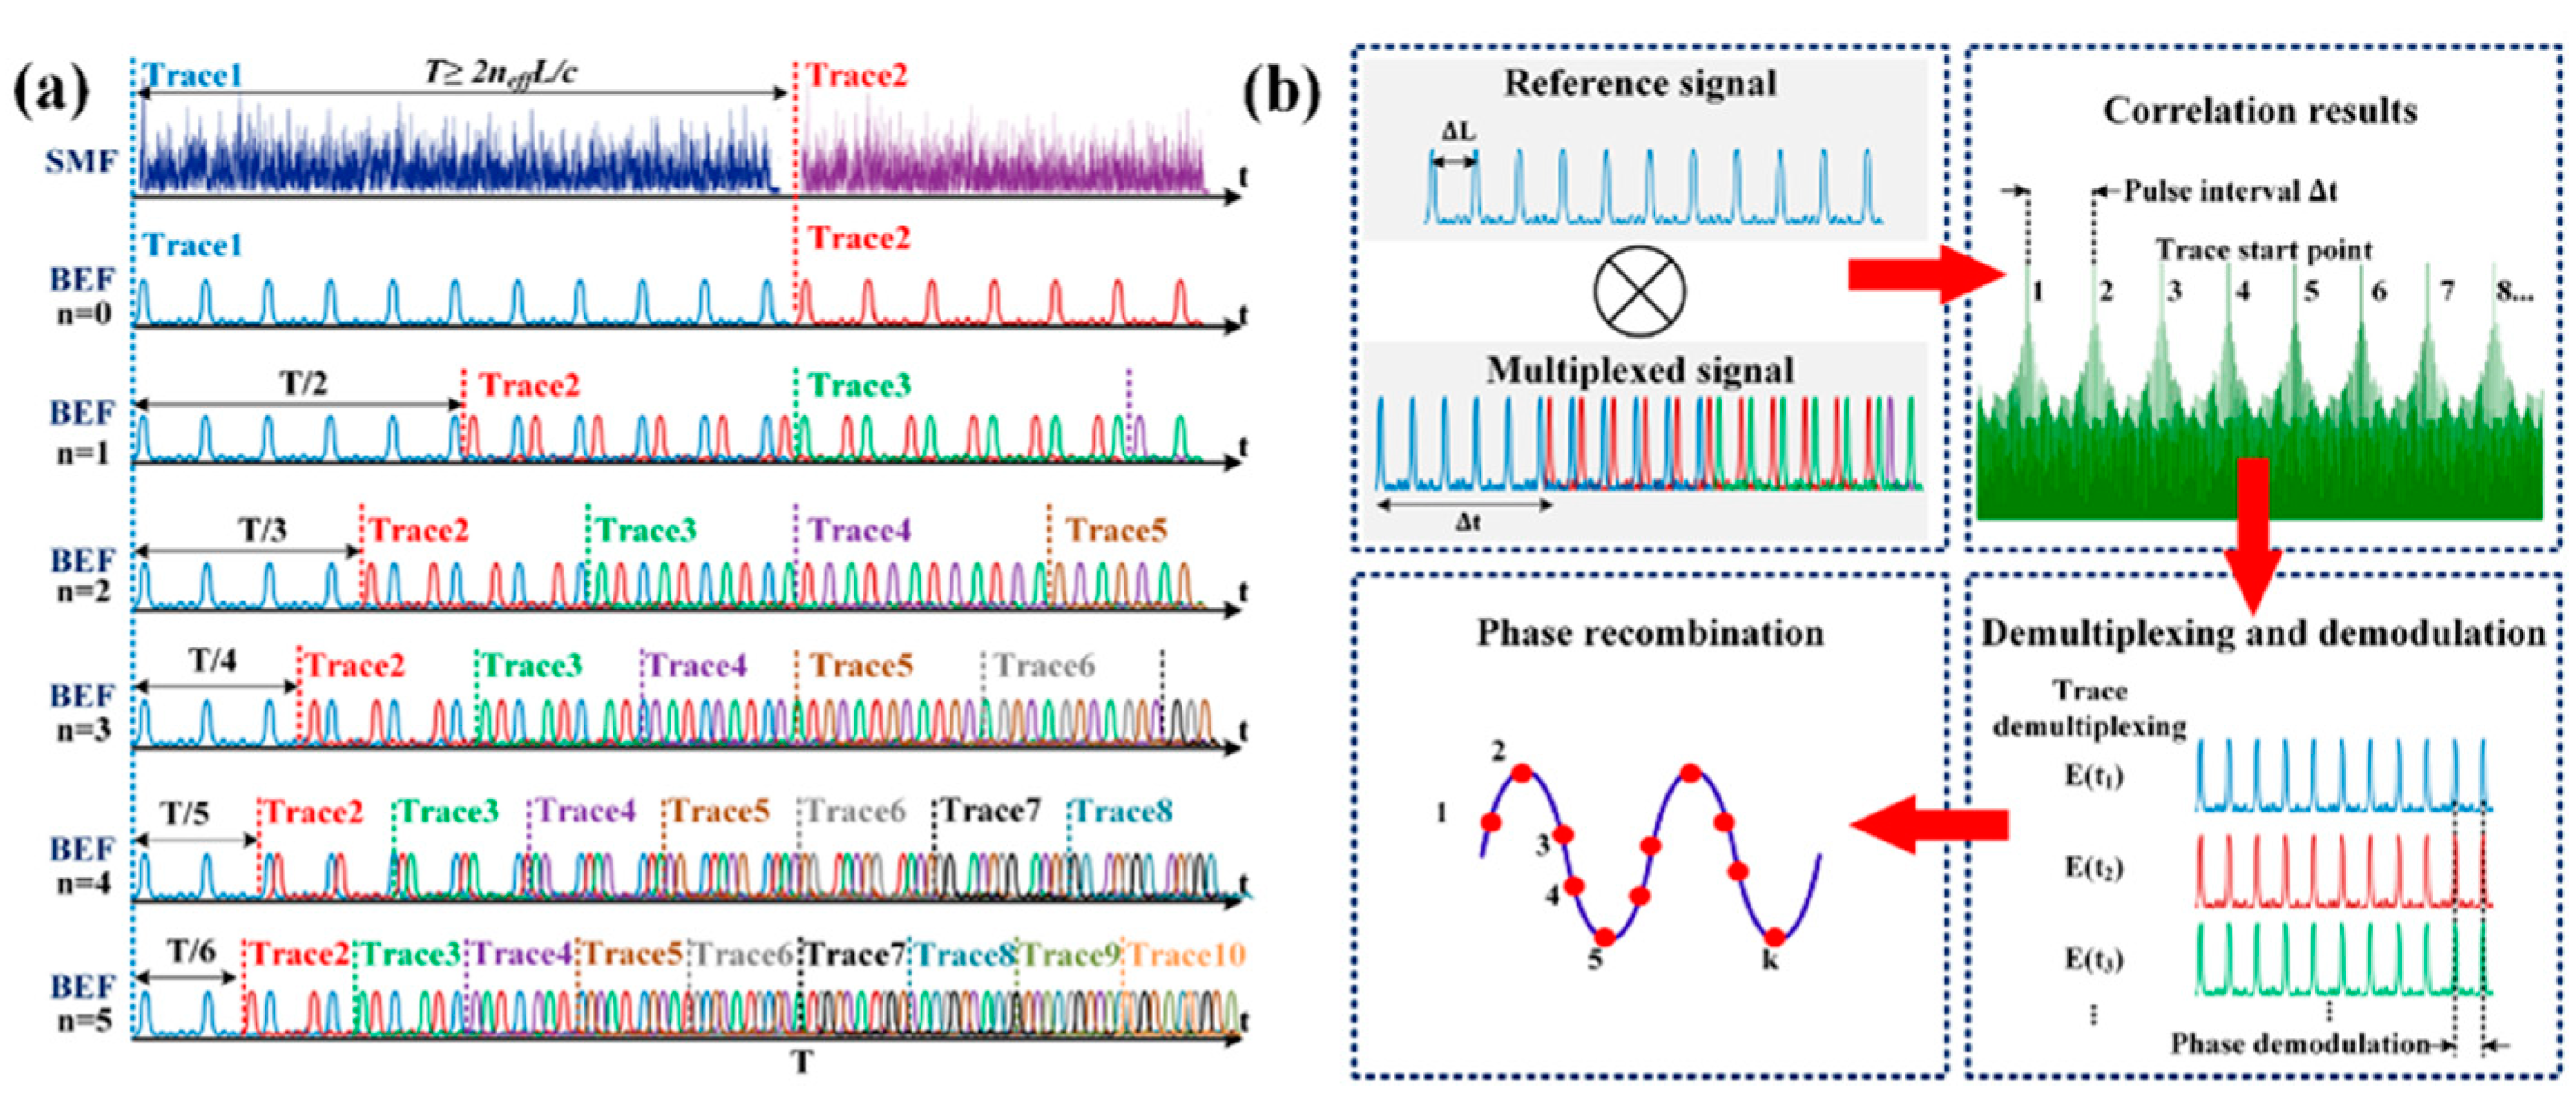
3.4.4. Sampling Frequency Expansion Technology

In DAS system, the sampling rate is mainly limited by the length of the sensing fiber. After the system transmits the probe pulse into the optical fiber, it needs to ensure that the Rayleigh backscattering signal transmitted to the farthest end of the pulse returns to the receiving end before transmitting the next pulse, otherwise crosstalk will occur. However, during railway safety detection and power grid partial discharge detection applications, it is necessary for the DAS system to perform long-distance and high-frequency detection simultaneously. The way to solve these problems is to transmit multiple probe lights in parallel and distinguish them through a certain feature to avoid crosstalk. By transmitting pulses with different frequencies into the optical fiber and distinguishing them by using different pulse frequencies, Zhang et al. achieved a sampling rate of 440 kHz on a 330 m optical fiber and expanded the distance bandwidth product by three times [73]. Sun et al. put forward a time slot multiplexing scheme. As shown in Figure 15, multiple pulses are inserted into the time slot between two adjacent SEPs of an optical fiber, with a sampling rate of 300 kHz being achieved on a 1020 m optical fiber, expanding the distance bandwidth product by six times [74].
Figure 15. Time slot multiplexing scheme [74]: (a) principle; (b) demodulation algorithm.
Above, the two specialty fibers, namely CSE fiber and DSE fiber, are analyzed and compared in terms of SNR enhancements, sensing distance, and methods to improve the performance. As shown in the Table 2, it can be seen that the DSE fiber performs significantly better than the CSE fiber in terms of the sensing distance, while the greater number of matching DAS schemes also further improves the performance of DAS system in multiple dimensions.
Table 2. Performance summary for CSE and DSE fibers.

4. Significant Application Progress

With the continuous improvement and development of the DAS system based on the specialty scattering-enhanced optical fiber, researchers have applied the system to practical engineering applications in many fields, including geological and resource exploration, structural health monitoring, and hydroacoustic exploration.

4.1. Geological and Resource Exploration

The vertical seismic profile (VSP) is a commonly used parameter for petroleum exploration seismic observations. With the development of DAS technology, fiberoptic logging has become a research hotspot.
Sun et al. conducted a walkaway VSP experiment using a self-made microstructure fiber DAS system [75]. The microstructure fiber is arranged vertically in the test well and the explosive source is artificially introduced on the ground to generate seismic waves, which are transmitted along the stratum to generate direct waves and reflected waves. Figure 16 shows the VSP results recorded at the “zero bias” position and 2.5 km away from the “non-zero bias” position. Figure 16a is the seismic wave transmission diagram recorded by the microstructure fiber DAS system under the condition of “zero bias”. The specific details are enlarged, as shown in Figure 16b. It can be observed that clear direct transmission of the p-wave and s-wave is demonstrated, and that the peaks and troughs of multi-channel signals correspond to each other, highlighting the phase difference caused by the transmission time, which proves the high consistency of the microstructure fiber DAS system. In addition, as shown in Figure 16c, for the “non-zero biased” signal away from 2.5 km, the microstructure fiber DAS can also record direct waves and reflected waves with high SNR values. The DAS system based on microstructure fiber has the advantages of a high SNR, high signal consistency, and high reliability, meaning it could become an efficient, fast, and reliable acquisition tool for oil data acquisition, potentially allowing intelligent resource exploration.
Figure 16. VSP test results for the microstructure fiber DAS system [75]: (a) “zero bias” test results; (b) schematic diagram of signal consistency; (c) “non-zero bias” test results; (d) “zero bias” spectrum diagram; (e) “non-zero bias” spectrum.
In 2019, Yang built a DAS system based on a UWFBG array [76], using UWFBG to enhance the intensity of the fiber’s backscattered signal as shown in Figure 17. In the experiment, the results measured by optical fiber were compared with the waveforms measured by geophone, and the time-frequency results were in good agreement. Furthermore, it was applied to VSP logging, and a clear VSP waveform with a high SNR was obtained without any data processing.
Figure 17. (a) The VSP test site. (b) The VSP test result [76].

4.2. Structural Health Monitoring

The health status of various infrastructure, such as railways, tunnels, and pipelines, is related to operational safety, the national economy, and social production. The DAS system based on scattering-enhanced fibers was applied to the field of structural health monitoring to ensure high reliability.

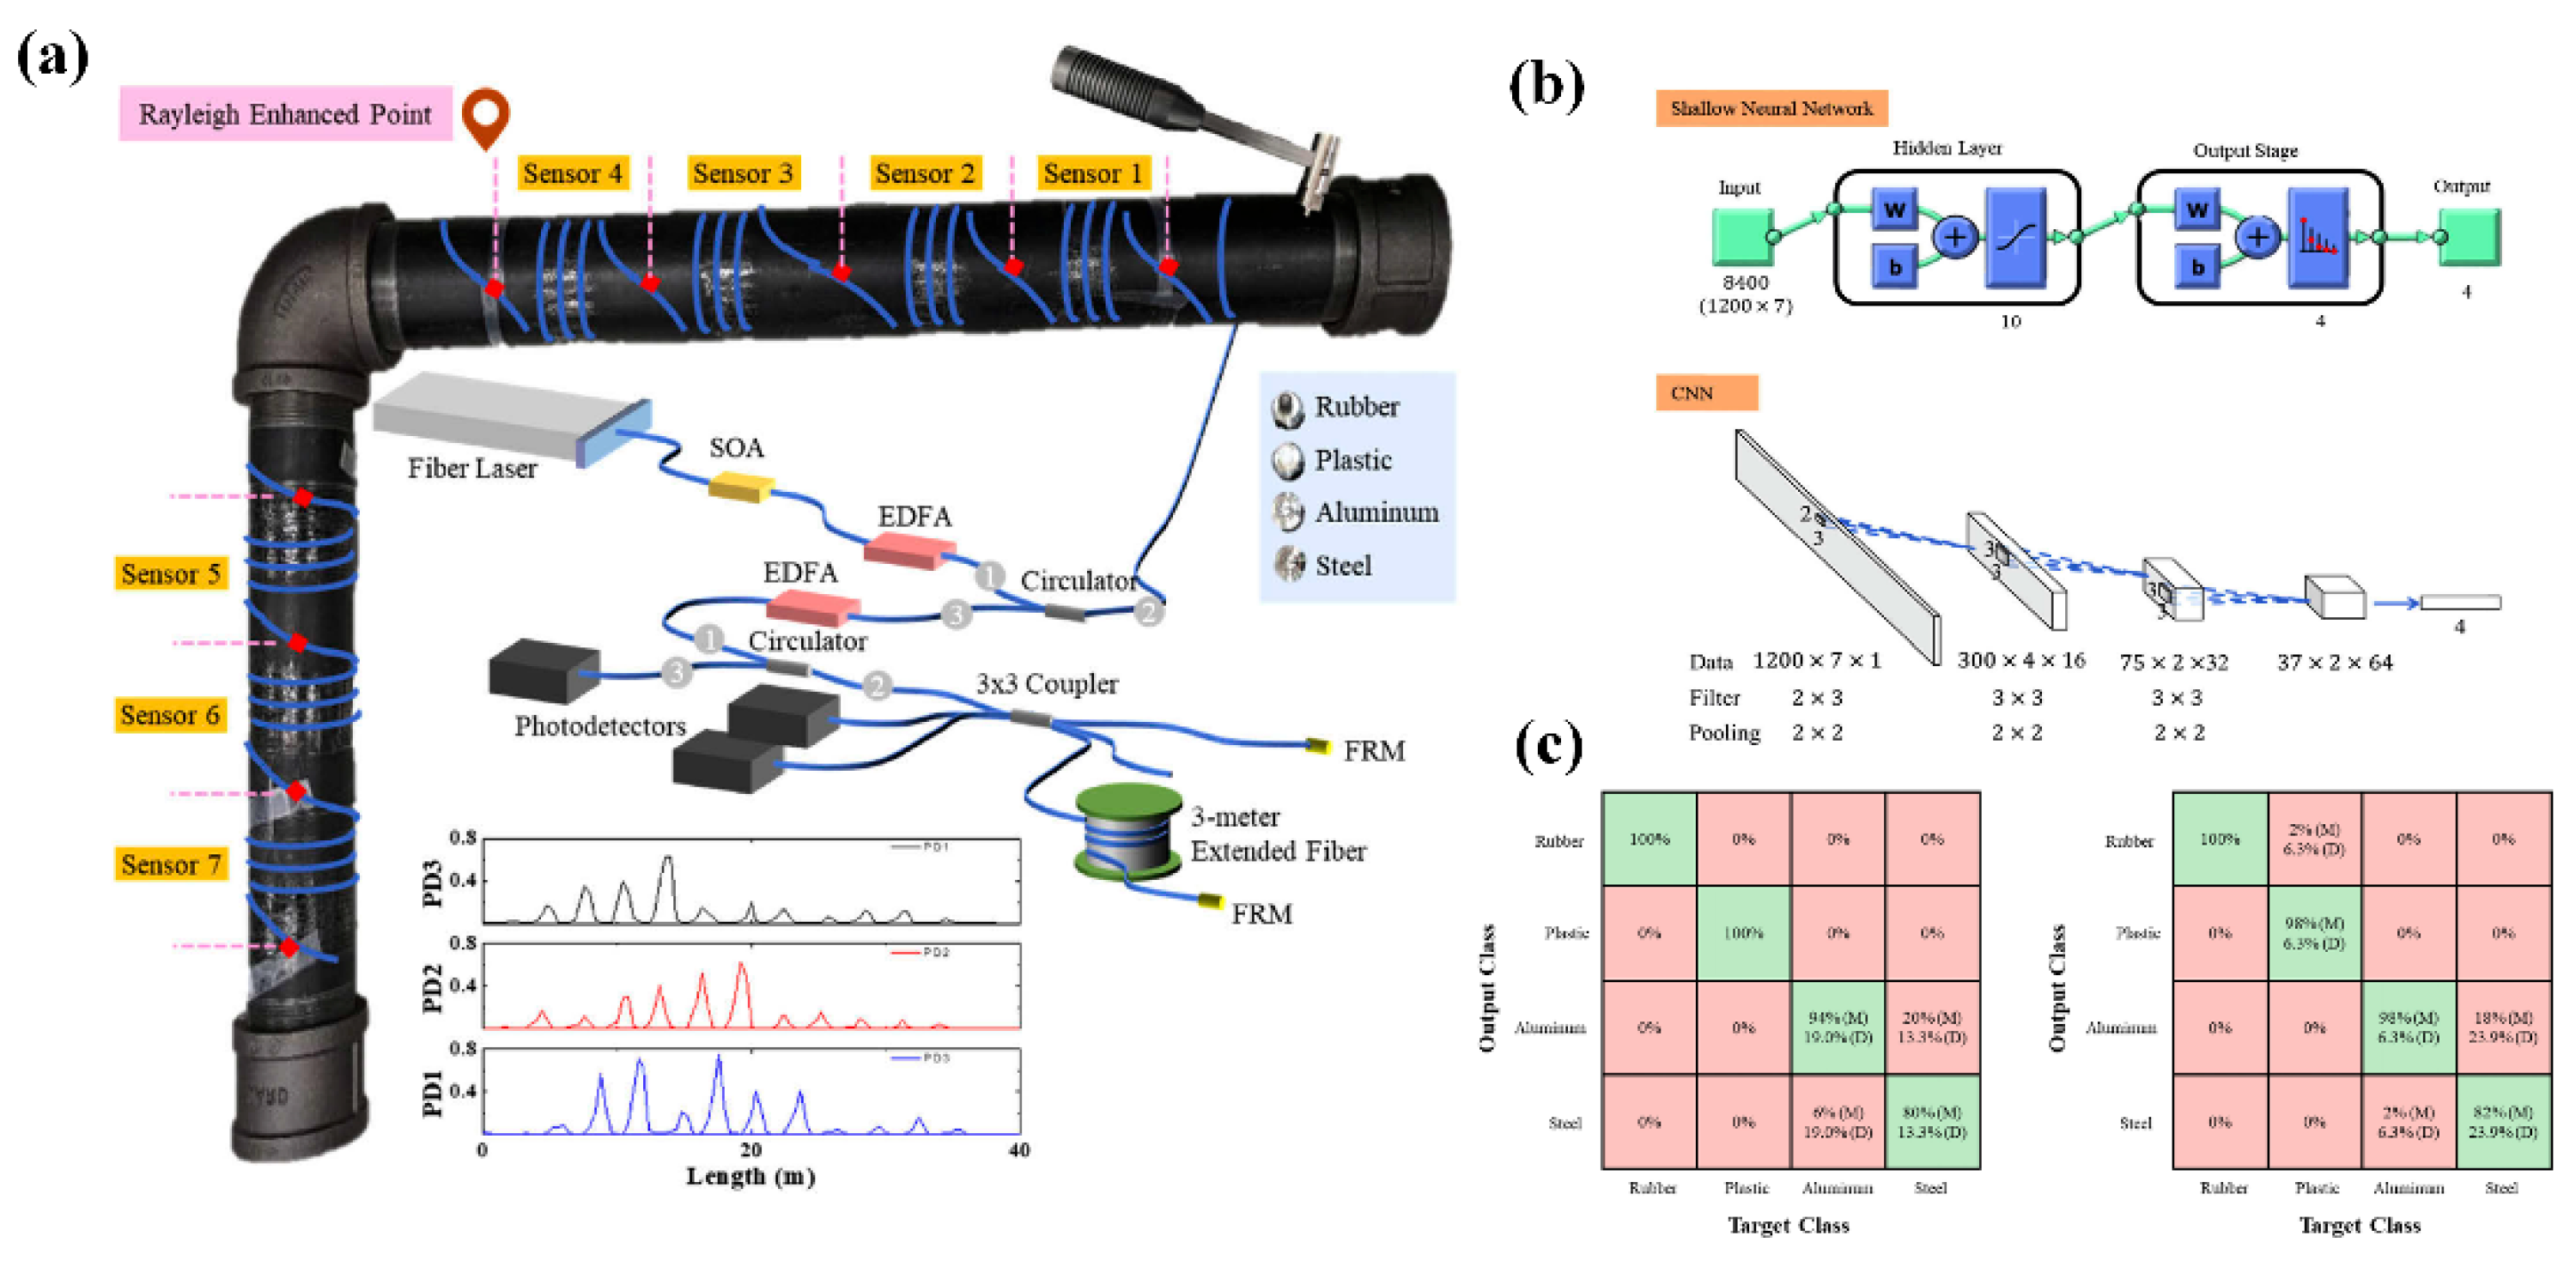
4.2.1. Pipeline Monitoring

The transportation of resources such as oil and natural gas is closely related to the national economy and people’s lives, but transmission pipelines may fail due to external invasion, corrosion, and other reasons, threatening the safety of personal, profits, and property. The DAS system based on discrete enhanced optical fibers was applied for pipeline safety monitoring due to its high SNR and high stability [77,78].
A team from the University of Pittsburgh [79] used femtosecond writing technology to artificially introduce optical fiber SEPs. As shown in Figure 18, the high-SNR DAS system tracks the propagation characteristics of soundwaves in the pipeline, combined with neural-network-based machine learning algorithms, and the data collected by the DAS system are analyzed to identify external intrusion events and the internal corrosion status of the pipeline. The system’s recognition accuracy for different external intrusion events exceeds 85%, the defect recognition accuracy rate exceeds 94% under supervised learning conditions, while the recognition accuracy rate reaches 71% under unsupervised learning conditions. Furthermore, the team also conducted a test of the sand content and the solid–liquid two-phase flow of the pipeline by laying a discrete scattering enhancement fiber on the pipeline wall. By tracking the acoustic emission signals induced by the sand particles in the liquid hitting the pipe wall, the measurement of different sand particle concentrations was achieved.
Figure 18. Schematic diagram of a pipeline survey [79]: (a) schematic diagram of DAS system for pipeline protection; (b) architectures of neural networks in the pipeline protection system; (c) the confusion matrix of four acoustic events.

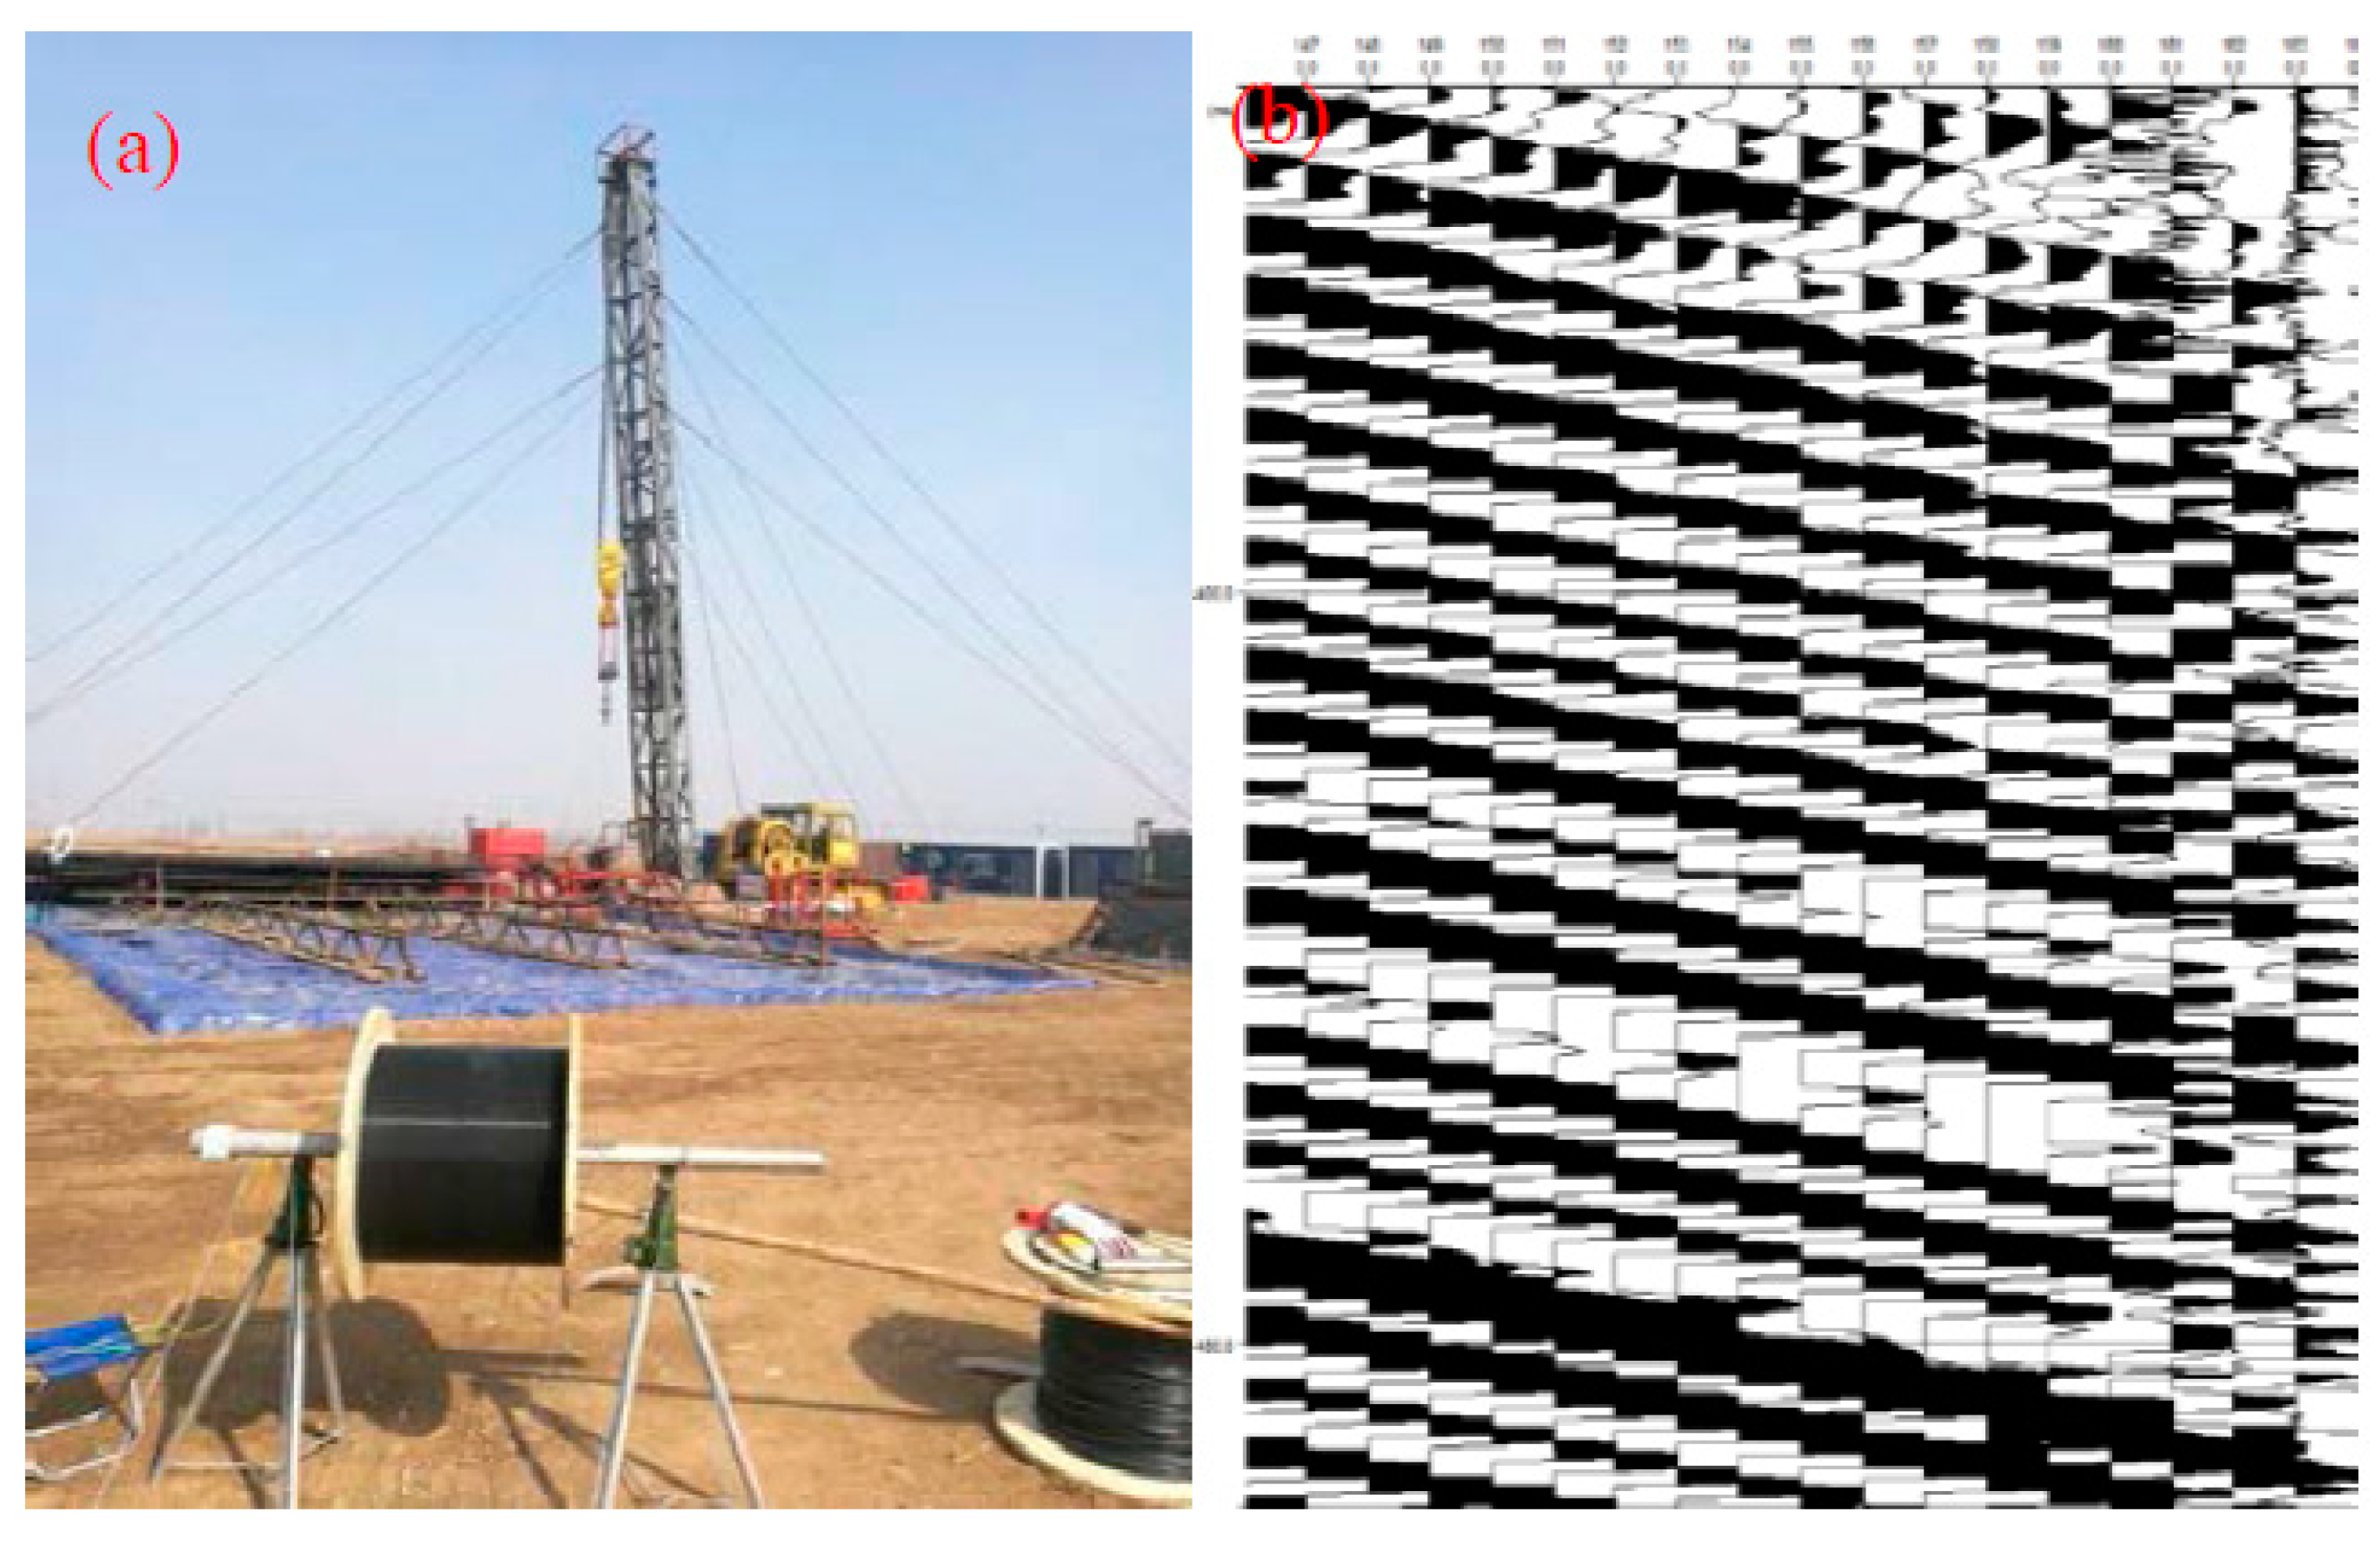
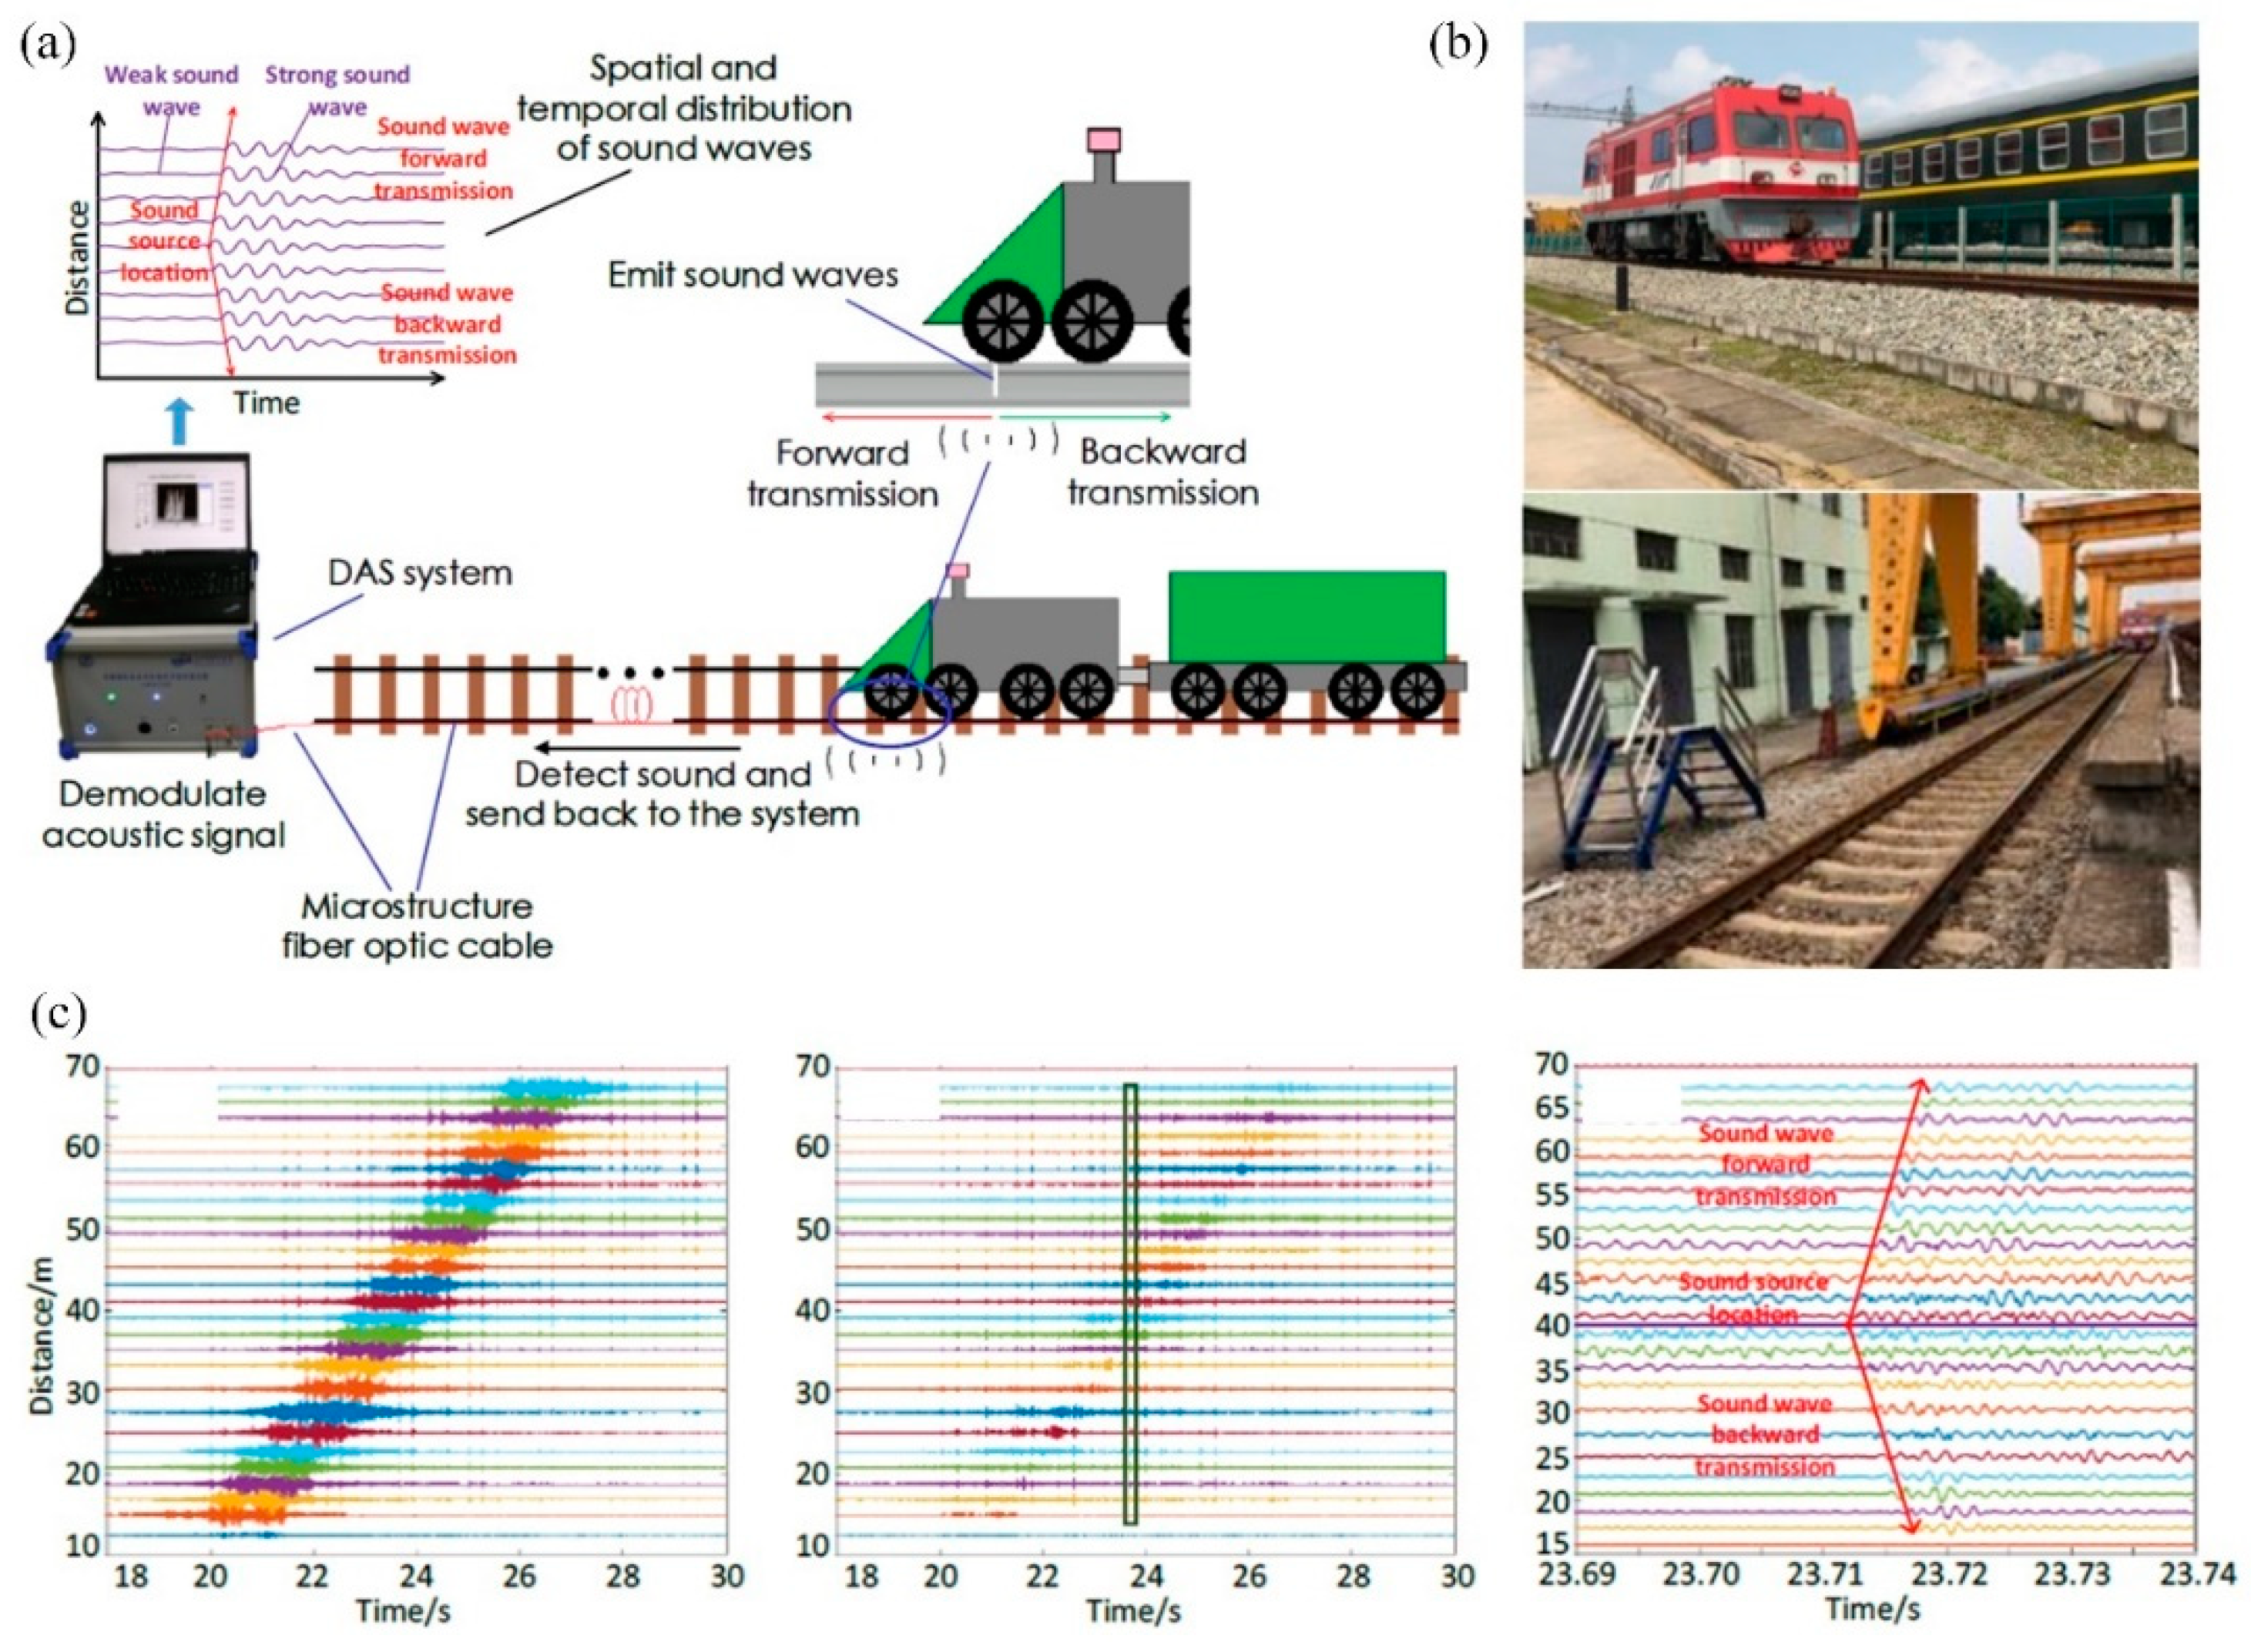
4.2.2. Track Defect Monitoring

With the development of high-speed railway technology, track defect monitoring has become more important. A variety of mature detection methods have been developed, but most of them involve electromagnetic sensors, which are vulnerable to harsh environments [80]. In 2019, Sun et al. used a DAS system based on scattering-enhanced fibers for distributed detection of a railway defect [81]. As shown in Figure 19, the scattering-enhanced fiber is set in the middle of the rail. At the position where the defect occurs, the interaction between the wheel and rail will form an impact sound signal, which is transmitted along the two directions of the track. The DAS system is used to track the transmission signal, and then the accurate positioning of the defect is identified through the positioning algorithm, the results of which show that the maximum error of the defect is only 2.1 m. This method can provide an effective and reliable solution for rail health monitoring.
Figure 19. Rail defect detection based on DAS system [80]: (a) the process of detecting and analyzing sound waves based on fiber DAS; (b) photographs of the field test environment; (c) sound distribution measured by DAS.

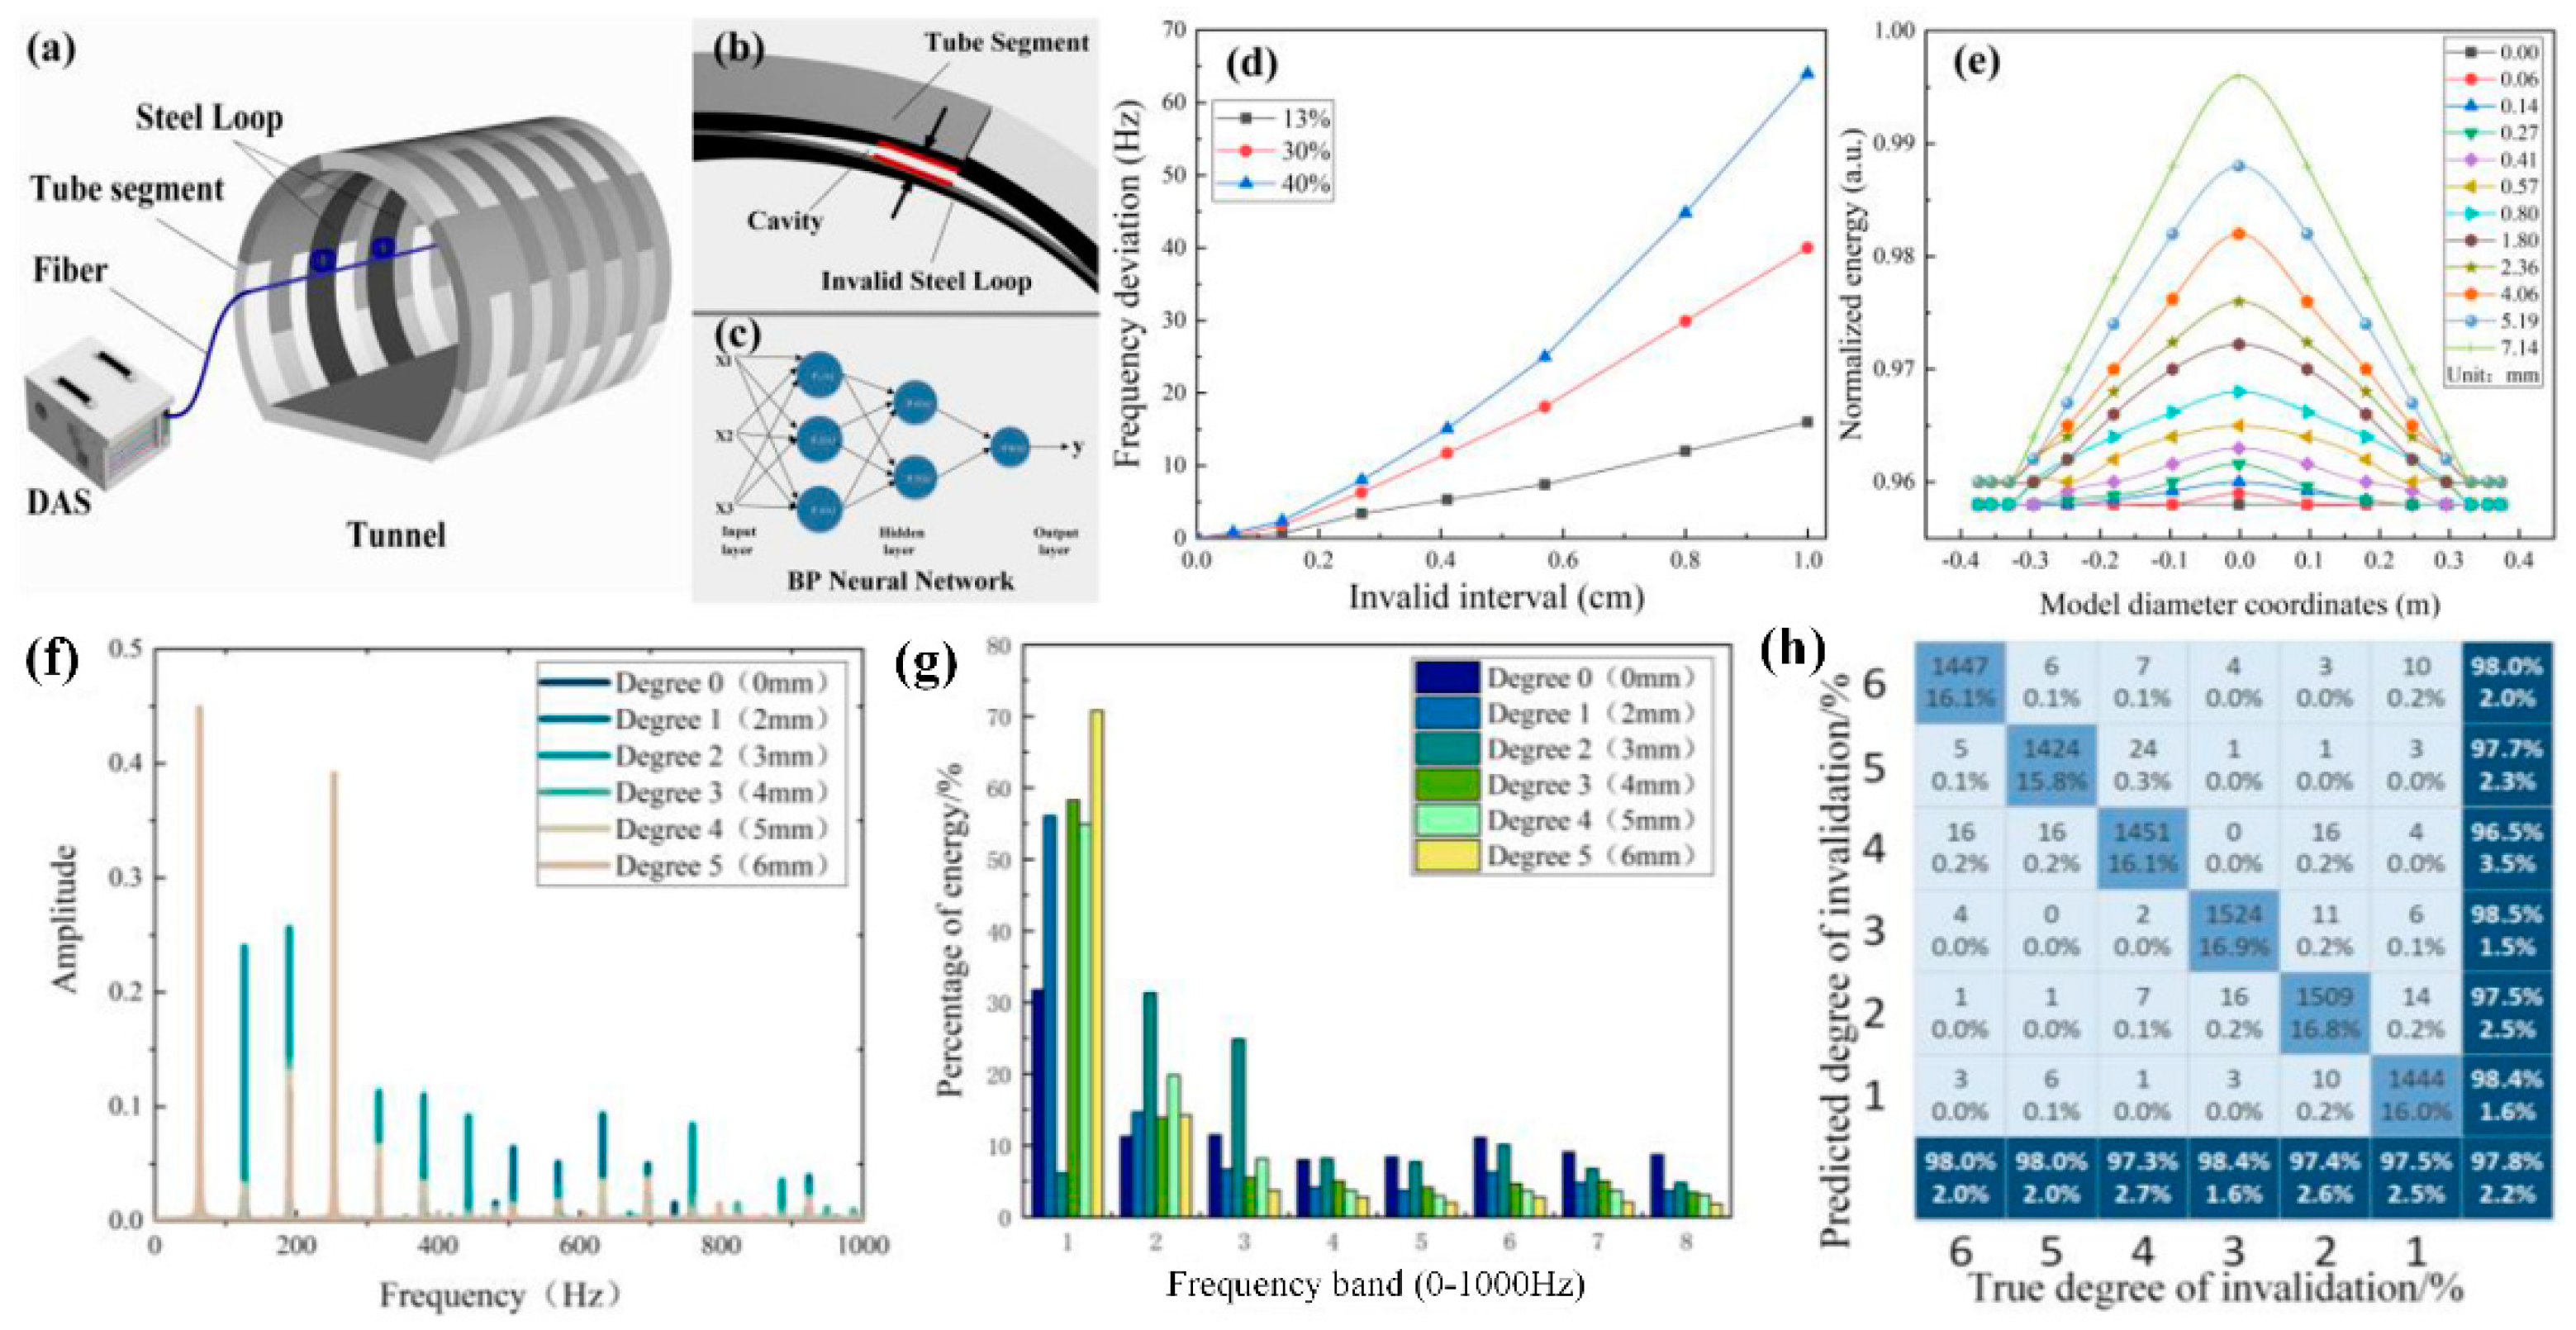
4.2.3. Tunnel Safety Monitoring

In addition, the health of infrastructure such as tunnels is related to the traffic operation safety. An optical fiber DAS system can also be used for safety detection in tunnels, such as in subways and highways. However, the effectiveness of the reinforcement segment and steel loop in the tunnel structure maybe be a problem. The partial separation of the segment and steel loop will mean the steel loop is unable to effectively support the segment, resulting in potential safety hazards. A resonant cavity will be formed between the segment and the steel loop due to the separation, with different degrees of invalidity corresponding to the different resonant frequencies. In 2021, Sun et al. carried out intelligent monitoring of a tunnel steel loop structure based on a scattering-enhanced optical fiber DAS system [81]. As shown in Figure 20, the sensing fiber is laid on the steel loop structure to obtain the resonant frequency changes induced by the active sound source. Furthermore, the machine learning algorithm based on the BP neural network is used to effectively classify different failure levels, so as to achieve the online detection of the bonding state of the reinforced steel loop. The experimental results show that the system has a recognition rate of up to 97.8%.
Figure 20. (a) Tunnel steel loop detection system based on DAS. (b) Schematic diagram of an invalid steel loop. (c) BP neural network. (d) Relationship between the degree of invalidity and the frequency deviation, (e) Relationship between the degree of invalidity and the energy distribution. (f) Power spectrum under different degrees of invalidity. (g) Wavelet energy transformation under different degrees of invalidity. (h) Recognition rate [81].

4.2.4. Geological Structural Monitoring

In recent years, DAS monitoring has been used for geological structures [82]. In 2017, a team from the University of California Berkeley transformed fiberoptic telecommunication cables into sensor arrays enabling meter-scale recording over tens of kilometers of linear fiber length to record the nearly vertically incident arrival of an earthquake from the Geysers Geothermal Field and to estimate its backazimuth and speed [83]. In 2018, Jousset et al. demonstrated the possibility of dynamic strain determination with conventional fiber cables deployed for telecommunication [84]. Then, by using DAS, they recorded seismic signals from natural and man-made sources with 4 m spacing along a 15-km-long fiber cable, identifying new dynamic fault processes with unprecedented resolution, opening a new path for earth hazard assessments and the exploration of structural features. In 2019, Sladen et al. reported measurements on a 41.5-km-long telecom cable that was deployed offshore of Toulon, France, demonstrating the capability to monitor the ocean’s solid earth interactions from the coast to the abyssal plain [85]. In the same year, Lindsey et al. reported the use of an optical fiber cable with a DAS operating onshore, creating a ~10,000-component, 20-km-long seismic array. As depicted in Figure 21, they recorded a minor earthquake wavefield, identified multiple submarine fault zones, and tracked sea-state dynamics during a storm cycle in the northern Pacific Ocean [86].
Figure 21. (a) Map of Monterey Bay, CA, showing the Monterey Accelerated Research System (MARS) cable (DAS, pink portion), mapped faults, the Gilroy earthquake (red and white beach ball), and major bathymetric features. (b) Cross-section illustration of the MARS cable used for DAS. (c) The 10 min average wave height and spectral wave density (SWD) measurements outside Monterey Bay, which were measured using a buoy. (d) Seafloor DAS strain from a 2 km cable location averaged over a 15 min sliding window. (e) North component of ground velocity from an onshore broadband inertial seismometer averaged over a 15 min sliding window [86].

4.3. Hydroacoustic Exploration

Ocean exploration is of great significance to homeland security and resource exploration. The acoustic medium can carry a wealth of information and can transmit signals for long distances underwater, so hydrophones are an important tool for underwater information acquisition. Optical fiber sensors have been preliminarily used in the field of underwater acoustic measurement due to their unique advantages. Single-point sensors and hydrophone arrays based on FBG and interferometers were common methods used for early optical fiber hydrophones. However, due to the limited multiplexing capacity, it is difficult to meet the requirements for large-scale exploration in the ocean and other application environments. In recent years, the DAS system has been well applied in the field of terrestrial acoustic detection. Because of its distributed, long-distance, and high-sensitivity characteristics, the DAS system has been introduced into the field of hydrophones. In the preliminary stage, researchers measured the underwater acoustic sensitivity and other parameters of an optical fiber in the laboratory. Usually, a distributed underwater acoustic sensing system is built based on a UWFBG array and unbalanced interferometer demodulation structure [54,87]. The underwater acoustic signal is obtained by demodulating the change in phase difference between two adjacent UWFBGs, in which the sensitivity obtained usually reaches about −160~−150 dB re rad/μPa.
In 2021, Sun et al. designed a lightweight and fully distributed hydroacoustic optical sensing cable [88]. An acoustic sensitizing layer is superimposed on the inner core layer, the microstructure scattering-enhanced fiber is wound on the sensitizing layer, and a further protective layer is added to the outermost layer. As depicted in Figure 22, the coherent detection system has been utilized to conduct experiments, with the results showing that the hydroacoustic detection sensitivity is as high as −127 dB re rad/μPa with a flat frequency response range of 100–2000 Hz. Furthermore, the team conducted an on-site lake test, the results of which are depicted in Figure 23.
Figure 22. (a) Fully distributed underwater acoustic sensor system. (b) Lightweight fully distributed underwater acoustic fiberoptic cable based on scattering-enhanced fiber. (c) The relationship between the phase demodulation change and acoustic pressure. (d) The frequency response curve within the frequency range of 100–2000 Hz [88].
Figure 23. The underwater acoustic test: (a) the setup for the field test; (b) picture of the sensitized optical cable; (c) the static test results for the sound source; (d) motion trajectory tracking of the sound source.

5. Conclusions and Prospects

The variability and functionality of specialty optical fibers have demonstrated their major potential for sensing performance enhancement and application development for DAS systems. In this review, the scattering characteristics and noise suppression principles of specialty optical fibers are analyzed, and the fabrication technologies used for DSE are introduced. Based on the discrete scattering-enhanced fiber, the performance enhancement technologies of the DAS system are summarized, including the low-frequency phase noise compensation, polarization fading suppression, pulse width compression, and system sampling rate expansion. Further, due to the unique advantages of the scattering-enhanced fiber, the DAS system has been widely applied in various fields, such as in resource exploration, structural health monitoring, and for distributed hydrophones. Looking to the future, the research on the specialty-fiber based DAS will develop rapidly for many aspects, such as the doping of new materials for high sensitization, the development of fabrication techniques for higher efficiency, the introduction of AI techniques for higher measurement accuracy, and the exploration of wider application fields. Owing to the distinct advantages, it is believed that the specialty-fiber-based DAS system will have bright market prospects in geological, resource, and hydroacoustic exploration, as well as structural health monitoring.

Author Contributions

Conceptualization, Q.S. and Z.Y.; methodology, H.L. and C.F.; formal analysis, Y.S. and J.C.; investigation, B.Y.; writing—original draft preparation, Y.S.; writing—review and editing, Y.S.; funding acquisition, Q.S. All authors have read and agreed to the published version of the manuscript.

Funding

This research was supported by National Natural Science Foundation for Distinguished Young Scholars through Grant No. 61922033; the Marine economic development project of Guangdong Province through Grant No. GDNRC 2020(045); the National Natural Science Foundation of China through Grant No. 61775072; and the Innovation Fund of WNLO.

Institutional Review Board Statement

Not applicable.

Informed Consent Statement

Not applicable.

Data Availability Statement

Not applicable.

Conflicts of Interest

The authors declare no conflict of interest.

References

  1. Yatman, G.; Üzumcü, S.; Pahsa, A.; Mert, A.A. Intrusion detection sensors used by electronic security systems for critical facilities and infrastructures: A review. Safe 2015, 151, 131–141. [Google Scholar] [CrossRef] [Green Version]
  2. Shelef, E.; Oskin, M. Deformation processes adjacent to active faults: Examples from eastern California. J. Geophys. Res. Earth Surf. 2010, 115. [Google Scholar] [CrossRef] [Green Version]
  3. Mu, D.; Lee, E.J.; Chen, P. Seismic Imaging, Fault Damage and Heal; De Gruyter: Berlin, Germany, 2014; ISBN 9787040390988. [Google Scholar]
  4. Thun, J.; Lokmer, I.; Bean, C.; Eibl, E.; Bergsson, B.H.; Braiden, A. Micrometre-scale deformation observations reveal fundamental controls on geological rifting. Sci. Rep. 2016, 6, 36676. [Google Scholar] [CrossRef] [PubMed] [Green Version]
  5. Hartog, A.; Frignet, B.; Mackie, D.; Clark, M. Vertical seismic optical profiling on wireline logging cable. Geophys. Prospect. 2014, 62, 693–701. [Google Scholar] [CrossRef]
  6. Tejedor, J.; Ahlen, C.H.; Gonzalez-Herraez, M.; Macias-Guarasa, J.; Martins, H.F.; Pastor-Graells, J.; Martin-Lopez, S.; Guillen, P.C.; De Pauw, G.; De Smet, F.; et al. Real Field Deployment of a Smart Fiber-Optic Surveillance System for Pipeline Integrity Threat Detection: Architectural Issues and Blind Field Test Results. J. Light. Technol. 2017, 36, 1052–1062. [Google Scholar] [CrossRef]
  7. Lyu, C.; Huo, Z.; Cheng, X.; Jiang, J.; Alimasi, A.; Liu, H. Distributed Optical Fiber Sensing Intrusion Pattern Recognition Based on GAF and CNN. J. Light. Technol. 2020, 38, 4174–4182. [Google Scholar] [CrossRef]
  8. Masoudi, A.; Belal, M.; Newson, T.P. A distributed optical fibre dynamic strain sensor based on phase-OTDR. Meas. Sci. Technol. 2013, 24, 085204. [Google Scholar] [CrossRef]
  9. Zhou, L.; Wang, F.; Wang, X.; Pan, Y.; Sun, Z.; Hua, J.; Zhang, X. Distributed Strain and Vibration Sensing System Based on Phase-Sensitive OTDR. IEEE Photon. Technol. Lett. 2015, 27, 1884–1887. [Google Scholar] [CrossRef]
  10. Gabai, H.; Eyal, A. On the sensitivity of distributed acoustic sensing. Opt. Lett. 2016, 41, 5648–5651. [Google Scholar] [CrossRef]
  11. Healey, P. Fading in heterodyne OTDR. Electron. Lett. 1984, 20, 30–32. [Google Scholar] [CrossRef]
  12. Zabihi, M.; Chen, Y.; Zhou, T.; Liu, J.; Shan, Y.; Meng, Z.; Wang, F.; Zhang, Y.; Zhang, X.; Chen, M. Continuous Fading Suppression Method for Φ-OTDR Systems Using Optimum Tracking Over Multiple Probe Frequencies. J. Light. Technol. 2019, 37, 3602–3610. [Google Scholar] [CrossRef]
  13. Zhou, J.; Pan, Z.; Ye, Q.; Cai, H.; Qu, R.; Fang, Z. Characteristics and Explanations of Interference Fading of a Φ-OTDR With a Multi-Frequency Source. J. Light. Technol. 2013, 31, 2947–2954. [Google Scholar] [CrossRef]
  14. Ren, M.; Lu, P.; Chen, L.; Bao, X. Theoretical and Experimental Analysis of O-OTDR Based on Polarization Diversity Detection. IEEE Photon. Technol. Lett. 2015, 28, 697–700. [Google Scholar] [CrossRef]
  15. Mompo, J.J.; Shiloh, L.; Arbel, N.; Levanon, N.; Loayssa, A.; Eyal, A. Distributed Dynamic Strain Sensing via Perfect Periodic Coherent Codes and a Polarization Diversity Receiver. J. Light. Technol. 2019, 37, 4597–4602. [Google Scholar] [CrossRef]
  16. Wang, F.; Liu, Y.; Wei, T.; Zhang, Y.; Ji, W.; Zong, M.; Zhang, X. Polarization fading elimination for ultra-weak FBG array-based Φ-OTDR using a composite double probe pulse approach. Opt. Express 2019, 27, 20468–20478. [Google Scholar] [CrossRef]
  17. Qin, Z.; Zhu, T.; Chen, L.; Bao, X. High Sensitivity Distributed Vibration Sensor Based on Polarization-Maintaining Configurations of Phase-OTDR. IEEE Photon. Technol. Lett. 2011, 23, 1091–1093. [Google Scholar] [CrossRef]
  18. He, X.; Zhang, M.; Gu, L.; Xie, S.; Liu, F.; Lu, H. Performance Improvement of Dual-Pulse Heterodyne Distributed Acoustic Sensor for Sound Detection. Sensors 2020, 20, 999. [Google Scholar] [CrossRef] [Green Version]
  19. Juarez, J.C.; Maier, E.W.; Choi, K.N.; Taylor, H.F. Distributed fiber-optic intrusion sensor system. J. Lightwave Technol. 2005, 23, 2081–2087. [Google Scholar] [CrossRef]
  20. Rao, Y.-J.; Luo, J.; Ran, Z.-L.; Yue, J.-F.; Luo, X.-D.; Zhou, Z. Long-distance fiber-optic Φ-OTDR intrusion sensing system. In Proceedings of the Spie the International Society for Optical Engineering, San Diego, CA, USA, 3–4 August 2009; Volume 7503, p. 75031O. [Google Scholar] [CrossRef]
  21. Juarez, J.C.; Taylor, H.F. Polarization discrimination in a phase-sensitive optical time-domain reflectometer intrusion-sensor system. Opt. Lett. 2005, 30, 3284–3286. [Google Scholar] [CrossRef]
  22. Pan, Z.; Liang, K.; Ye, Q.; Cai, H.; Qu, R.; Fa Ng, Z. Phase-sensitive OTDR system based on digital coherent detection. In Proceedings of the SPIE Proceedings (SPIE SPIE/OSA/IEEE Asia Communications and Photonics-Shanghai, China), Shanghai China, 13–16 November 2011; Volume 8311, p. 83110S-2. [Google Scholar] [CrossRef]
  23. Zhang, X.; Sun, Z.; Shan, Y.; Li, Y.; Wang, F.; Zeng, J.; Zhang, Y. A high performance distributed optical fiber sensor based on Φ-OTDR for dynamic strain measurement. IEEE Photon. J. 2017, 9, 1–12. [Google Scholar] [CrossRef]
  24. Fang, G.; Xu, T.; Feng, S.; Li, F. Phase-Sensitive Optical Time Domain Reflectometer Based on Phase-Generated Carrier Algorithm. J. Light. Technol. 2015, 33, 2811–2816. [Google Scholar] [CrossRef]
  25. Chen, D.; Liu, Q.; Fan, X.; He, Z. Distributed Fiber-Optic Acoustic Sensor with Enhanced Response Bandwidth and High Signal-to-Noise Ratio. J. Light. Technol. 2017, 35, 2037–2043. [Google Scholar] [CrossRef]
  26. Liokumovich, L.; Ushakov, N.; Kotov, O.; Bisyarin, M.; Hartog, A.H. Fundamentals of Optical Fiber Sensing Schemes Based on Coherent Optical Time Domain Reflectometry: Signal Model Under Static Fiber Conditions. J. Light. Technol. 2015, 33, 3660–3671. [Google Scholar] [CrossRef]
  27. Zhang, J.; Wu, H.; Zheng, H.; Huang, J.; Yin, G.; Zhu, T.; Qiu, F.; Huang, X.; Qu, D.; Bai, Y.; et al. 80 km Fading Free Phase-Sensitive Reflectometry Based on Multi-Carrier NLFM Pulse Without Distributed Amplification. J. Light. Technol. 2019, 37, 4748–4754. [Google Scholar] [CrossRef]
  28. Li, H.; Liu, Y.; He, T.; Fan, C.; Liu, T.; Yan, Z.; Liu, D.; Sun, Q. Dual-pulse Complex Superposition Based Noise Suppression for Distributed Acoustic Sensing. In Proceedings of the CLEO: Applications and Technology, Washington, DC, USA, 10–15 May 2020; p. JW2E.28. [Google Scholar] [CrossRef]
  29. Ai, F.; Sun, Q.; Zhang, W.; Liu, T.; Yan, Z.; Liu, D. Wideband Fully-Distributed Vibration Sensing by Using UWFBG Based Coherent OTDR. In Proceedings of the Optical Fiber Communications Conference & Exhibition, Los Angeles, CA, USA, 19–23 March 2017; p. W2A.19. [Google Scholar] [CrossRef]
  30. Lin, S.T.; Wang, Z.N.; Xiong, J.; Wu, Y.; Rao, Y.J. Progresses of Anti-Interference-Fading Technologies for Ray-leigh-Scattering-Based Optical Fiber Sensing. Laser Optoelectron. Prog. 2021, 58, 1306008. [Google Scholar] [CrossRef]
  31. Westbrook, P.S.; Feder, K.S.; Ortiz, R.M.; Kremp, T.; Monberg, E.M.; Wu, H.; Simoff, D.A.; Shenk, S. Kilometer length low loss enhanced back scattering fiber for distributed sensing. In Proceedings of the 25th International Conference on Optical Fiber Sensors, Jeju, Korea, 24–28 April 2017; pp. 1–5. [Google Scholar] [CrossRef]
  32. Handerek, V.A.; Karimi, M.; Nkansah, A.; Yau, A.; Westbrook, P.S.; Feder, K.S.; Ortiz, R.M.; Kremp, T.; Monberg, E.M.; Wu, H.; et al. Improved Optical Power Budget in Distributed Acoustic Sensing Using Enhanced Scattering Optical Fibre. In Proceedings of the 26th International Conference on Optical Fiber Sensors, Vaud, Switzerland, 24–28 September 2018; p. TuC5. [Google Scholar] [CrossRef]
  33. Westbrook, P.S.; Kremp, T.; Feder, K.S.; Ko, W.; Monberg, E.M.; Wu, H.; Simoff, D.A.; Ortiz, R.M. Improving distributed sensing with continuous gratings in single and multi-core fibers. In Proceedings of the Optical Fiber Communication Conference, San Diego, CA, USA, 11–15 March 2018; p. W1K.1. [Google Scholar] [CrossRef]
  34. Lalam, N.; Westbrook, P.S.; Li, J.; Lu, P.; Buric, M.P. Phase-Sensitive Optical Time Domain Reflectometry with Rayleigh Enhanced Optical Fiber. IEEE Access 2021, 9, 114428–114434. [Google Scholar] [CrossRef]
  35. Butov, O.V.; Chamorovskii, Y.K.; Golant, K.M.; Fotiadi, A.A.; Jason, J.; Popov, S.M.; Wuilpart, M. Sensitivity of high Rayleigh scattering fiber in acoustic/vibration sensing using phase-OTDR. In Proceedings of the Optical Sensing and Detection V, Strasbourg, France, 9 May 2018. [Google Scholar] [CrossRef]
  36. Feng, S.; Xu, T.; Huang, J.; Yang, Y.; Li, F.; Zhou, J.; Yu, H. Enhanced SNR phase-sensitive OTDR system with active fiber. In Proceedings of the Fiber Optic Sensing and Optical Communication, Beijing, China, 12 December 2018. [Google Scholar] [CrossRef]
  37. Huang, J.B.; Ding, P.; Tang, J.S. Progress in Fabrication, Demodulation and Application of Weak-Reflection Fiber Bragg Grating Array. Laser Optoelectron. Prog. 2021, 58, 1700005. [Google Scholar] [CrossRef]
  38. Wu, M.; Fan, X.; Zhang, X.; Yan, L.; He, Z. Frequency Response Enhancement of Phase-Sensitive OTDR for Interrogating Weak Reflector Array by Using OFDM and Vernier Effect. J. Light. Technol. 2020, 38, 4874–4882. [Google Scholar] [CrossRef]
  39. Hicke, K.; Eisermann, R.; Chruscicki, S. Enhanced Distributed Fiber Optic Vibration Sensing and Simultaneous Temperature Gradient Sensing Using Traditional C-OTDR and Structured Fiber with Scattering Dots. Sensors 2019, 19, 4114. [Google Scholar] [CrossRef] [Green Version]
  40. Redding, B.; Murray, M.J.; Donko, A.; Beresna, M.; Masoudi, A.; Brambilla, G. Low-noise distributed acoustic sensing using enhanced backscattering fiber with ultra-low-loss point reflectors. Opt. Express 2020, 28, 14638–14647. [Google Scholar] [CrossRef]
  41. Hill, K.O.; Fujii, Y.; Johnson, D.C.; Kawasaki, B.S. Photosensitivity in optical fiber waveguides: Application to reflection filter fabrication. Appl. Phys. Lett. 1978, 32, 647–649. [Google Scholar] [CrossRef]
  42. Meltz, G.; Morey, W.W.; Glenn, W.H. Formation of Bragg gratings in optical fibers by a transverse holographic method. Opt. Lett. 1989, 14, 823–825. [Google Scholar] [CrossRef] [PubMed]
  43. Zheng, Y.; Yu, H.; Guo, H.; Li, X.; Jiang, D. Analysis of the Spectrum Distortions of Weak Fiber Bragg Gratings Fabricated In-Line on a Draw Tower by the Phase Mask Technique. J. Light. Technol. 2014, 33, 2670–2673. [Google Scholar] [CrossRef]
  44. Martinez, A.; Dubov, M.; Khrushchev, I.; Bennion, I. Direct writing of fibre Bragg gratings by femtosecond laser. Electron. Lett. 2004, 40, 1170–1172. [Google Scholar] [CrossRef]
  45. Chen, Z.; He, J.; Xu, X.; He, J.; Xu, B.; Du, B.; Liao, C.; Wang, Y. High-Temperature Sensor Array Based on Fiber Bragg Gratings Fabricated by Femtosecond Laser Point-by-Point Method. Acta Opt. Sin. 2021, 41, 1306002. [Google Scholar] [CrossRef]
  46. Yang, M.; Bai, W.; Guo, H.; Wen, H.; Yu, H.; Jiang, D. Huge capacity fiber-optic sensing network based on ultra-weak draw tower gratings. Photon. Sens. 2016, 6, 26–41. [Google Scholar] [CrossRef] [Green Version]
  47. Tang, J.; Cai, L.; Li, C.; Yang, M.; Guo, H.; Gan, W. Distributed acoustic sensors with wide frequency response based on UWFBG array utilizing dual-pulse detection. Opt. Fiber Technol. 2021, 61, 102452. [Google Scholar] [CrossRef]
  48. Ai, F.; Li, H.; He, T.; Yan, Z.; Liu, D.; Sun, Q. Simultaneous Distributed Temperature and Vibration Measurement with UWFBG based Coherent OTDR. In Proceedings of the Optical Fiber Communication Conference, San Diego, CA, USA, 11–15 March 2018; p. W2A.12. [Google Scholar] [CrossRef]
  49. Yang, M.; Li, C.; Mei, Z.; Tang, J.; Guo, H.; Jiang, D. Thousand of fiber grating sensor array based on draw tower: A new platform for fiber-optic sensing. In Proceedings of the Optical Fiber Sensors, OFS 2018, Lausanne, Switzerland, 24–28 September 2018; p. FB6. [Google Scholar] [CrossRef] [Green Version]
  50. Peng, Z.; Jian, J.; Wen, H.; Wang, M.; Liu, H.; Jiang, D.; Mao, Z.; Chen, K.P. Fiber-optical distributed acoustic sensing signal enhancements using ultrafast laser and artificial intelligence for human movement detection and pipeline monitoring. Opt. Data Sci. II 2019, 10937, 109370J. [Google Scholar] [CrossRef]
  51. Liu, D.M.; He, T.; Xu, Z.J.; Sun, Q. New type of microstructure-fiber distributed acoustic sensing technology and its applications. J. Appl. Sci. 2020, 38, 296–309. [Google Scholar] [CrossRef]
  52. Ai, F. Investigation on Discrete Enhanced Fiber Based Distributed Sensing Technologies and Their Applications. Ph.D. Thesis, Huazhong University of Science and Technology, Wuhan, China, 2019. [Google Scholar]
  53. Li, H.; Sun, Q.; Liu, T.; Fan, C.; He, T.; Yan, Z.; Liu, D.; Shum, P.P. Ultra-High Sensitive Quasi-Distributed Acoustic Sensor Based on Coherent OTDR and Cylindrical Transducer. J. Light. Technol. 2019, 38, 929–938. [Google Scholar] [CrossRef]
  54. Wu, M.; Li, C.; Fan, X.; Liao, C.; He, Z. Large-scale multiplexed weak reflector array fabricated with a femtosecond laser for a fiber-optic quasi-distributed acoustic sensing system. Opt. Lett. 2020, 45, 3685. [Google Scholar] [CrossRef] [PubMed]
  55. Wang, C.; Shang, Y.; Liu, X.-H.; Wang, C.; Yu, H.-H.; Jiang, D.-S.; Peng, G.-D. Distributed OTDR-interferometric sensing network with identical ultra-weak fiber Bragg gratings. Opt. Express 2015, 23, 29038–29046. [Google Scholar] [CrossRef] [PubMed]
  56. Jiang, P.; Ma, L.; Wang, W.; Hu, Z.; Hu, Y. Crosstalk Reduction and Demodulation Stability Promotion in Inline Fiber Fabry–Pérot Sensor Array Using Phase Generated Carrier Scheme. J. Light. Technol. 2015, 34, 1006–1014. [Google Scholar] [CrossRef]
  57. Peng, Z.; Wen, H.; Jian, J.; Gribok, A.; Wang, M.; Huang, S.; Liu, H.; Mao, Z.-H.; Chen, K.P. Identifications and classifications of human locomotion using Rayleigh-enhanced distributed fiber acoustic sensors with deep neural networks. Sci. Rep. 2020, 10, 21014. [Google Scholar] [CrossRef] [PubMed]
  58. Tang, J.; Liu, Y.; Li, C.; Guo, H.; Yang, M. Distributed Vibration Sensing System with High Signal-to-Noise Ratio Based on Ultra-Weak Fiber Bragg Grating. Acta Opt. Sin. 2021, 41, 1306014. [Google Scholar] [CrossRef]
  59. Fan, X.; Yang, G.; Wang, S.; Liu, Q.; He, Z. Distributed Fiber-Optic Vibration Sensing Based on Phase Extraction from Optical Reflectometry. J. Light. Technol. 2016, 35, 3281–3288. [Google Scholar] [CrossRef]
  60. Wu, M.; Fan, X.; Liu, Q.; He, Z. Highly sensitive quasi-distributed fiber-optic acoustic sensing system by interrogating a weak reflector array. Opt. Lett. 2018, 43, 3594–3597. [Google Scholar] [CrossRef] [PubMed]
  61. Wu, M.; Fan, X.; Liu, Q.; He, Z. Quasi-distributed Fiber-optic Acoustic Sensor using Ultra-weak Reflecting Point Array. In Proceedings of the 26th International Conference on Optical Fiber Sensors, Vaud, Switzerland, 24–28 September 2018; p. WF19. [Google Scholar] [CrossRef]
  62. Liu, T.; Li, H.; Ai, F.; Wang, J.; Fan, C.; Luo, Y.; Yan, Z.; Liu, D.; Sun, Q. Ultra-high Resolution Distributed Strain Sensing based on Phase-OTDR. In Proceedings of the Optical Fiber Communication Conference (OFC), San Diego, CA, USA, 3–7 March 2019; p. Th2A.16. [Google Scholar] [CrossRef]
  63. He, T.; Liu, Y.; Zhang, S.; Yan, Z.; Liu, D.; Sun, Q. High Accuracy Intrusion Pattern Recognition using a Dual-Stage-Recognition Network for Fiber Optic Distributed Sensing System. In Proceedings of the Conference on Lasers and Electro-Optics, Munich, Germany, 21–25 June 2021; p. JW1A.119. [Google Scholar] [CrossRef]
  64. Liu, Y.; Wang, F.; Zhang, X.; Zhang, Y.; Xu, W.; Zhang, L. High performance interrogation by a composite-double-probe-pulse for ultra-weak FBG array. In Proceedings of the 17th International Conference on Optical Communications and Networks (ICOCN2018), International Society for Optics and Photonics. Bellingham, WA, USA, 14 February 2019. [Google Scholar] [CrossRef] [Green Version]
  65. Liu, Y.; Li, H.; Liu, T.; Fan, C.; Yan, Z.; Liu, D.; Sun, Q. Polarization dependent noise suppression for fiber distributed acoustic sensor with birefringence estimation. In Proceedings of the Conference on Lasers and Electro-Optics: Applications and Technology, Washington, DC, USA, 10–15 May 2020; p. JW2E.18. [Google Scholar] [CrossRef]
  66. Liu, T.; Li, H.; He, T.; Fan, C.; Yan, Z.; Liu, D.; Sun, Q. Fading Noise Free Distributed Acoustic Sensor Assisted with Double Wavelength lasers. In Proceedings of the Conference on Lasers and Electro-Optics: Applications and Technology, Anaheim, CA, USA, 23–25 October 2020; p. JW2E.10. [Google Scholar] [CrossRef]
  67. Liu, Z.; Chen, D.W.; Xia, X.X.; Wang, G.Y.; Wang, X.S. A countering technique for LFM PC radar against shift-frequency jamming. Mod. Radar 2006, 28, 84–86. [Google Scholar] [CrossRef]
  68. Zhou, Y.; Wang, C.; Wei, T.; Shangguan, M.; Xia, H. Simulation Research of Coherent Lidar Based on Golay Coding Technology. Chin. J. Lasers 2018, 45, 0810004. [Google Scholar] [CrossRef] [Green Version]
  69. Jiang, J.; Xiong, J.; Wang, Z.; Qiu, Z.; Liu, C.; Deng, Z.; Rao, Y.-J. Quasi-Distributed Fiber-Optic Acoustic Sensing with MIMO Technology. IEEE Internet Things J. 2021, 8, 15284–15291. [Google Scholar] [CrossRef]
  70. Wu, M.; Fan, X.; He, Z. Phase Noise Compensation for Ultra-highly Sensitive Fiber-optic Quasi-distributed Acoustic Sensing System. In Proceedings of the Conference on Lasers and Electro-Optics: Science and Innovations, San Jose, CA, USA, 5–10 May 2019. [Google Scholar] [CrossRef]
  71. Wu, M.; Fan, X.; Liu, Q.; He, Z. Quasi-distributed fiber-optic acoustic sensing system based on pulse compression technique and phase-noise compensation. Opt. Lett. 2019, 44, 5969–5972. [Google Scholar] [CrossRef] [PubMed]
  72. Wang, Z.T.; Jiang, J.L.; Xiong, J.; Wang, Z.N. Fiber-optic Quasi-distributed Acoustic Sensing System at Doubled Repetition Rate. In Proceedings of the Asia Communications and Photonics Conference (ACP), Chengdu, China, 2–5 November 2019; OSA Technical Digest (Optica Publishing Group). 2019; p. M4A.183. [Google Scholar]
  73. Zhang, Y.X.; Fu, S.Y.; Chen, Y.S.; Ding, Z.W.; Shan, Y.Y.; Wang, F.; Chen, M.M.; Zhang, X.P.; Meng, Z. A visibility enhanced broadband phase-sensitive OTDR based on the UWFBG array and frequency-division-multiplexing. Opt. Fiber Technol. 2019, 53, 101995. [Google Scholar] [CrossRef]
  74. Li, H.; Fan, C.; Liu, T.; Liu, Y.; Yan, Z.; Shum, P.; Sun, Q. Time-slot multiplexing based bandwidth enhancement for fiber distributed acoustic sensing. Sci. China Inf. Sci. 2021, 65, 119303. [Google Scholar] [CrossRef]
  75. Li, Y.P.; Karrenbach, M.; Ajo, J. Distributed Acoustic Sensing in Geophysics: Methods and Applications; American Geophysical Union: Washington, DC, USA, 2022. [Google Scholar]
  76. Li, C.; Mei, Z.; Cheng, C.; Tang, J.; Jiang, Y.; Yang, M. Draw Tower Grating-based Distributed Acoustic Sensing System and its Applications. In Proceedings of the Asia Communications and Photonics Conference, Chengdu, China, 2–5 November 2019; p. T2A.5. [Google Scholar] [CrossRef]
  77. Li, T.; Fan, C.; Li, H.; He, T.; Qiao, W.; Shi, Z.; Yan, Z.; Liu, C.; Liu, D.; Sun, Q. Nonintrusive Distributed Flow Rate Sensing System Based on Flow-Induced Vibrations Detection. IEEE Trans. Instrum. Meas. 2021, 70, 7001808. [Google Scholar] [CrossRef]
  78. Jiang, J.; Liu, F.; Wang, H.; Li, S.; Gan, W.; Jiang, R. Lateral positioning of vibration source for underground pipeline monitoring based on ultra-weak fiber Bragg grating sensing array. Measurement 2020, 172, 108892. [Google Scholar] [CrossRef]
  79. Peng, Z.; Jian, J.; Wen, H.; Gribok, A.; Wang, M.; Liu, H.; Huang, S.; Mao, Z.-H.; Chen, K. Distributed Fiber Sensor and Machine Learning Data Analytics for Pipeline Protection against Extrinsic Intrusions and Intrinsic Corrosions. Opt. Express 2020, 28, 27277–27292. [Google Scholar] [CrossRef]
  80. Fan, C.; Ai, F.; Liu, Y.; Xu, Z.; Wu, G.; Zhang, W.; Liu, C.; Yan, Z.; Liu, D.; Sun, Q. Rail Crack Detection by Analyzing the Acoustic Transmission Process Based on Fiber Distributed Acoustic Sensor. In Proceedings of the Optical Fiber Communication Conference, San Diego, CA, USA, 3–7 March 2019; p. Th2A.17. [Google Scholar] [CrossRef]
  81. Hu, D.; Tian, B.; Li, H.; Fan, C.; Liu, T.; He, T.; Liu, Y.; Yan, Z.; Sun, Q. Intelligent Structure Monitoring for Tunnel Steel Loop Based on Distributed Acoustic Sensing. In Proceedings of the Conference on Lasers and Electro-Optics, Munich, Germany, 21–25 June 2021; p. ATh1S.4. [Google Scholar] [CrossRef]
  82. Min, R.; Liu, Z.; Pereira, L.; Yang, C.; Sui, Q.; Marques, C. Optical fiber sensing for marine environment and marine structural health monitoring: A review. Opt. Laser Technol. 2021, 140, 107082. [Google Scholar] [CrossRef]
  83. Lindsey, N.J.; Martin, E.R.; Dreger, D.S.; Freifeld, B.; Cole, S.; James, S.R.; Biondi, B.L.; Ajo-Franklin, J.B. Fiber-Optic Network Observations of Earthquake Wavefields. Geophys. Res. Lett. 2017, 44, 11792–11799. [Google Scholar] [CrossRef] [Green Version]
  84. Jousset, P.; Reinsch, T.; Ryberg, T.; Blanck, H.; Clarke, A.; Aghayev, R.; Hersir, G.P.; Henninges, J.; Weber, M.; Krawczyk, C.M. Dynamic strain determination using fibre-optic cables allows imaging of seismological and structural features. Nat. Commun. 2018, 9, 2509. [Google Scholar] [CrossRef]
  85. Sladen, A.; Rivet, D.; Ampuero, J.P.; De Barros, L.; Hello, Y.; Calbris, G.; Lamare, P. Distributed sensing of earthquakes and ocean-solid Earth interactions on seafloor telecom cables. Nat. Commun. 2019, 10, 5777. [Google Scholar] [CrossRef] [Green Version]
  86. Lindsey, N.J.; Dawe, T.C.; Ajo-Franklin, J.B. Illuminating seafloor faults and ocean dynamics with dark fiber distributed acoustic sensing. Science 2019, 366, 1103–1107. [Google Scholar] [CrossRef] [PubMed]
  87. Zhou, C.; Pang, Y.; Qian, L.; Chen, X.; Xu, Q.; Zhao, C.; Zhang, H.; Tu, Z.; Huang, J.; Gu, H.; et al. Demodulation of a Hydroacoustic Sensor Array of Fiber Interferometers Based on Ultra-Weak Fiber Bragg Grating Reflectors Using a Self-Referencing Signal. J. Light. Technol. 2018, 37, 2568–2576. [Google Scholar] [CrossRef]
  88. Chen, J.F.; Li, H.; Liu, T.; Fan, C.Z.; Yan, Z.J.; Sun, Q.Z. Fully distributed hydroacoustic sensing based on lightweight optical cable assisted with scattering enhanced fiber. In Proceedings of the Optical Fiber Communication Conference (OFC), Washington, DC, USA, 6–11 June 2021; p. W7C.3. [Google Scholar] [CrossRef]
Figure 1. The sensing principle of the fiberoptic DAS.
Photonics 09 00277 g001
Figure 2. Typical heterodyne coherent detection scheme [22].
Photonics 09 00277 g002
Figure 3. Rayleigh scattering model of the single-mode optical fiber [26].
Photonics 09 00277 g003
Figure 4. Schematic diagram of equivalent scattering positions in pulse interference.
Photonics 09 00277 g004
Figure 5. Typical scheme of continuous scattering-enhanced optical fiber [33,36]: (a) the backscattering signal distribution of a typical continuous scattering-enhanced fiber; (b) scheme of improved Rayleigh scattering achieved by changing the fiber doping; (c) scattering spectrum of high Rayleigh scattering fiber.
Photonics 09 00277 g005
Figure 6. Schematic diagram of discrete scattering-enhanced fiber.
Photonics 09 00277 g006
Figure 7. Simulation results of discrete enhanced scattering model: (a) reflection distribution of discrete enhanced fiber; (b) reflection distribution of single mode fiber; (c) phase demodulation result.
Photonics 09 00277 g007
Figure 8. Typical UWFBG preparation method: (a) online UWFBG preparation system [46]; (b) OTDR measurement results of the UWFBG array [47]; (c) reflection spectrum of UWFBG [46].
Photonics 09 00277 g008
Figure 9. Preparation method for a colorless microstructure array based on UV exposure: (a) automatic colorless microstructure preparation system [51]; (b) OTDR measurement results of colorless microstructure array [53]; (c) spectra of colorless microstructure arrays [51]; (d) temperature stability of colorless microstructure arrays [53].
Photonics 09 00277 g009
Figure 10. Preparation method for a weak reflection array based on a femtosecond laser [40]: (a) weak reflection array preparation system; (b) schematic diagram of weak reflection array preparation method; (c) OTDR measurement results for the weak reflection array; (d) the result of a cut-back measurement on a separate fiber containing 300 reflectors.
Photonics 09 00277 g010
Figure 11. Representative DAS scheme based on UWFBG: (a) scheme using a 3 × 3 coupler [54]; (b) PGC scheme [55]; (c) heterodyne coherent detection scheme [29].
Photonics 09 00277 g011
Figure 12. Representative scheme for low-frequency noise suppression: (a) auxiliary interferometer compensation [60,61]; (b) reference fiber compensation [62].
Photonics 09 00277 g012
Figure 13. Representative scheme for polarization noise suppression: (a) orthogonal polarization scheme [16]; (b) multi-parameter scheme [66].
Photonics 09 00277 g013
Figure 14. Representative scheme for pulse width compression: (a) orthogonal polarization scheme [70,71]; (b) multi-parameter scheme [72].
Photonics 09 00277 g014
Figure 15. Time slot multiplexing scheme [74]: (a) principle; (b) demodulation algorithm.
Photonics 09 00277 g015
Figure 16. VSP test results for the microstructure fiber DAS system [75]: (a) “zero bias” test results; (b) schematic diagram of signal consistency; (c) “non-zero bias” test results; (d) “zero bias” spectrum diagram; (e) “non-zero bias” spectrum.
Photonics 09 00277 g016
Figure 17. (a) The VSP test site. (b) The VSP test result [76].
Photonics 09 00277 g017
Figure 18. Schematic diagram of a pipeline survey [79]: (a) schematic diagram of DAS system for pipeline protection; (b) architectures of neural networks in the pipeline protection system; (c) the confusion matrix of four acoustic events.
Photonics 09 00277 g018
Figure 19. Rail defect detection based on DAS system [80]: (a) the process of detecting and analyzing sound waves based on fiber DAS; (b) photographs of the field test environment; (c) sound distribution measured by DAS.
Photonics 09 00277 g019
Figure 20. (a) Tunnel steel loop detection system based on DAS. (b) Schematic diagram of an invalid steel loop. (c) BP neural network. (d) Relationship between the degree of invalidity and the frequency deviation, (e) Relationship between the degree of invalidity and the energy distribution. (f) Power spectrum under different degrees of invalidity. (g) Wavelet energy transformation under different degrees of invalidity. (h) Recognition rate [81].
Photonics 09 00277 g020
Figure 21. (a) Map of Monterey Bay, CA, showing the Monterey Accelerated Research System (MARS) cable (DAS, pink portion), mapped faults, the Gilroy earthquake (red and white beach ball), and major bathymetric features. (b) Cross-section illustration of the MARS cable used for DAS. (c) The 10 min average wave height and spectral wave density (SWD) measurements outside Monterey Bay, which were measured using a buoy. (d) Seafloor DAS strain from a 2 km cable location averaged over a 15 min sliding window. (e) North component of ground velocity from an onshore broadband inertial seismometer averaged over a 15 min sliding window [86].
Photonics 09 00277 g021
Figure 22. (a) Fully distributed underwater acoustic sensor system. (b) Lightweight fully distributed underwater acoustic fiberoptic cable based on scattering-enhanced fiber. (c) The relationship between the phase demodulation change and acoustic pressure. (d) The frequency response curve within the frequency range of 100–2000 Hz [88].
Photonics 09 00277 g022
Figure 23. The underwater acoustic test: (a) the setup for the field test; (b) picture of the sensitized optical cable; (c) the static test results for the sound source; (d) motion trajectory tracking of the sound source.
Photonics 09 00277 g023
Table 1. Parameters of discrete enhanced scattering model.
Fiber LengthSpacing of SEPPulse WidthSpacing of ERSP dRepeat Times
13 m4 m20 ns1 um100
Table 2. Performance summary for CSE and DSE fibers.
Fabrication MethodSNR EnhancementsSensing Distance
CSE fiberContinuously inscribe Bragg gratings [31,32,33,34]15 dB [31]1 km [31]
Highly doped fiber [35,36]14 dB [36]1.9 km [36]
DSE fiberUV exposure [41,42,43,47,51,52,53]5.5–21.1 dB [41,42,43,47,51]50 km [51]
Femtosecond laser inscription [40,44,45,54]13–15.8 dB [40,54]9.8 km [54]
Publisher’s Note: MDPI stays neutral with regard to jurisdictional claims in published maps and institutional affiliations.

Share and Cite

MDPI and ACS Style

Sun, Y.; Li, H.; Fan, C.; Yan, B.; Chen, J.; Yan, Z.; Sun, Q. Review of a Specialty Fiber for Distributed Acoustic Sensing Technology. Photonics 2022, 9, 277. https://doi.org/10.3390/photonics9050277

AMA Style

Sun Y, Li H, Fan C, Yan B, Chen J, Yan Z, Sun Q. Review of a Specialty Fiber for Distributed Acoustic Sensing Technology. Photonics. 2022; 9(5):277. https://doi.org/10.3390/photonics9050277

Chicago/Turabian Style

Sun, Yixiang, Hao Li, Cunzheng Fan, Baoqiang Yan, Junfeng Chen, Zhijun Yan, and Qizhen Sun. 2022. "Review of a Specialty Fiber for Distributed Acoustic Sensing Technology" Photonics 9, no. 5: 277. https://doi.org/10.3390/photonics9050277

APA Style

Sun, Y., Li, H., Fan, C., Yan, B., Chen, J., Yan, Z., & Sun, Q. (2022). Review of a Specialty Fiber for Distributed Acoustic Sensing Technology. Photonics, 9(5), 277. https://doi.org/10.3390/photonics9050277

Note that from the first issue of 2016, this journal uses article numbers instead of page numbers. See further details here.

Article Metrics

Citations

Crossref
 
Web of Science
 
Scopus
 
ads
 
Google Scholar

Article Access Statistics

Created with Highcharts 4.0.4Chart context menuArticle access statisticsArticle Views9. Apr10. Apr11. Apr12. Apr13. Apr14. Apr15. Apr16. Apr17. Apr18. Apr19. Apr20. Apr21. Apr22. Apr23. Apr24. Apr25. Apr26. Apr27. Apr28. Apr29. Apr30. Apr1. May2. May3. May4. May5. May6. May7. May8. May9. May10. May11. May12. May13. May14. May15. May16. May17. May18. May19. May20. May21. May22. May23. May24. May25. May26. May27. May28. May29. May30. May31. May1. Jun2. Jun3. Jun4. Jun5. Jun6. Jun7. Jun8. Jun9. Jun10. Jun11. Jun12. Jun13. Jun14. Jun15. Jun16. Jun17. Jun18. Jun19. Jun20. Jun21. Jun22. Jun23. Jun24. Jun25. Jun26. Jun27. Jun28. Jun29. Jun30. Jun1. Jul2. Jul3. Jul4. Jul5. Jul6. Jul7. Jul0k2k4k6k8k
For more information on the journal statistics, click here.
Multiple requests from the same IP address are counted as one view.
Back to Top  返回页首Top