Datadog - Datadog and Kubernetes
You have no instance yet for this lesson.
Launching new machine may take time.
Datadog
V - Datadog and Kubernetes
a - presentation
Kubernetes, or k8s, is an open source platform that automates container operations. It eliminates many of the manual processes involved in deploying and scaling containerized applications, In other words, we can cluster groups of hosts running containers, and Kubernetes helps us to easily and efficiently manage these clusters.
Why are IT professionals deploying more containers? Deployment speed, workload portability and a good fit with the DevOps way of working, for a start. Containers can greatly simplify resource provisioning for time-pressed developers.
Once organizations understand the benefits of containers and Kubernetes for DevOps, application development and delivery, it opens up many possibilities, from modernizing traditional applications to hybrid and multi-cloud implementations and the development of new native cloud applications.
Kubernetes is the most popular container management system available today. The rise of container technology has increased the demand for containers within organizations. It is used by many cloud providers to run their container-based workloads.
Companies such as Google, Netflix and Amazon make extensive use of Kubernetes. In fact, Kubernetes is the leading platform for container orchestration and management. As such, there are a number of tools we can use to monitor our resources. So we'll be talking about The integration between Datadog and Kubernetes so that we can set up real-time monitoring of our deployed workloads and our cluster.
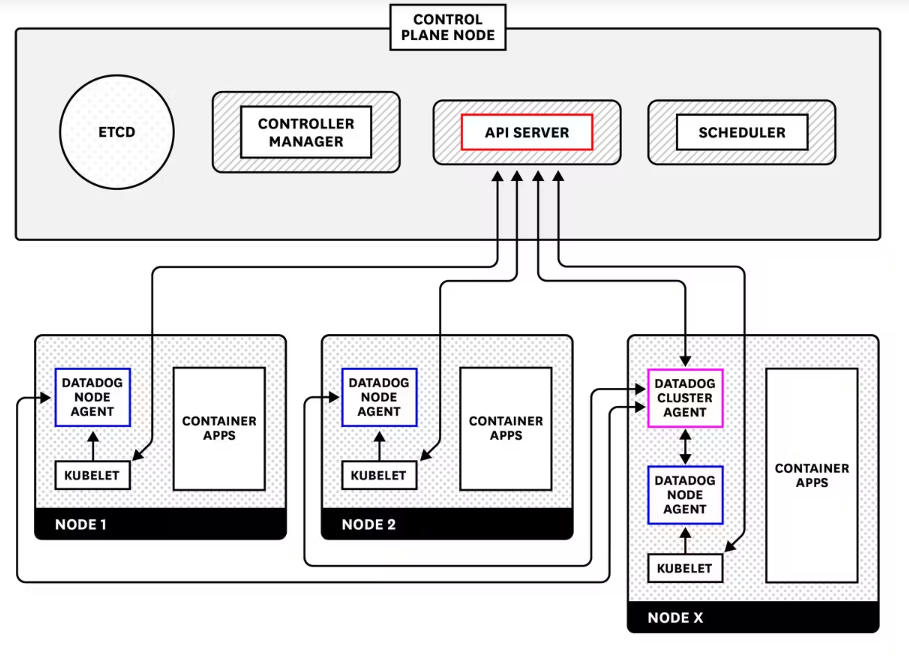
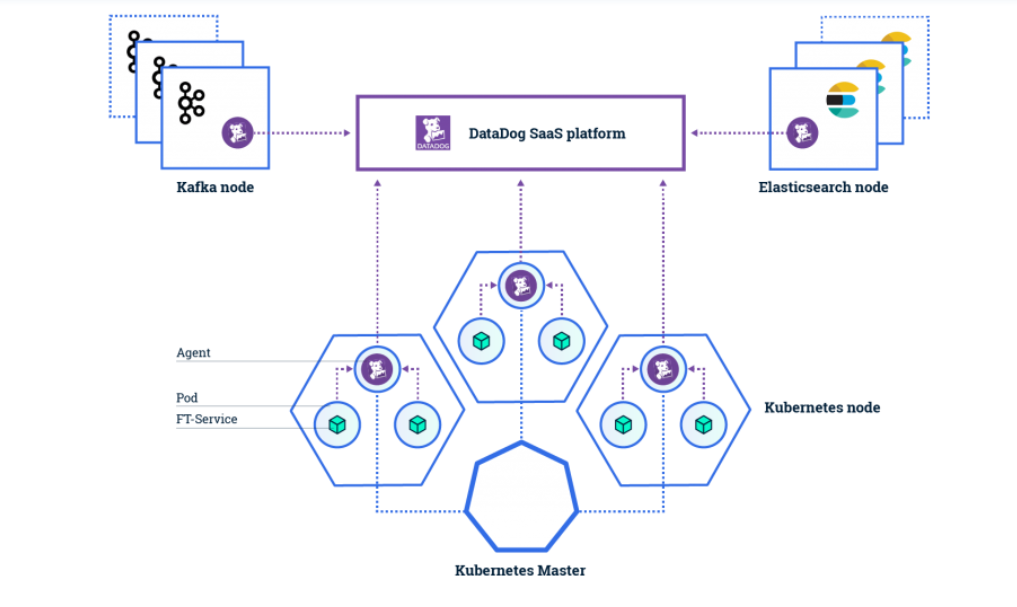
The Datadog Agent deployment instructions for Kubernetes provide a complete manifest for deploying the node-based containerized Agent as a DaemonSet. the specialized Datadog Cluster Agent, offers us several additional advantages for large-scale production use cases:
- reduces the load on the Kubernetes API server for cluster-level data collection by acting as a proxy between the API server and node-based agents
- provides additional security by reducing the permissions required for node-based agents
- enables automatic scaling of Kubernetes workloads using any metrics collected by Datadog
b - Installation
We'll be using an extremely lightweight version of Kubernetes called k3s in this course. K3s is a Kubernetes distribution developed by Rancher.
As a lightweight version of Kubernetes, K3s consumes less resources than traditional distributions, enabling it to run well on small individual machines such as portables or desktops. K3s is also easier than other Kubernetes distributions to configure and manage in many respects.
.That said, K3s isn't just for testing and experimentation. It can also serve as a production-ready Kubernetes distribution that can scale to run on large networks of devices. Rancher promotes K3s as a Kubernetes option for IoT and edge infrastructures due to its low resource requirements, as well as its support for ARM64 and ARMv7 devices.
We can install everything with the following command:
curl -sfL https://get.k3s.io | sh -s - --write-kubeconfig-mode 644
We can now check the Kubernetes installation:
kubectl version --short
Output display:
Flag --short has been deprecated, and will be removed in the future. The --short output will become the default.
Client Version: v1.25.4+k3s1
Kustomize Version: v4.5.7
Server Version: v1.25.4+k3s1
We can notice that we have the Kubernetes version: Server Version: v1.25.4+k3s1, the Kubectl client version: Client Version: v1.25.4+k3s1. We'll talk about Kustomize in the rest of this course.
K3s provides us with a node on which we have all the components of a cluster, it's an "all-in-one" installation on which we have a master and worker in a single instance.
To perform this check, we can run the following command:
k3s kubectl get nodes
c - installing the Datadog agent
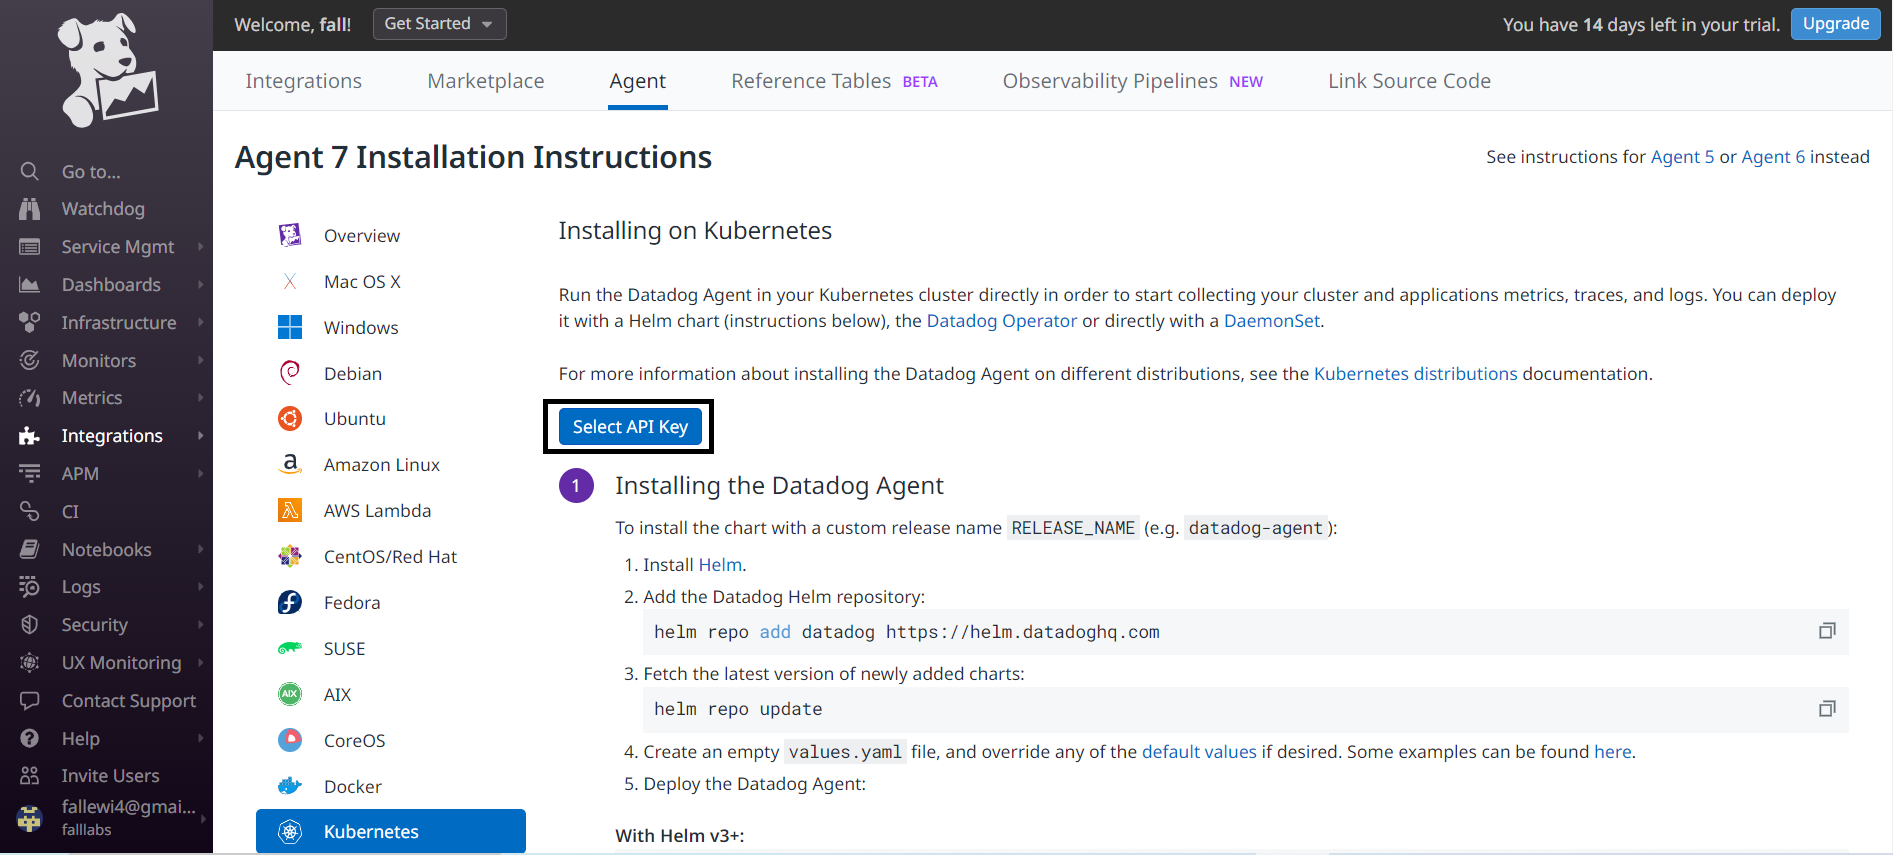
We're now going to deploy our Datadog agent within our Kubernetes cluster. We'll go to our Datadog instance in the cloud, We'll click on the integrations menu and the agent sub-menu.
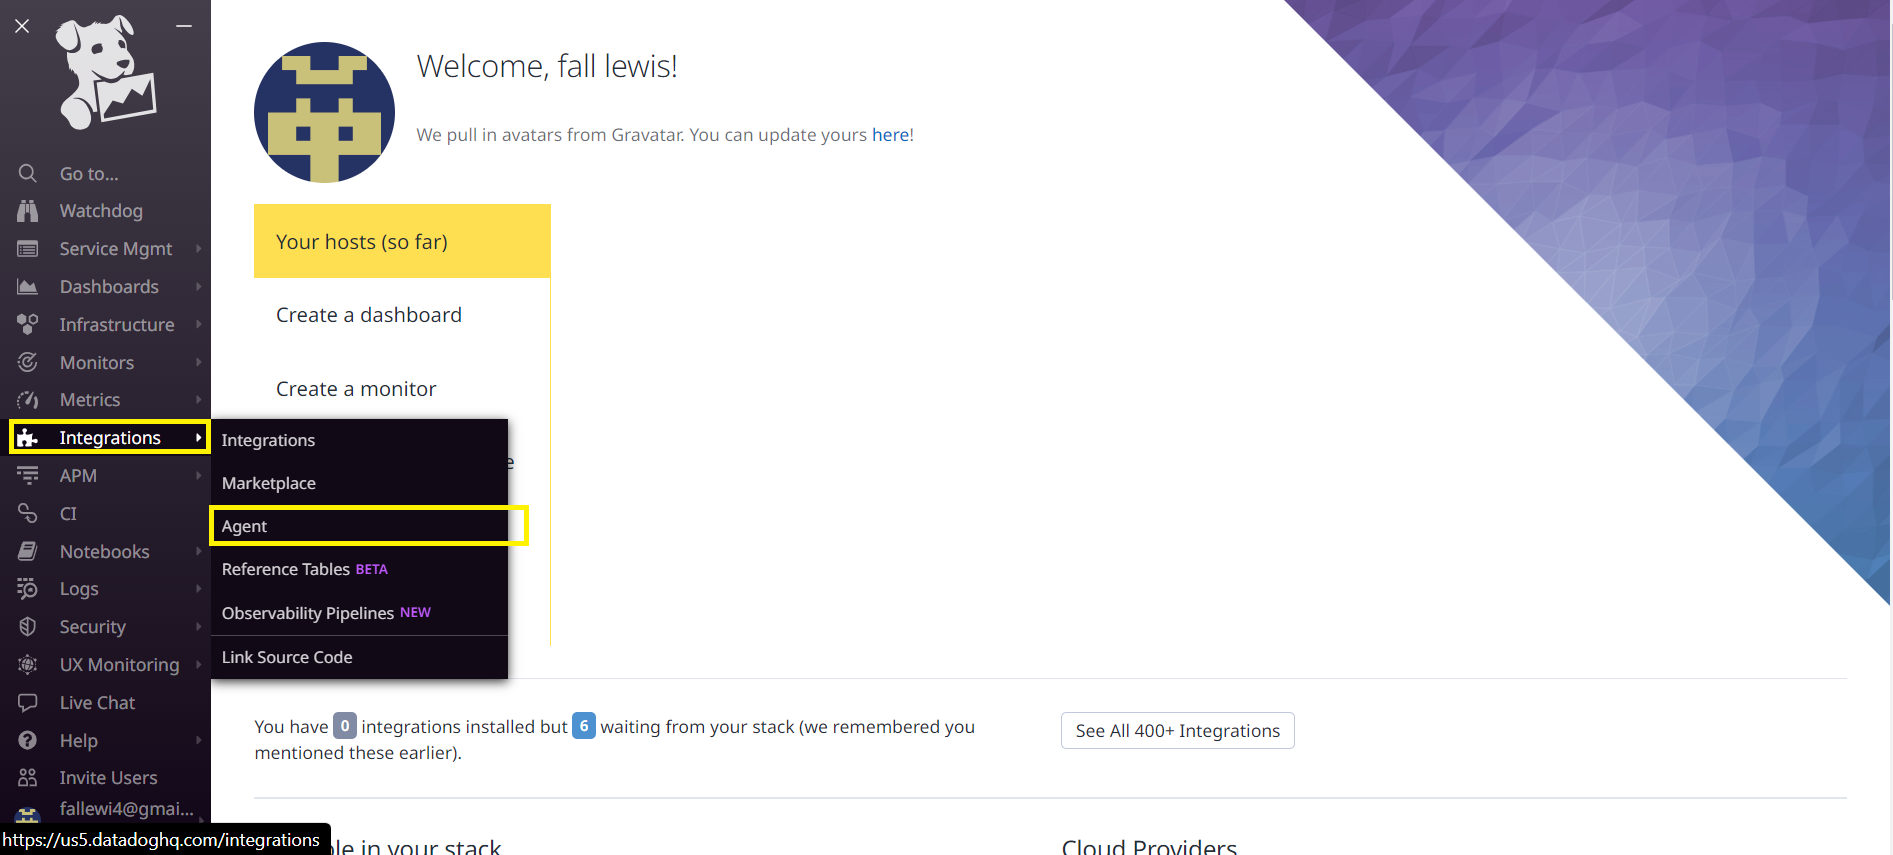
We can then select Kubernetes from the list of agents we can install.
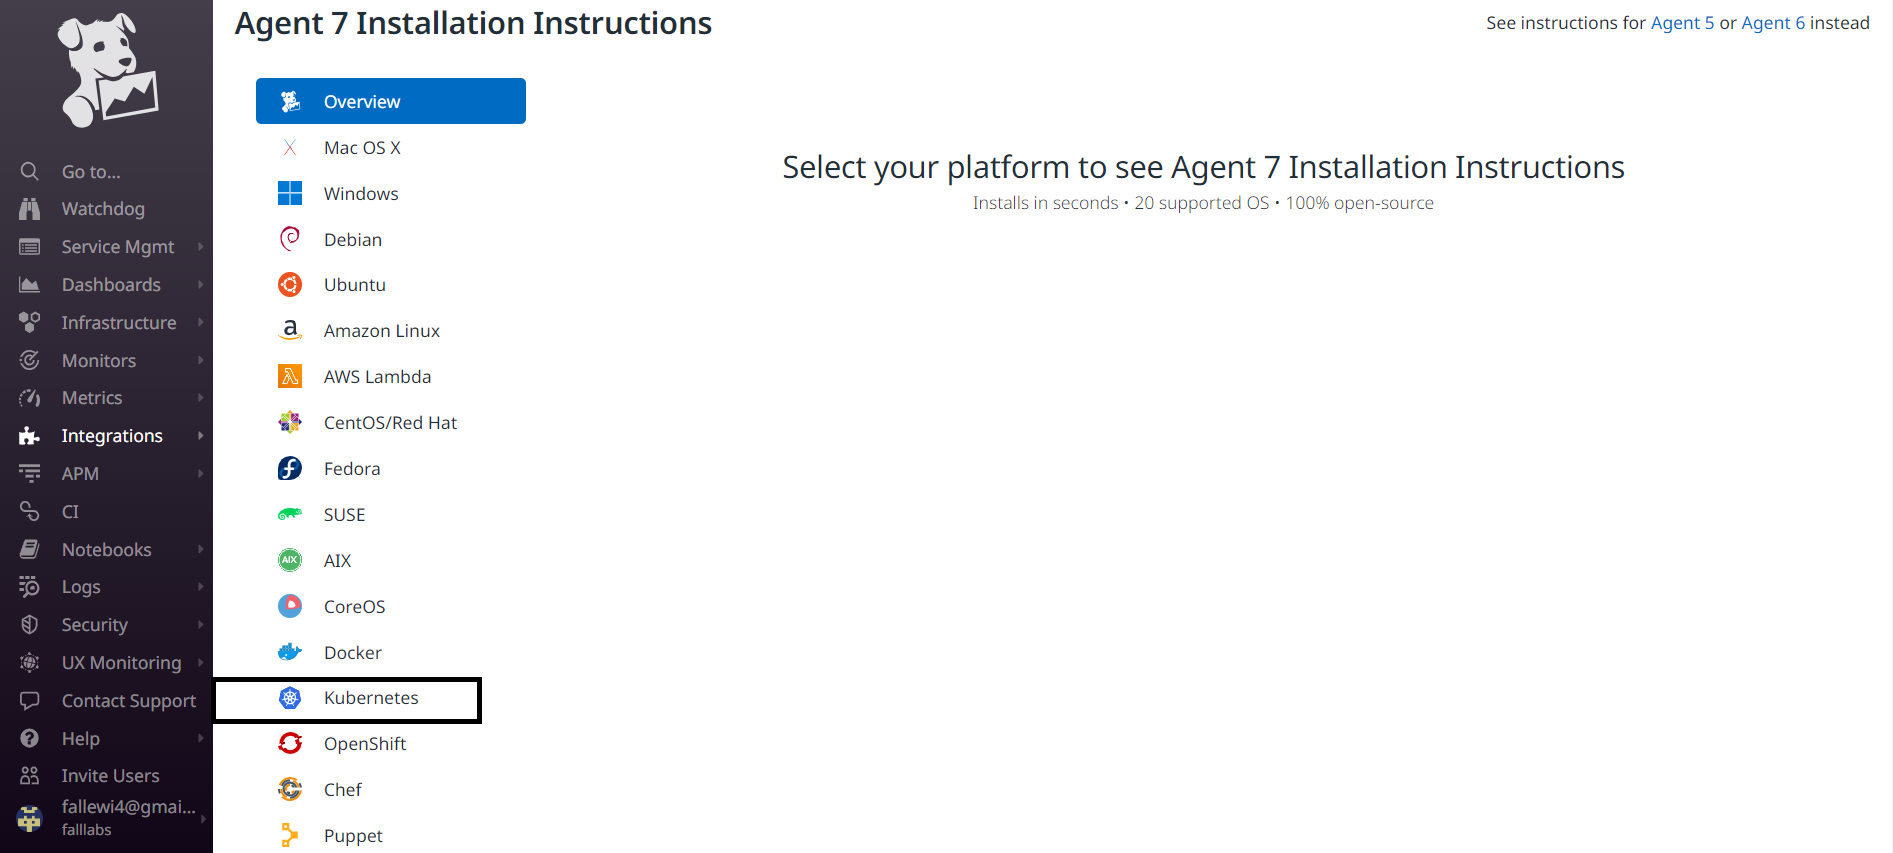
We arrive on the page that allows us to discover the set of commands we need to use in order to install the Datadog agent within our Cluster.
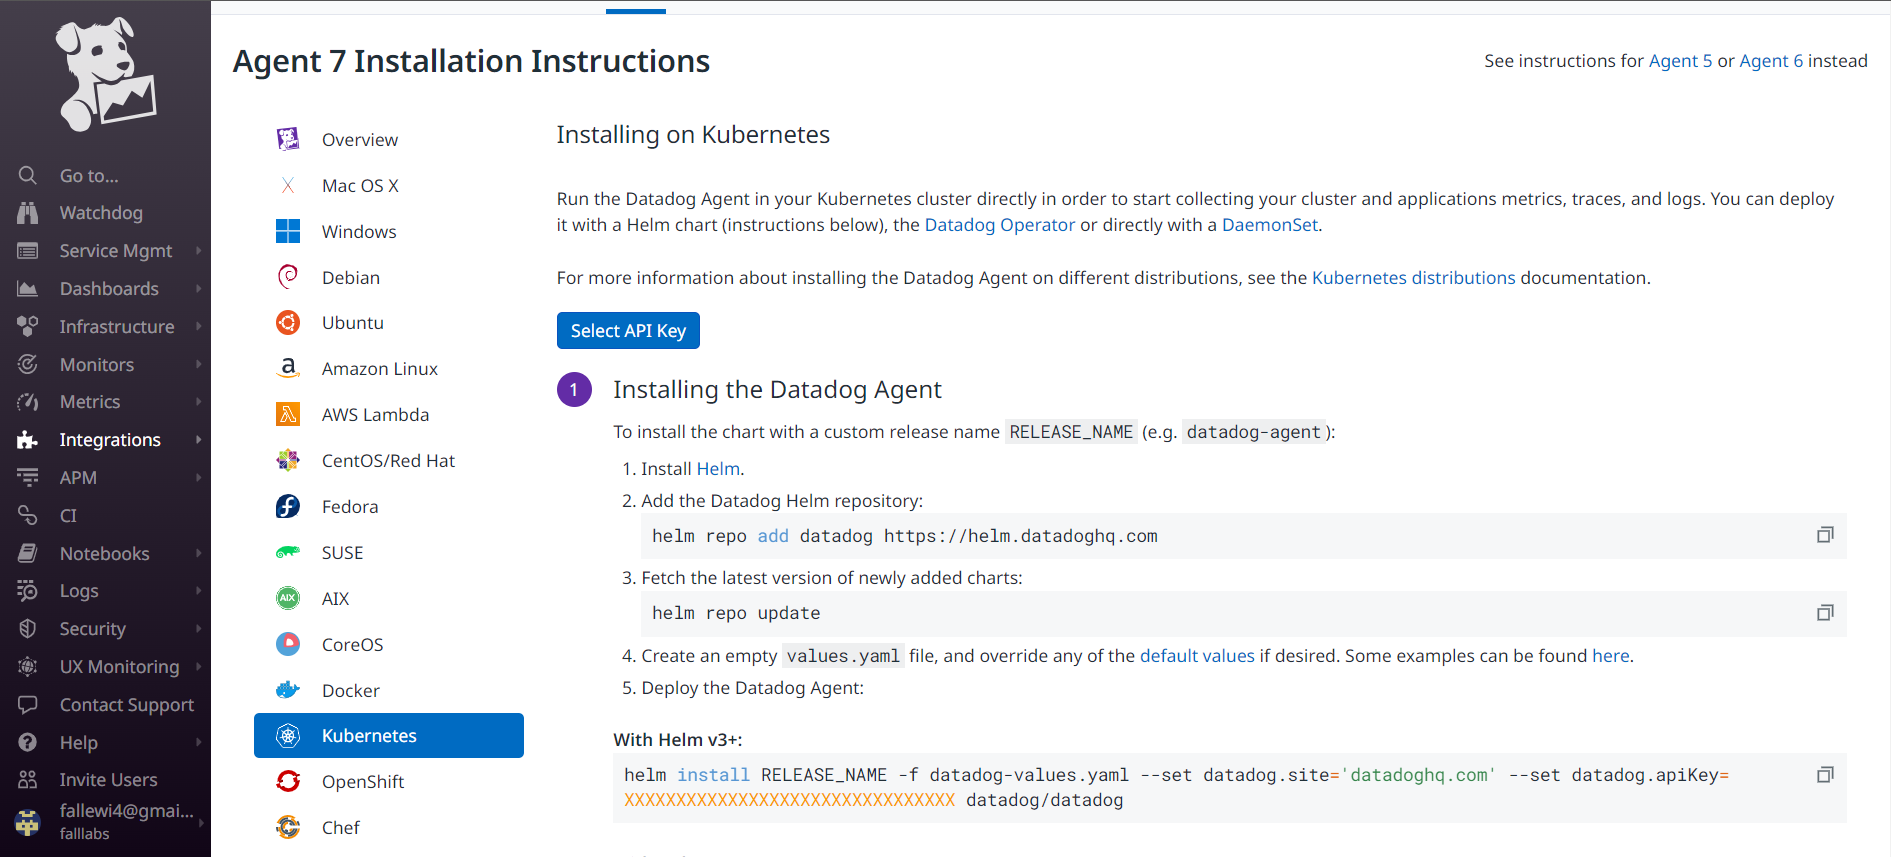
We'll be using Helm in this course.
Helm is a package manager for Kubernetes applications and remains one of the most widely used tools within Kubernetes to facilitate deployments and their consistency. Over the past few years, Kubernetes has grown considerably, as has the ecosystem that supports it. Recently, Helm now has graduate status from the Cloud Native Computing Foundation (CNCF), which shows his growing popularity among Kubernetes users.
Although there are several ways to install Helm that are carefully described on the official Helm installation page, We'll use the shell script provided in the documentation to install Helm. Let's now install Helm:
curl -fsSL -o get_helm.sh https://raw.githubusercontent.com/helm/helm/main/scripts/get-helm-3
chmod 700 get_helm.sh
./get_helm.sh
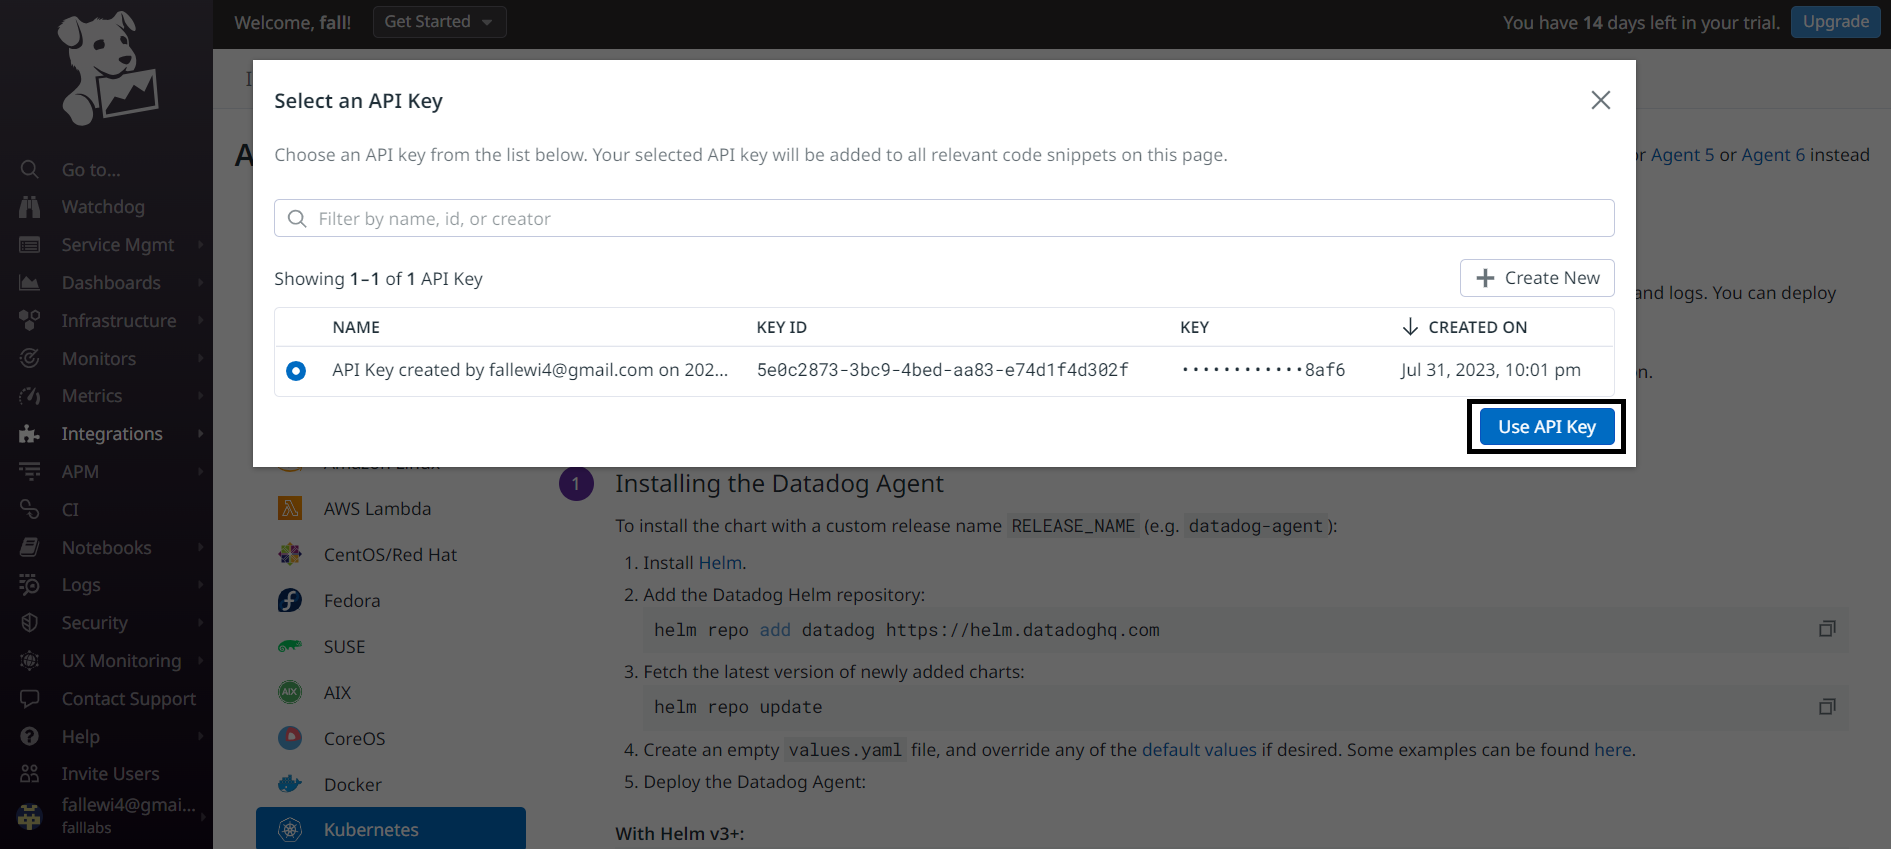
We're now ready to follow the instructions that will allow us to install the Datadog agent within our Cluster. We can click on the select api key button to retrieve our Datadog api key.
We can now select our api key and click on the Use API key button.
We therefore need to implement several steps:
mkdir ~/.kube # create a repository named .kube at the home directory of the user
kubectl config view --raw > ~/.kube/config # generate a kube config file
helm repo add datadog https://helm.datadoghq.com # add the datadog repository to helm
Let's retrieve the latest version of the Charts recently added to our Cluster:
helm repo update # update charts
Let's now create a filevalues.yaml with the parameters that will allow us to configure the behavior of our Datadog agent:
# nameOverride -- Override name of app
nameOverride: # "k8s-datascientest"

# fullnameOverride -- Override the full qualified app name
fullnameOverride: # "k8s-datascientest"

# targetSystem -- Target OS for this deployment (possible values: linux, windows)
targetSystem: "linux"

datadog:
  networkMonitoring:
    # datadog.networkMonitoring.enabled -- Enable network performance monitoring
    enabled: True

  serviceMonitoring:
    # datadog.serviceMonitoring.enabled -- Enable Universal Service Monitoring
    enabled: True
  ## Enable security agent and provide custom configs
  securityAgent:
    compliance:
      # datadog.securityAgent.compliance.enabled -- Set to true to enable Cloud Security Posture Management (CSPM)
      enabled: True
  logs:
    enabled: true
    containerCollectAll: true
We can then execute the following command:
helm install datadog -f datadog-values.yaml --namespace datadog --create-namespace --set datadog.site='datadoghq.com' --set datadog.apiKey=873bc018440dfb9284425ef82c9d8af6 datadog/datadog
Output display:
NAME: datadog
LAST DEPLOYED: Tue Aug 1 00:28:40 2023
NAMESPACE: default
STATUS: deployed
REVISION: 1
TEST SUITE: None
NOTES:
Datadog agents are spinning up on each node in your cluster. After a few
minutes, you should see your agents starting in your event stream:
    https://app.datadoghq.com/event/explorer

###################################################################################
#### WARNING: Cluster-Agent should be deployed in high availability mode ####
###################################################################################

The Cluster-Agent should be in high availability mode because the following features
are enabled:
* Admission Controller

To run in high availability mode, our recommendation is to update the chart
configuration with:
* set `clusterAgent.replicas` value to `2` replicas .
* set `clusterAgent.createPodDisruptionBudget` to `true`.
This Chart adds the Datadog Agent to all the nodes in our cluster via a DaemonSet. Shortly after installation, Datadog starts reporting hosts and metrics data from our account. We can verify that our Datadog agent is in the running state after a few minutes.
kubectl get pod -n datadog
Output display:
NAME READY STATUS RESTARTS AGE
datadog-cluster-agent-67d8885456-p4ccn 1/1 Running 0 12m
datadog-b49gc 5/5 Running 0 12m
We can check what is happening within the Datadog agent by executing the following command:
kubectl logs -f -n datadog datadog-cluster-agent-67d8885456-p4ccn
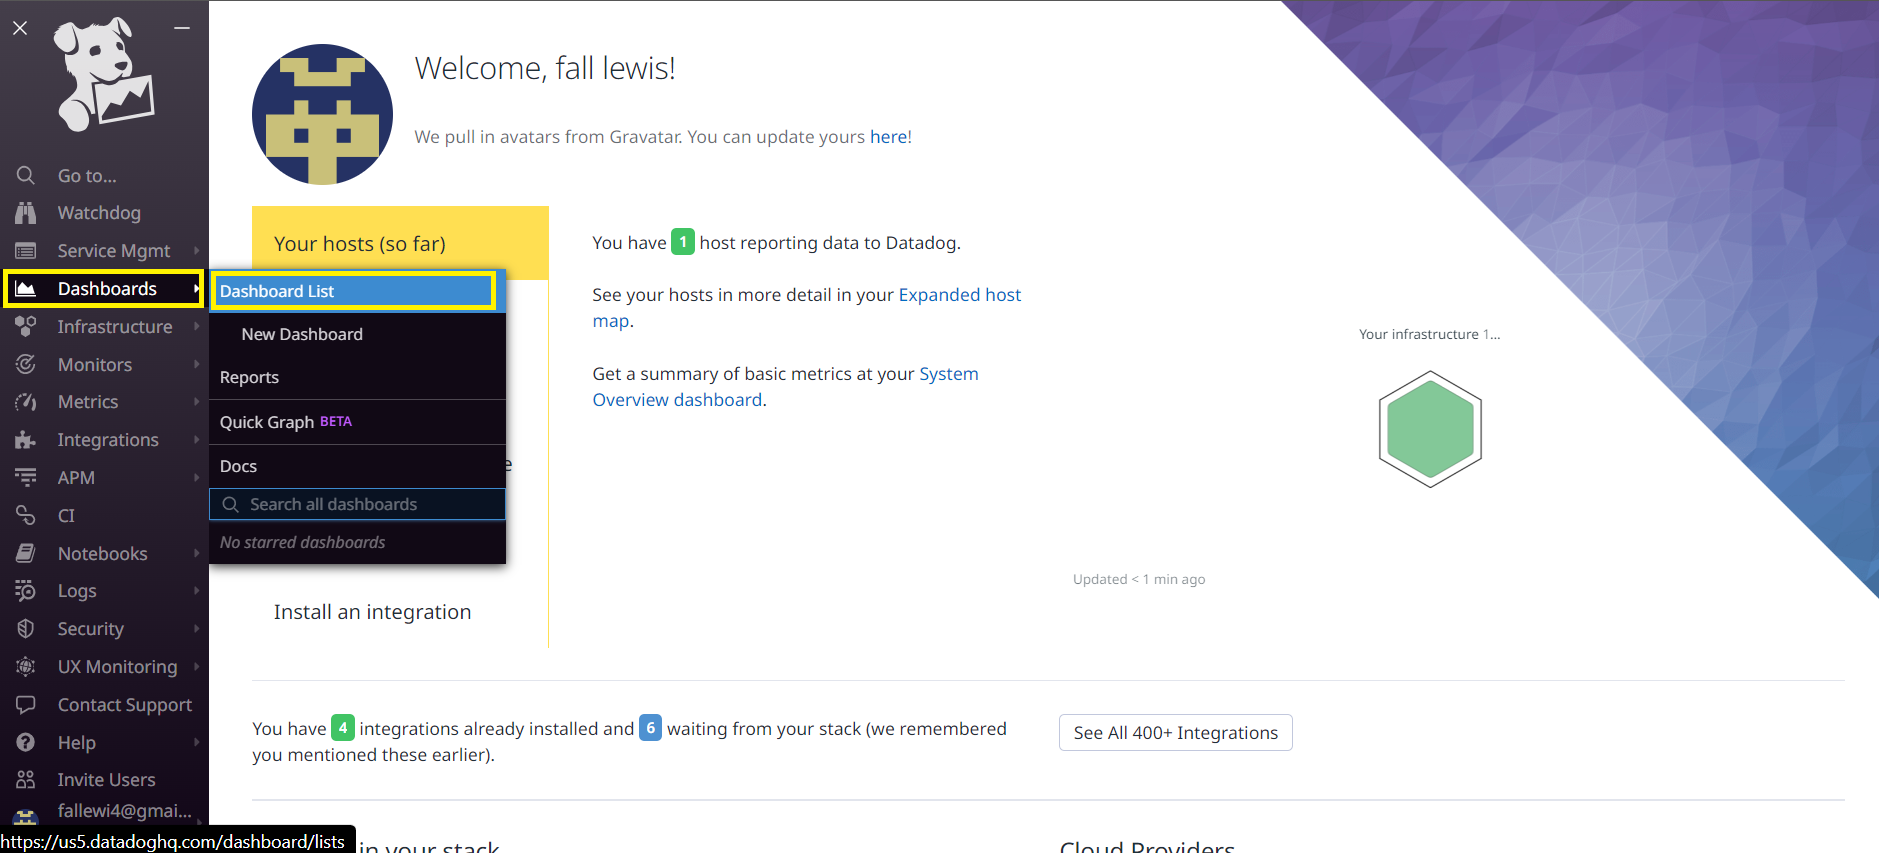
After a few minutes we can go to our Datadog instance to consult the metrics.
Let's go to the Dashbords menu and under the Dashbord list submenu.
We can see from the list of available dashboards that we have a set of dashboards for Kubernetes. We need them badly. Let's start by clicking on the Kubernetes Cluster Overview Dashboard.
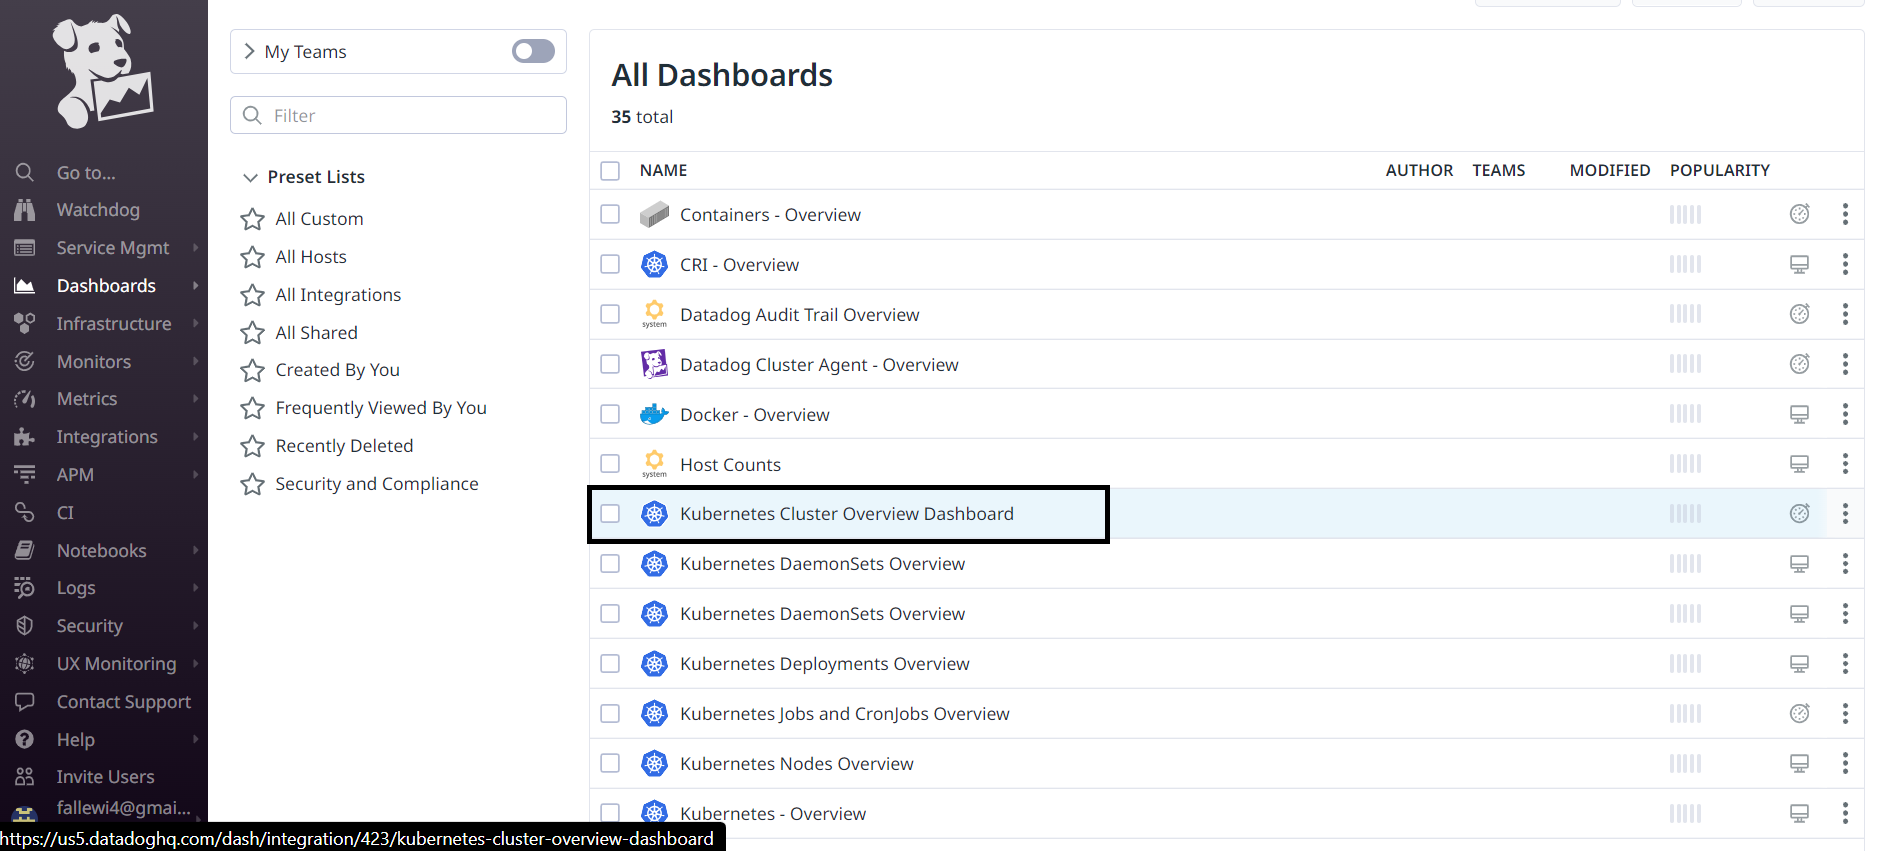
We are redirected to an interface with lots of tiles that show us the metrics and status of our resources within the Kubenetes cluster.
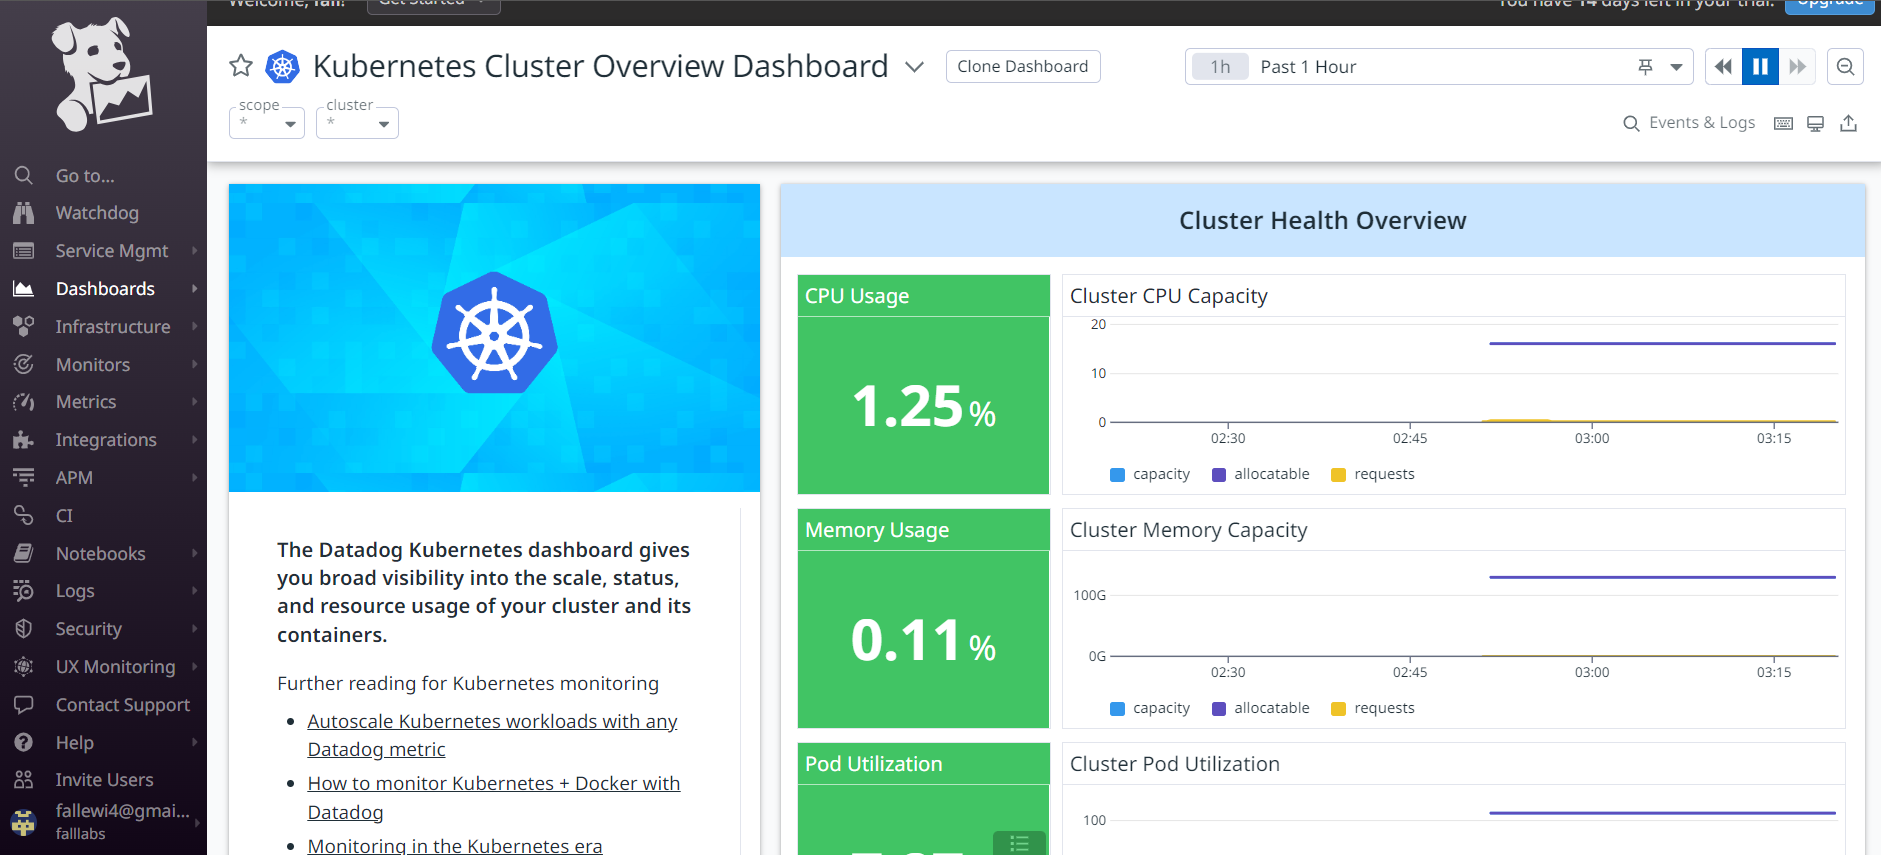
In this first part we take a look at a few metrics such as CPU consumption, RAM and Pod usage.
If we go a little further down this interface, we can discover the list of resources present on our cluster. In the Resource Overview section, we can therefore see the number of Namespaces present, services, nodes, Daemonsets, Statefullset, etc.
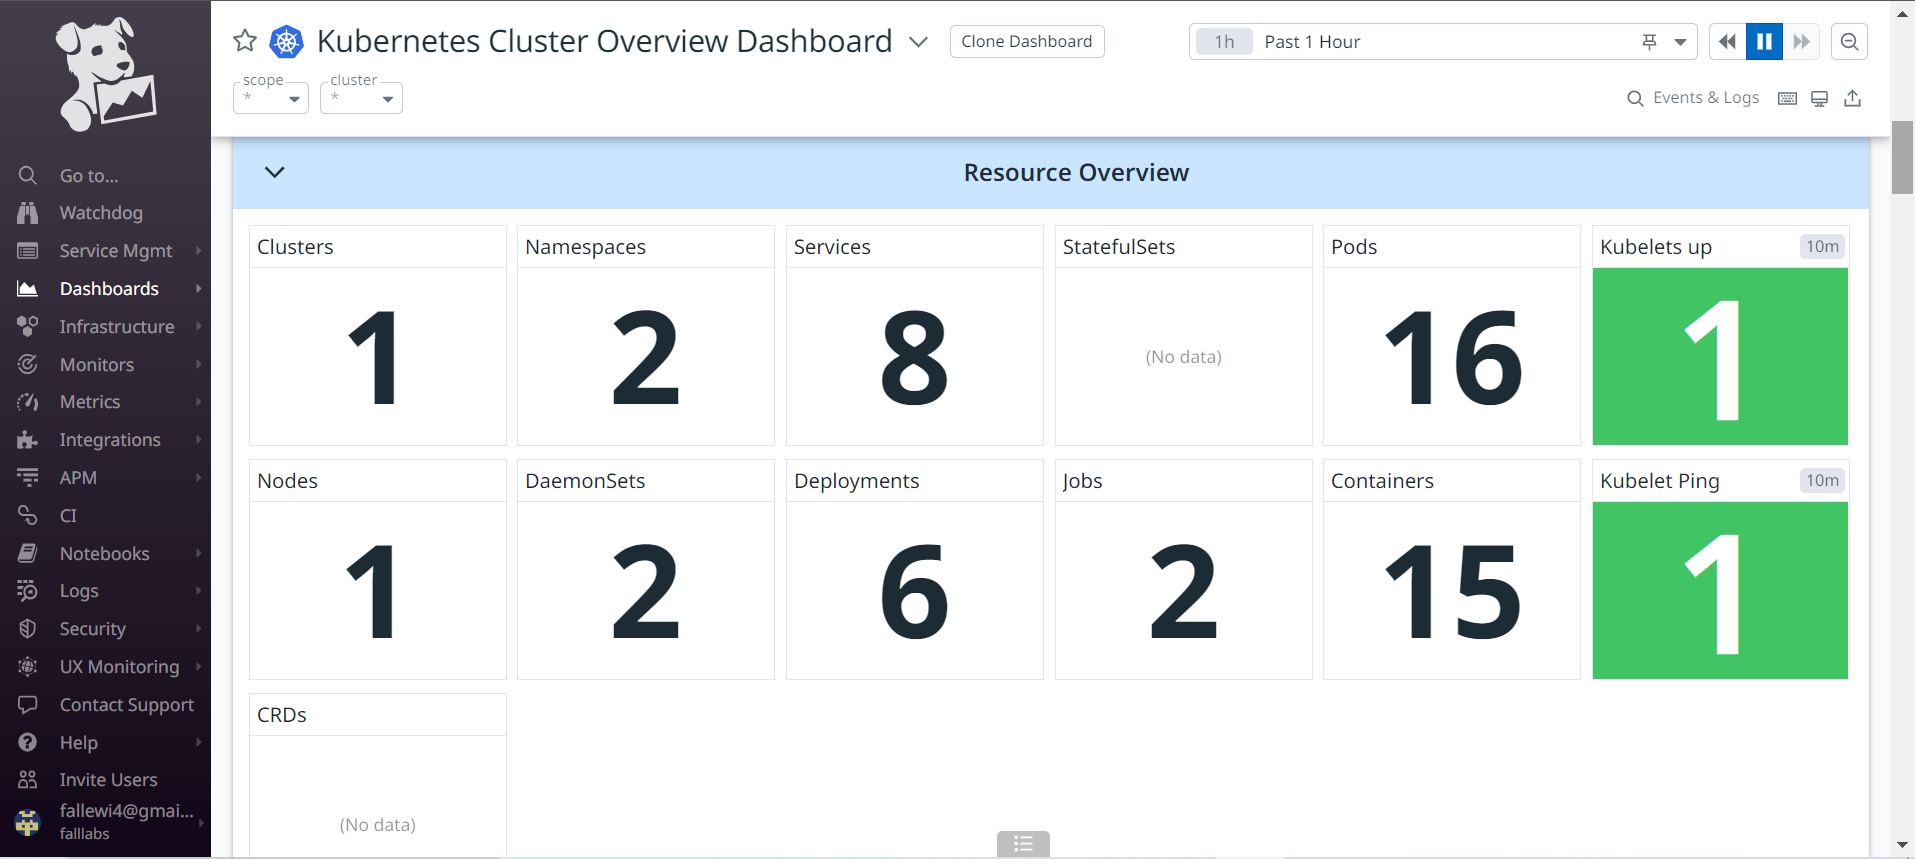
Still a little further down, we have monitoring metrics for our Kubernetes node as we only have one for our Cluster. K3S allows us to set up a very lightweight AllInOne cluster for our deployments which is very optimal. We can review all the metrics present to better familiarize ourselves with Datadog's environment for monitoring Kubernetes.
d - available metrics
d.1 - Overview
Kubernetes monitoring is essential for reliable, continuous operations of mission-critical systems. Kubernetes has become the most important infrastructure platform in the modern IT environment. However, with the power of Kubernetes comes extreme complexity, raising major operational challenges.
DevOps and IT operations teams are struggling to find ways of running Kubernetes reliably, detecting errors and correcting them in a timely manner. The first step in this process is monitoring: teams need to establish visibility over containerized environments. Knowing what's running and having access to basic operational metrics is the first building block to running a robust, enterprise-grade Kubernetes environment.
Why is Kubernetes monitoring important?
There are many benefits to implementing a Kubernetes monitoring strategy, including:
Troubleshooting and reliability:Kubernetes applications are often complex, especially if they are cloud-based or use a microservices architecture. This makes it difficult to identify the root cause of problems. Monitoring metrics can give us visibility into our Kubernetes deployment, so we can see where problems may occur (or have occurred), enabling us to prevent and resolve issues.
Performance optimization: understanding the ins and outs of a Kubernetes cluster allows us to make informed decisions about your hardware configurations, to ensure high performance for your applications.
Cost management - it's essential to keep track of the resources we consume to ensure we're not overloaded. If our Kubernetes applications are running on a public cloud infrastructure, we need to know how many nodes we're running.
Chargebacks and showbacks: in some situations, we might want to know which team groups have used specific resources. Kubernetes monitoring provides the necessary usage information for cost analysis and chargeback purposes.
Security: an essential capability in a modern IT environment is to see what jobs are running and where. This allows us to identify unauthorized or unnecessary work that may indicate a breach or DOS attack. While Kubernetes monitoring won't solve every security problem, it can provide us with crucial information for maintaining security.
Having an appropriate level of visibility in Kubernetes is necessary to enable proper monitoring of applications and clusters.
d.2 - Key Kubernetes metrics to monitor
Monitoring the health of a Kubernetes cluster can help us understand which components are impacting the health of your cluster. For example, we can know how many resources the cluster is using as a whole and how many applications are running on each node in the cluster. We can also find out how well our nodes are running, and at what capacity.
We can therefore note several useful metrics to monitor:
- Node resource utilization: metrics such as network bandwidth, memory and CPU usage, and disk usage. We can use these metrics to know whether we need to decrease or increase the number and size of cluster nodes.
- The number of nodes: this metric can help you find out which resources are being billed by the cloud provider and discover how the cluster is being used.
- Running pods: by tracking the number of running pods, we can determine whether the available nodes are sufficient to handle current workloads in the event of a node failure.
Kubernetes pod metrics
The process of monitoring a Kubernetes pod can be divided into three elements:
Kubernetes metrics: these allow us to monitor how an individual pod is being managed and deployed by the orchestrator. We can monitor information such as the number of instances in a pod at any given time compared with the expected number of instances (a lower number may indicate that the cluster is running out of resources). We can also see deployment in progress (the number of instances switched to a newer version), check the status of our pods and view network data.
Pod container metrics: Important metrics include network, CPU and memory usage, which can be compared with the maximum allowable usage.
Application-specific metrics - these are developed by the application itself and relate to specific business rules. A database application, for example, is likely to expose metrics on the state of an index, as well as relational statistics, while an E-commerce application might expose data on the number of online customers and revenues generated in a given timeframe. The application exposes these types of metrics directly, and you can link the application to a monitoring tool to track them more closely.
Status metrics
kube-state-metrics is a Kubernetes service that provides data on the state of cluster objects, including pods, nodes, namespaces and DaemonSets. It provides metrics via the API of standard Kubernetes metrics.
We can monitor several aspects using status metrics:
Persistent volumes (PV): a PV is a storage resource specified on the cluster and made available as persistent storage for any pod that requests it. PVs are linked to a certain pod during their lifecycle. When the PV is no longer needed by the pod, it is reclaimed. Monitoring PVs can help us know when recovery processes fail, which means something isn't working properly with our persistent storage.
Disk pressure (
Disk pressure): occurs when a node uses too much disk space or when a node uses disk space too quickly. Disk pressure is defined according to a configurable threshold. Monitoring this metric can help us know whether the application really needs extra disk space, or whether it's prematurely filling the disk unexpectedly.Crashloopbackoff (
Crashloopbackoff): can occur when a pod starts, crashes, then gets stuck in a loop of continuous unsuccessful attempts to restart. When a crash loop occurs, the application cannot run. This can be caused by an application crashing in the pod, pod misconfiguration or a deployment problem. As there are many possibilities, debugging a crash loop can be a tricky endeavor.
However, we need to be informed immediately of the crash in order to mitigate or quickly implement emergency measures that can keep the application available.
- Jobs: is a Kubernetes object designed to temporarily execute pods. A job can run pods for a limited duration. Once pods have completed their functions, the Job can stop them. Sometimes, however, jobs fail to perform their function successfully. This can happen as a result of a node restart or failure. It can also be the result of resource exhaustion. Job failure monitoring can help you know when your application is not accessible.
Container metrics
We need to monitor container metrics to ensure that containers are using resources correctly. These metrics can help us understand whether we're reaching a predefined resource limit and detect pods stuck in a state of CrashLoopBackoff.
We can monitor several container metrics:
Container CPU utilization: this allows us to discover how much CPU resources our containers are using compared to the pod limits we've set.
Container memory utilization: this allows us to discover the amount of memory used by our containers in relation to the pod limits we've defined.
Network usage: this allows us to detect data packets sent and received, as well as the amount of bandwidth used.
Application metrics
These metrics can help us measure the availability and performance of applications running in pods. The business scope of the application determines the type of metrics provided. Here are several important metrics:
Application availability - can help us measure application uptime and response times. This metric can help you evaluate user experience and optimal performance.
Application health and performance: can help us learn more about performance issues, latency, responsiveness and other user experience problems. This metric can reveal errors that need to be corrected in the application layer.
e - Monitoring and Alerting for an application
Let's deploy an instance of Wordpress within our Cluster to see how we'll be able to set up monitoring and alerting for our application. We'll now use the Datascientest repository from charts HELM to install Wordpress:
helm repo add datascientest http://dst-hart-museum.datascientest.com:8080
Output display:
"datascientest" has been added to your repositories
We can check the list of repositories present:
helm repo list
Output display:
NAME URL
datascientest http://dst-hart-museum.datascientest.com:8080
We can then check the list of HELM Charts present:
helm search repo datascientest
Output display:
NAME CHART VERSION APP VERSION DESCRIPTION
datascientest/common 2.2.4 2.2.4 A Library Helm Chart for grouping common logic ...
datascientest/mariadb 12.1.1 10.11.2 MariaDB is an open source, community-developed ...
datascientest/phpbb 13.0.0 3.3.10 phpBB is a popular bulletin board that features...
datascientest/wordpress 0.1.0 1.16.0 Wordpress + MySQL helm chart by Fall Lewis
We can now deploy wordpress by passing variable values on the command line using the --set flag. the information used to deploy our Wordpress instance is in the values.yaml file embedded in our HELM Chart. It has the following contents:
namespace: wordpress

wordpress:
  deployment:
    image: wordpress:4.8-apache
    replicaCount: 1
  service:
    type: NodePort
    port: 80

mysql:
  deployment:
    image: mysql:5.6
    replicaCount: 1
  service:
    type: ClusterIP
    port: 3306
  pvc:
    accessMode: ReadWriteOnce
    storage: 2Gi
    storageClassName: local-path
Some explanations:
Mysqlstores data on a persistent volume (PV).We can provision a standard 2 Gio disk as the PV. The PV can be claimed through our PVC by defining a
StorageClassNameoption that haslocal-pathas its value on ourk3sinstance.We also set the service type to
NodePort. Without this action, we'll have a volume of typeLoadBalancer.We want a replica of our Pods
WordpressandMysql.
We can change these values with the --set option to define a new value. For example, if we wanted to change the value of the initial Namespace wordpress on deployment to datascientest, we'd use the following command:
Do not execute next command
# not to be executed at this time
helm install wordpress-mysql datascientest/wordpress --values=values.yaml --set namespace=datascientest --create-namespaces
The --create-namespace flag is used to create the Namespace in which we want to deploy our code, namely Datascientest if it does not exist at the time the command is executed.
To set a new value for our storage to 5Gi while deploying our application within our Namespace datascientest we would do it as follows:
# to run
helm install wordpress-mysql datascientest/wordpress --values=values.yaml --set namespace=datascientest --create-namespace --set mysql.pvc.storage=5Gi
So we have the following output:
NAME: wordpress-mysql
LAST DEPLOYED: Thu Apr 20 16:36:55 2023
NAMESPACE: default
STATUS: deployed
REVISION: 1
TEST SUITE: None
NOTES:
1. Get the application URL by running these commands:
  echo "You can get your Nodeport port in other to connect to your Datascientest Wordpress Instance"
We can check all the resources now created in the new Namespace datascientest:
kubectl get svc,pod,deploy,pv,pvc -n datascientest | grep wordpress
Output display:
service/wordpress-mysql-demo-mysql ClusterIP 10.43.59.177 <none> 3306/TCP 5m10s
service/wordpress-mysql NodePort 10.43.22.199 <none> 80:30928/TCP 5m10s
pod/wordpress-mysql-59b58fd77b-7p7zb 1/1 Running 0 5m10s
pod/wordpress-mysql-demo-mysql-7cb44cd465-db5xz 1/1 Running 0 5m10s
deployment.apps/wordpress-mysql 1/1 1 1 5m10s
deployment.apps/wordpress-mysql-demo-mysql 1/1 1 1 5m10s
persistentvolume/pvc-b9db0d1d-33d5-4266-a179-af0806cdc8eb 5Gi RWO Delete Bound datascientest/wordpress-mysql-demo-mysql-data local-path 5m6s
persistentvolumeclaim/wordpress-mysql-demo-mysql-data Bound pvc-b9db0d1d-33d5-4266-a179-af0806cdc8eb 5Gi RWO local-path 5m10s
e.2 - Accessing the WordPress application
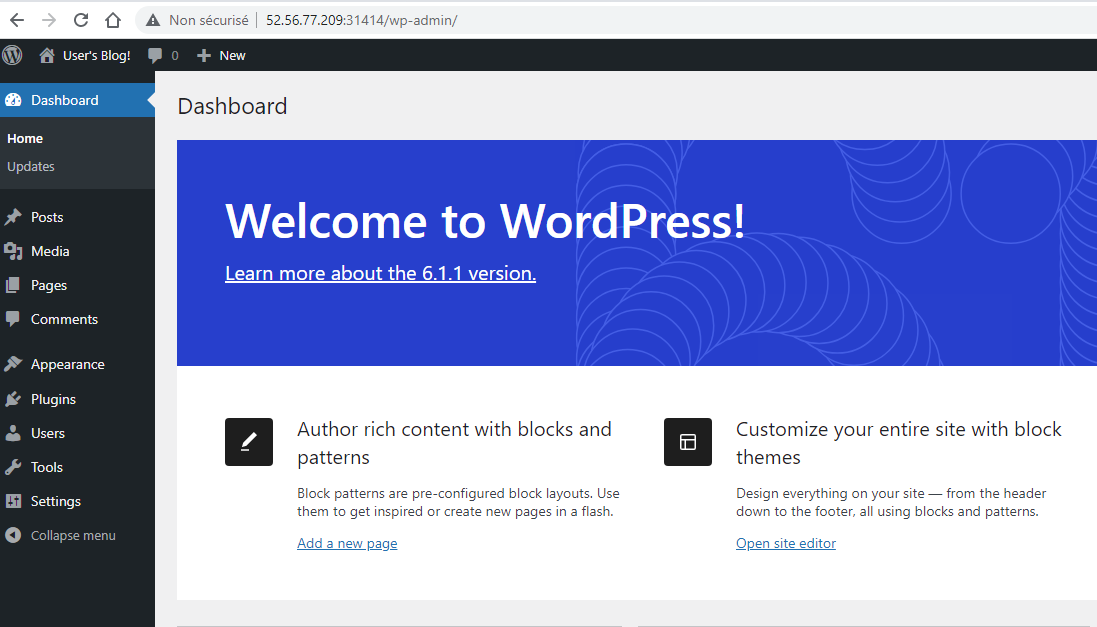
Once our chart has been installed, we can connect to the port provided for our NodePort-type service to access the application. In our case the port provided tests the 30928. We can connect to the following url: http://<IP address>:30928 to configure our identifiers and database.
NodePort type service. You should therefore use the one present on your machine for manipulations.
Once completed, we arrive at the <IP address>:30928/login path which is the login page, let's enter our username defined at configuration and the password to connect to the application.
We can now go to our Datadog instance to check that we have our application deployed. Let's go to the Dashboard menu and the Dashboard List submenu.
On the list of dashboards, let's select the Kubernetes Pods Overview dashboard.
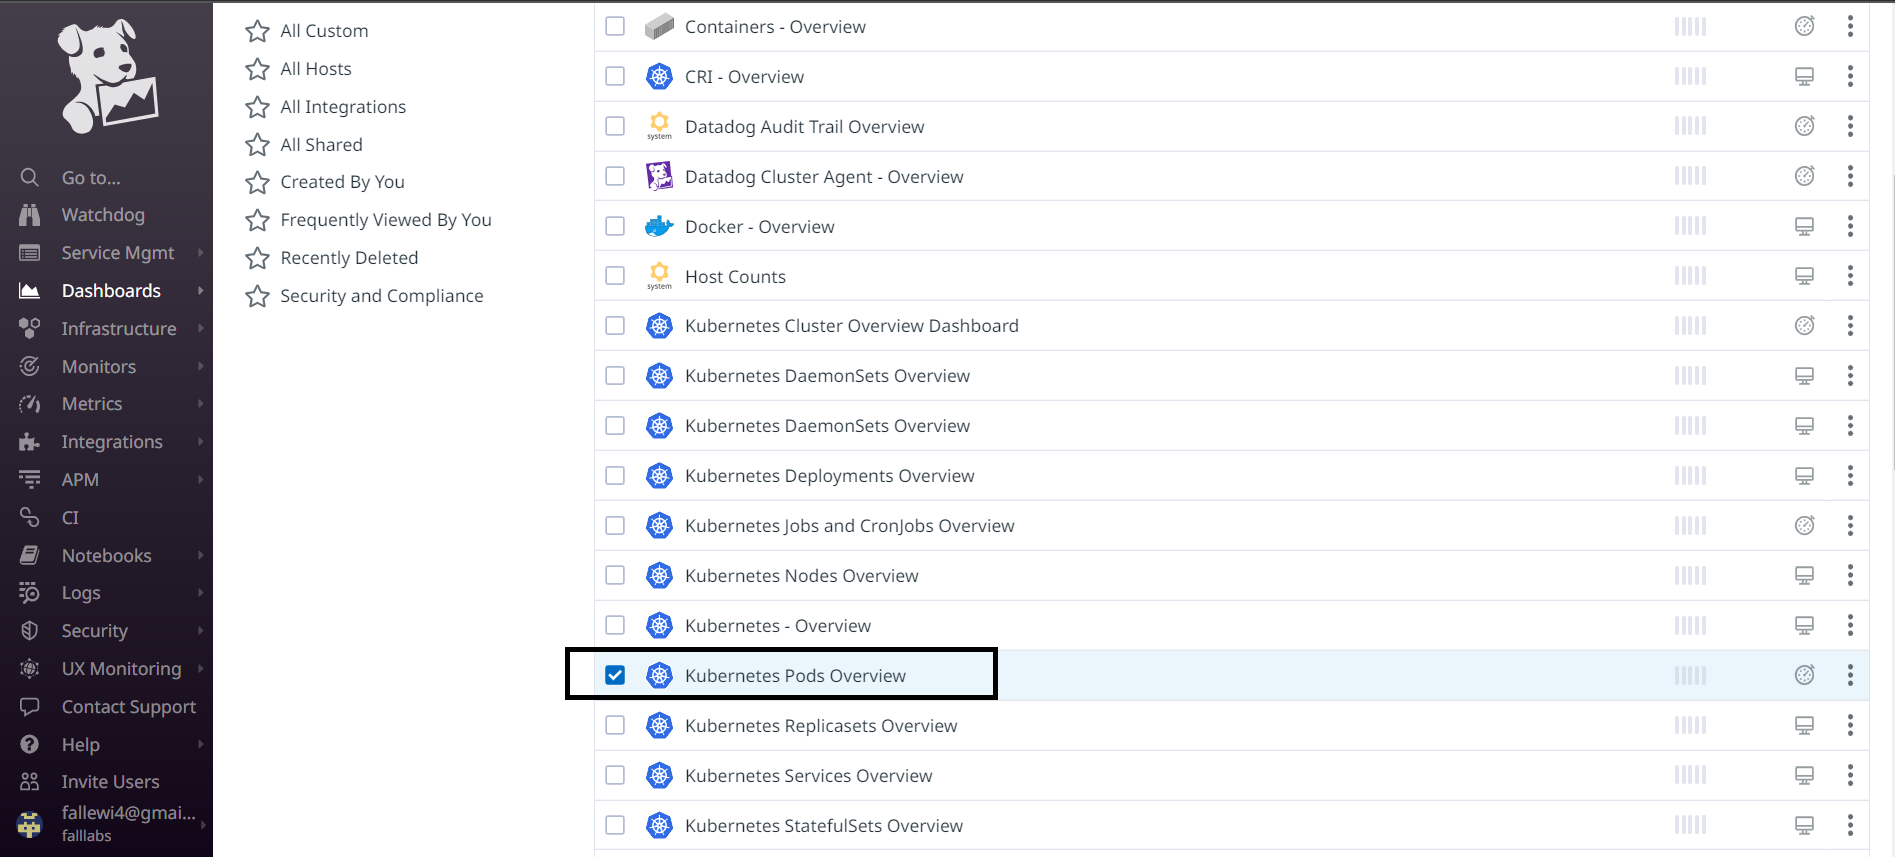
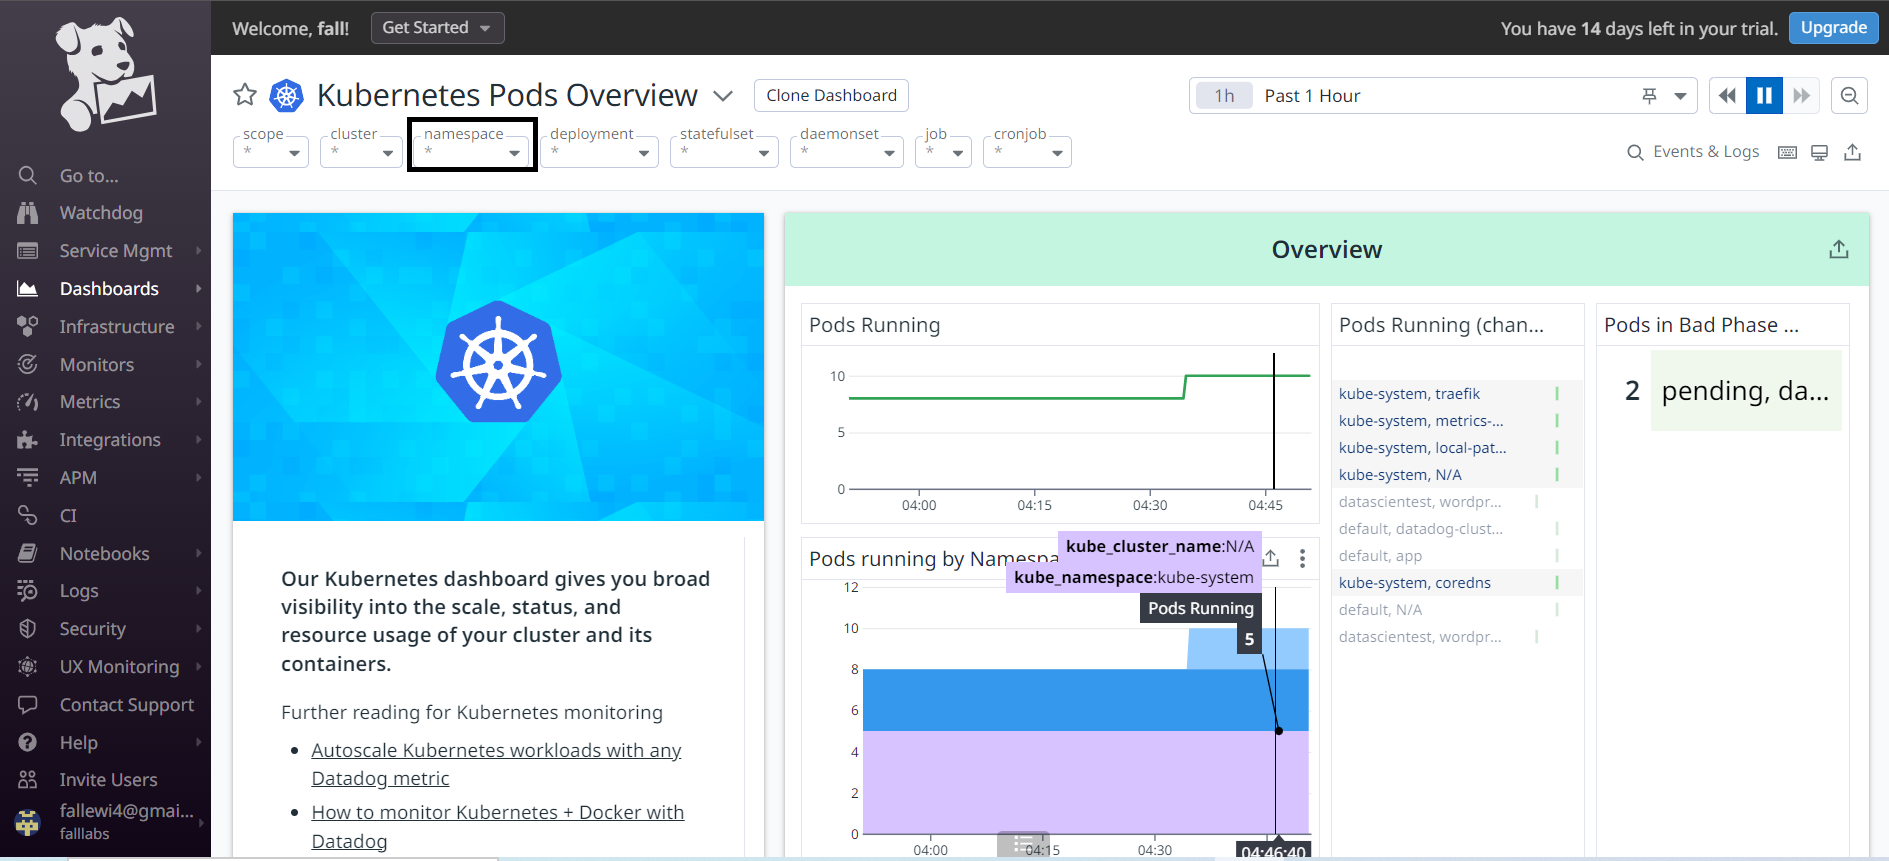
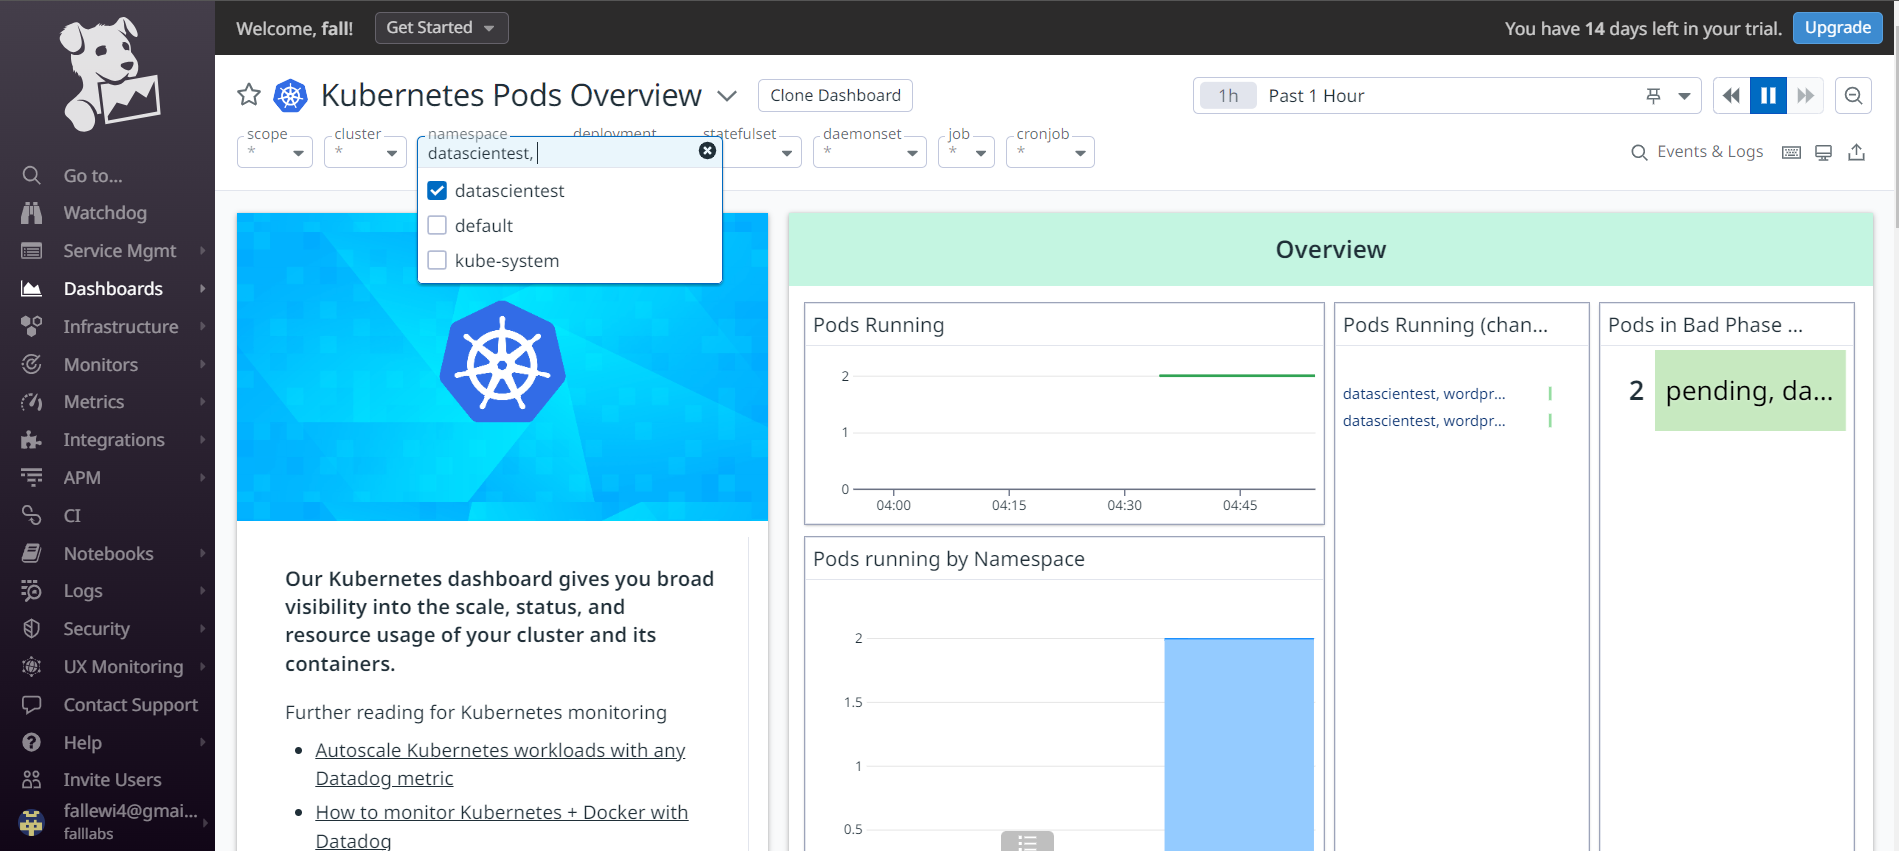
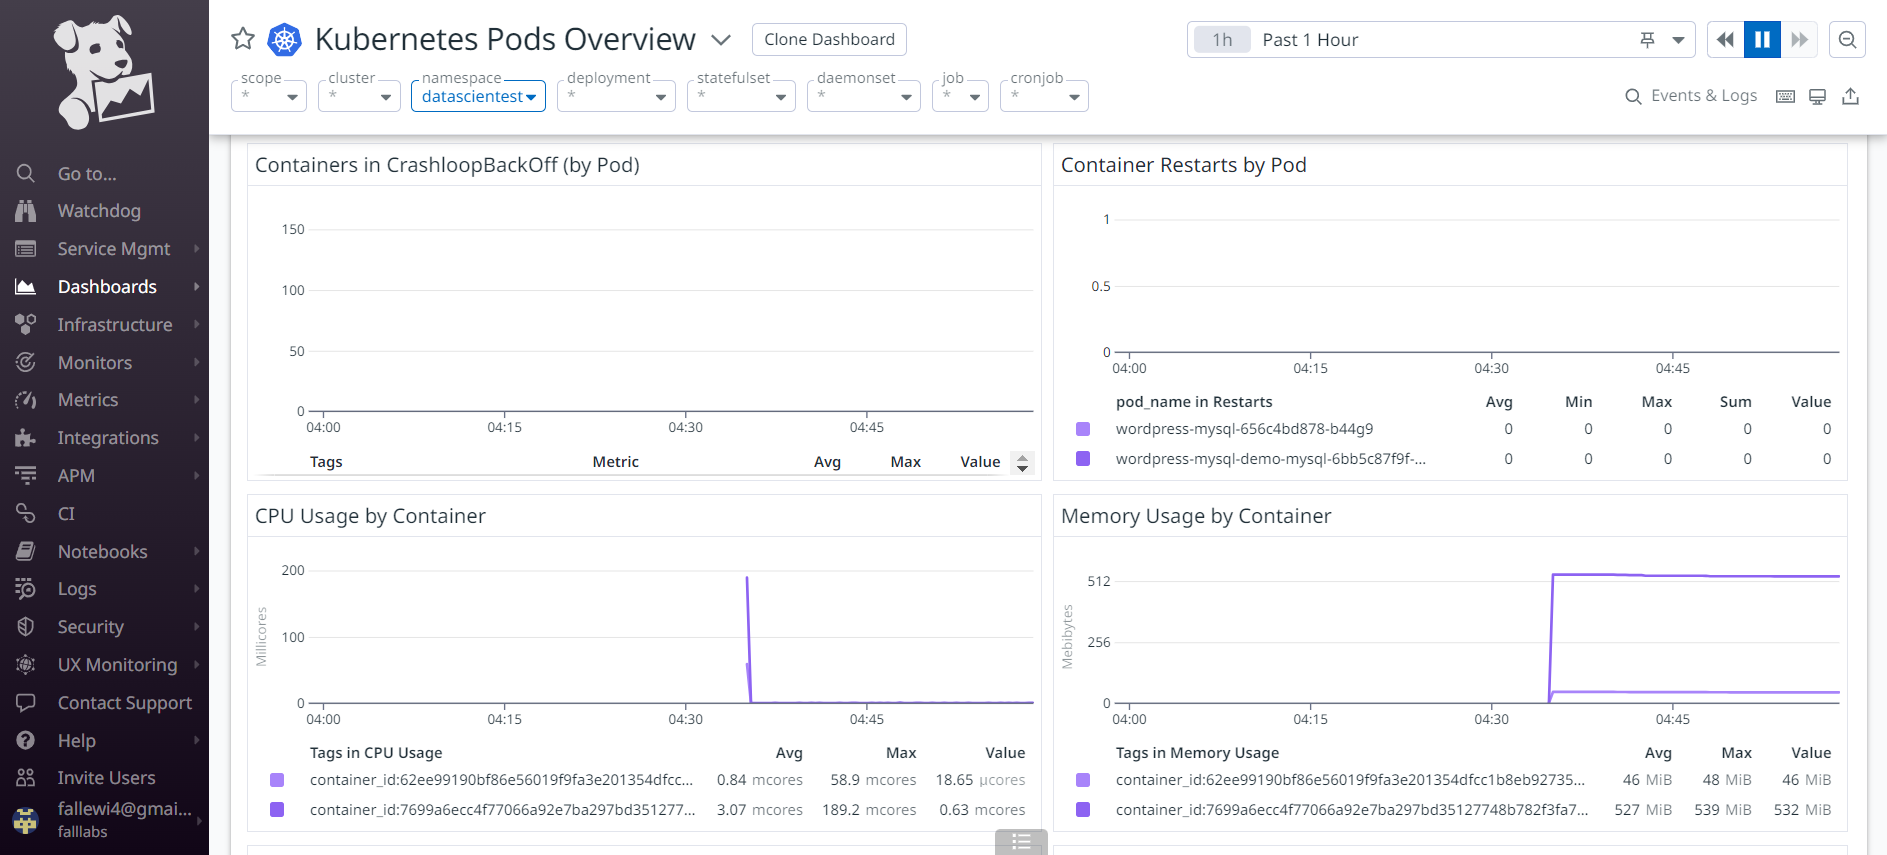
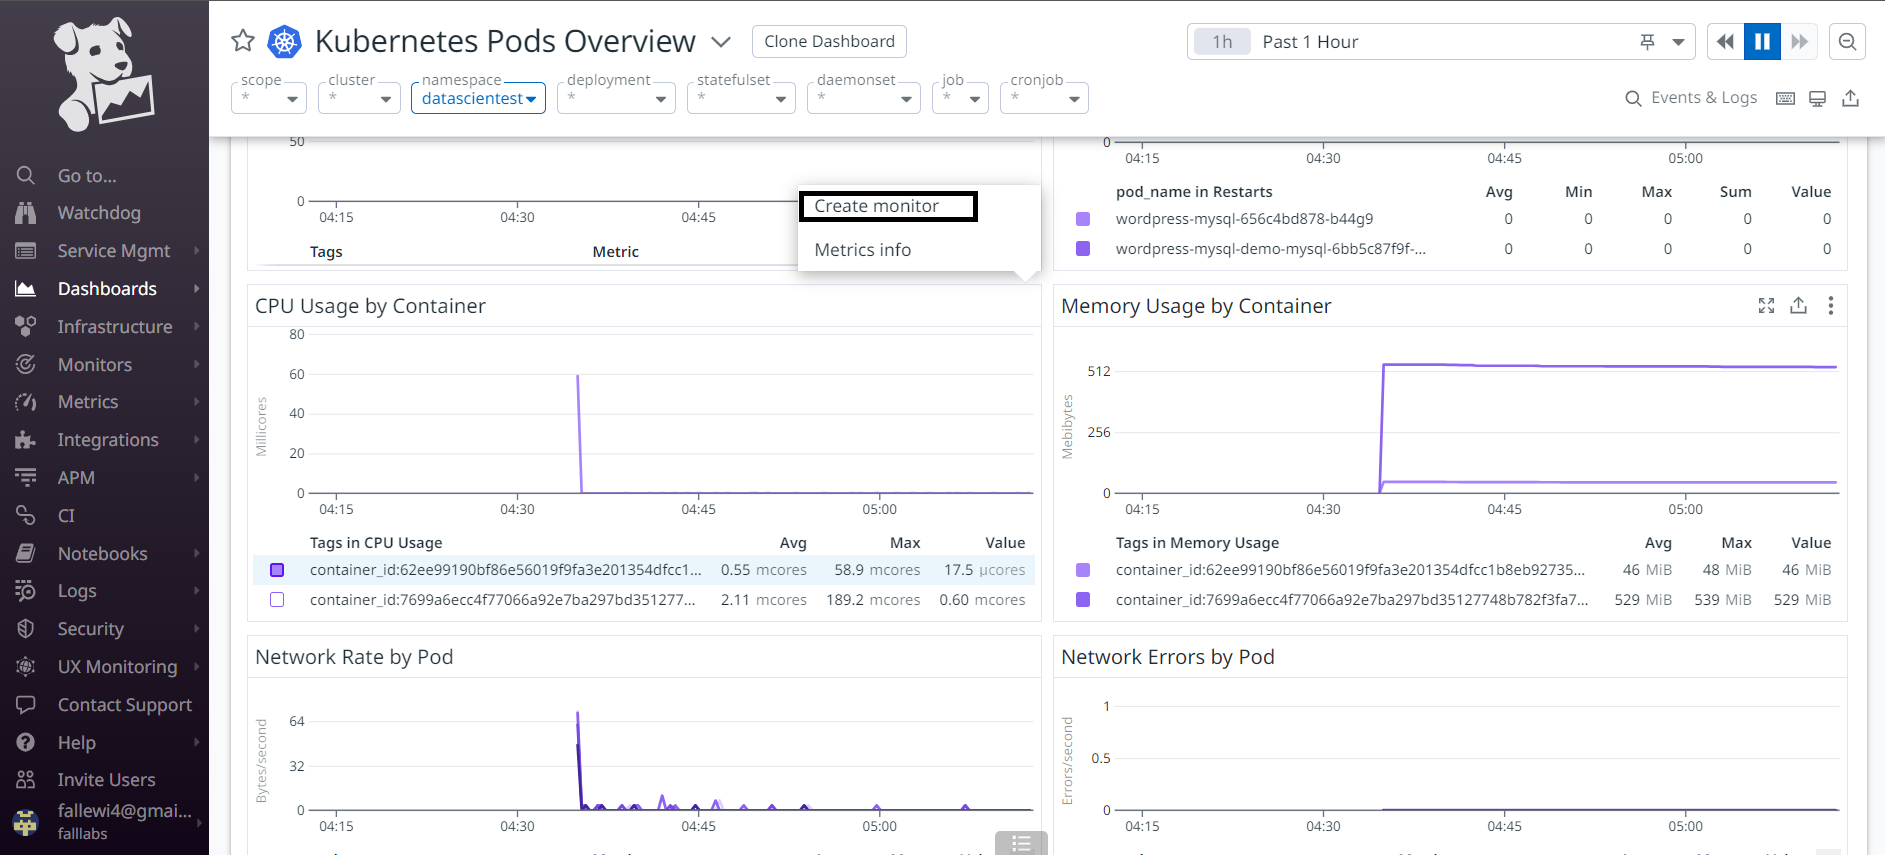
We arrive on the dashboard which allows us to see the list of Pods and their different resource consumption. We'll select the namespace drop-down menu to filter Pod values present only for the Namespace Datascientest.
On the Pods view below, we have resource consumptions of our Pods in the Namespace Datascientest.
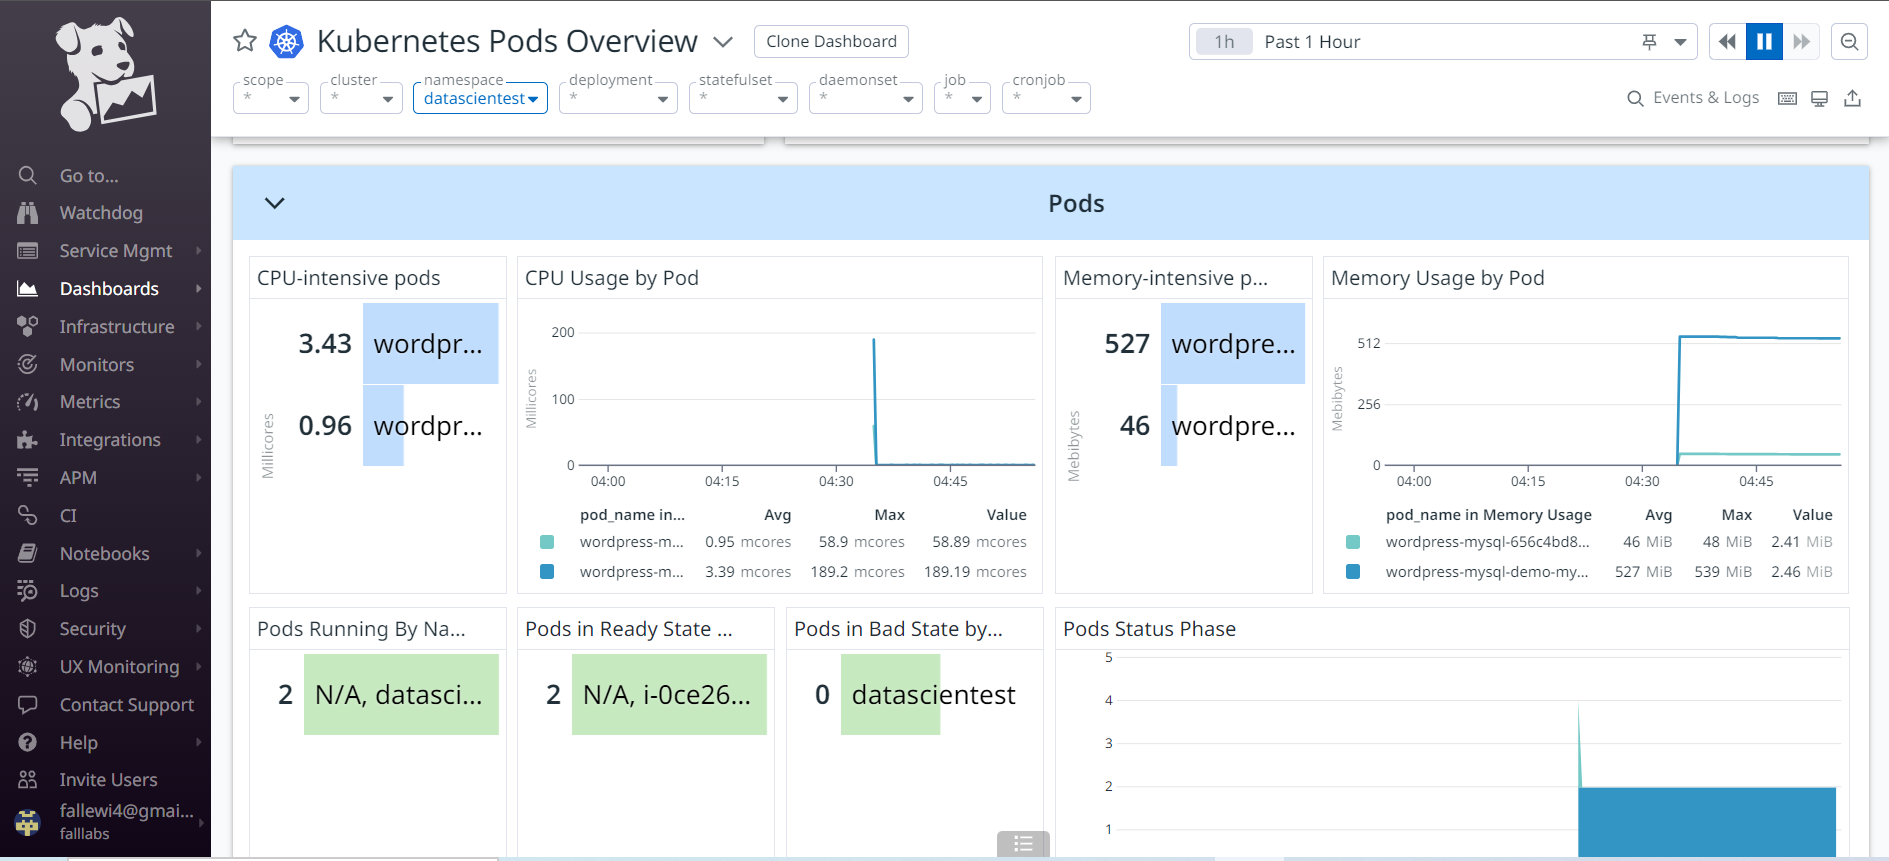
We also have status monitoring below for our Pods and containers to check the number of Pods in crashloopbackoff status, the number of containers that have restarted, container CPU and RAM consumption.
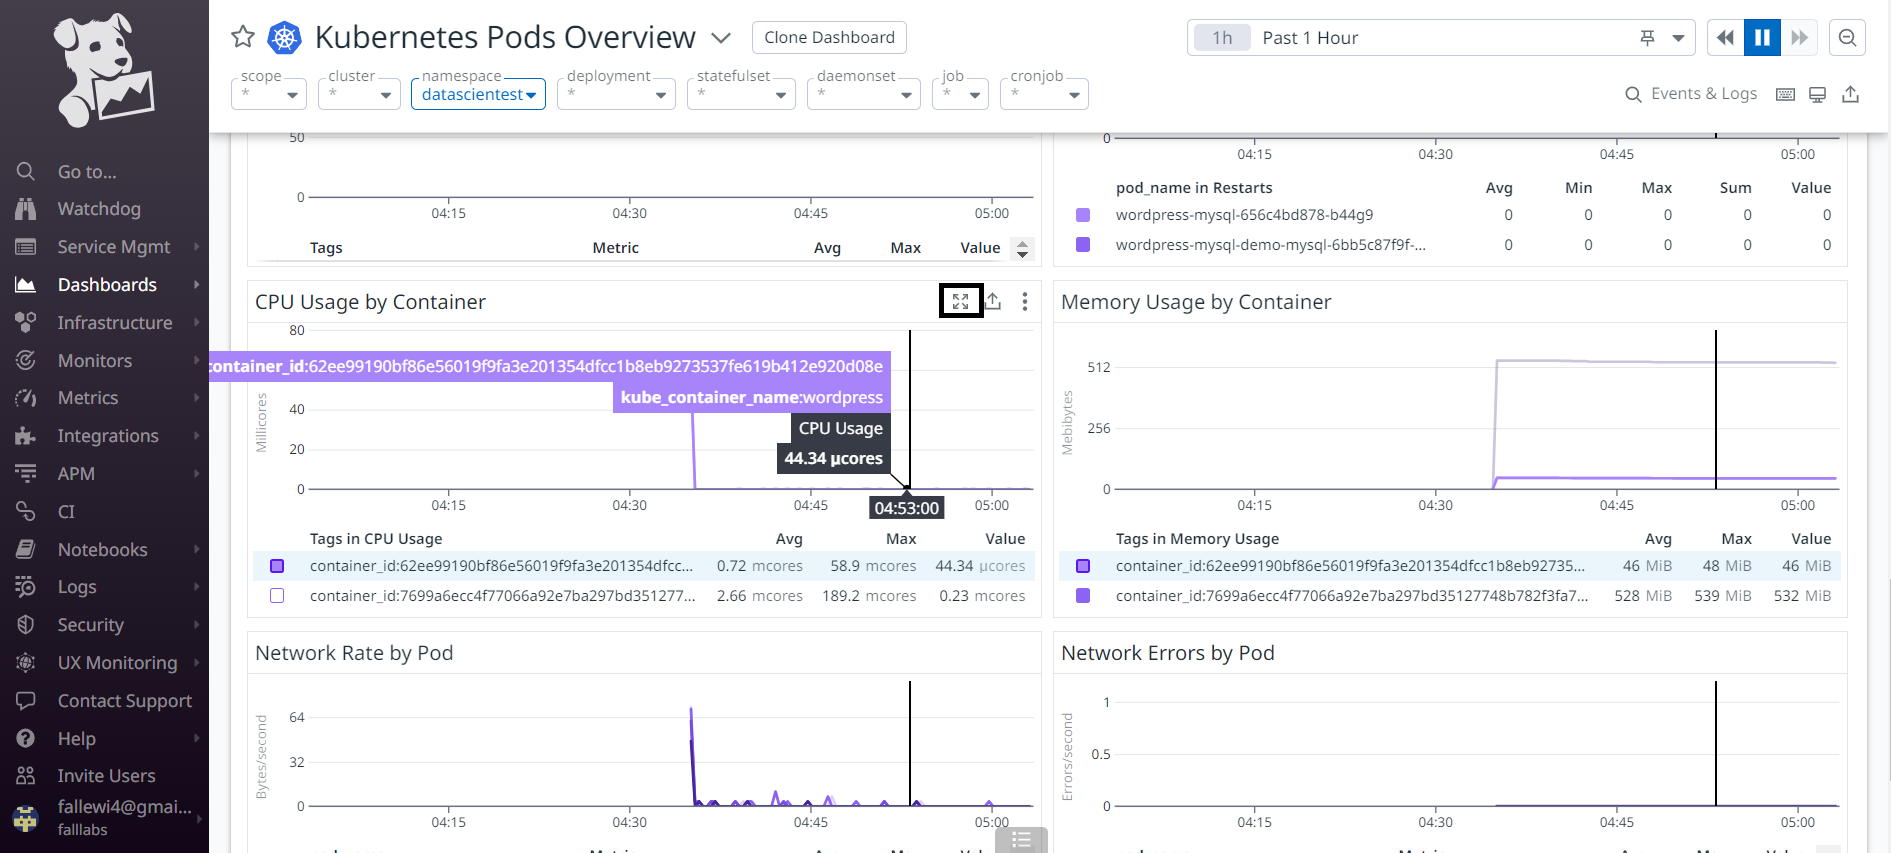
We can enlarge the graph of CPU consumption per container. We can place the cursor on the graph and enlarge it afterwards.
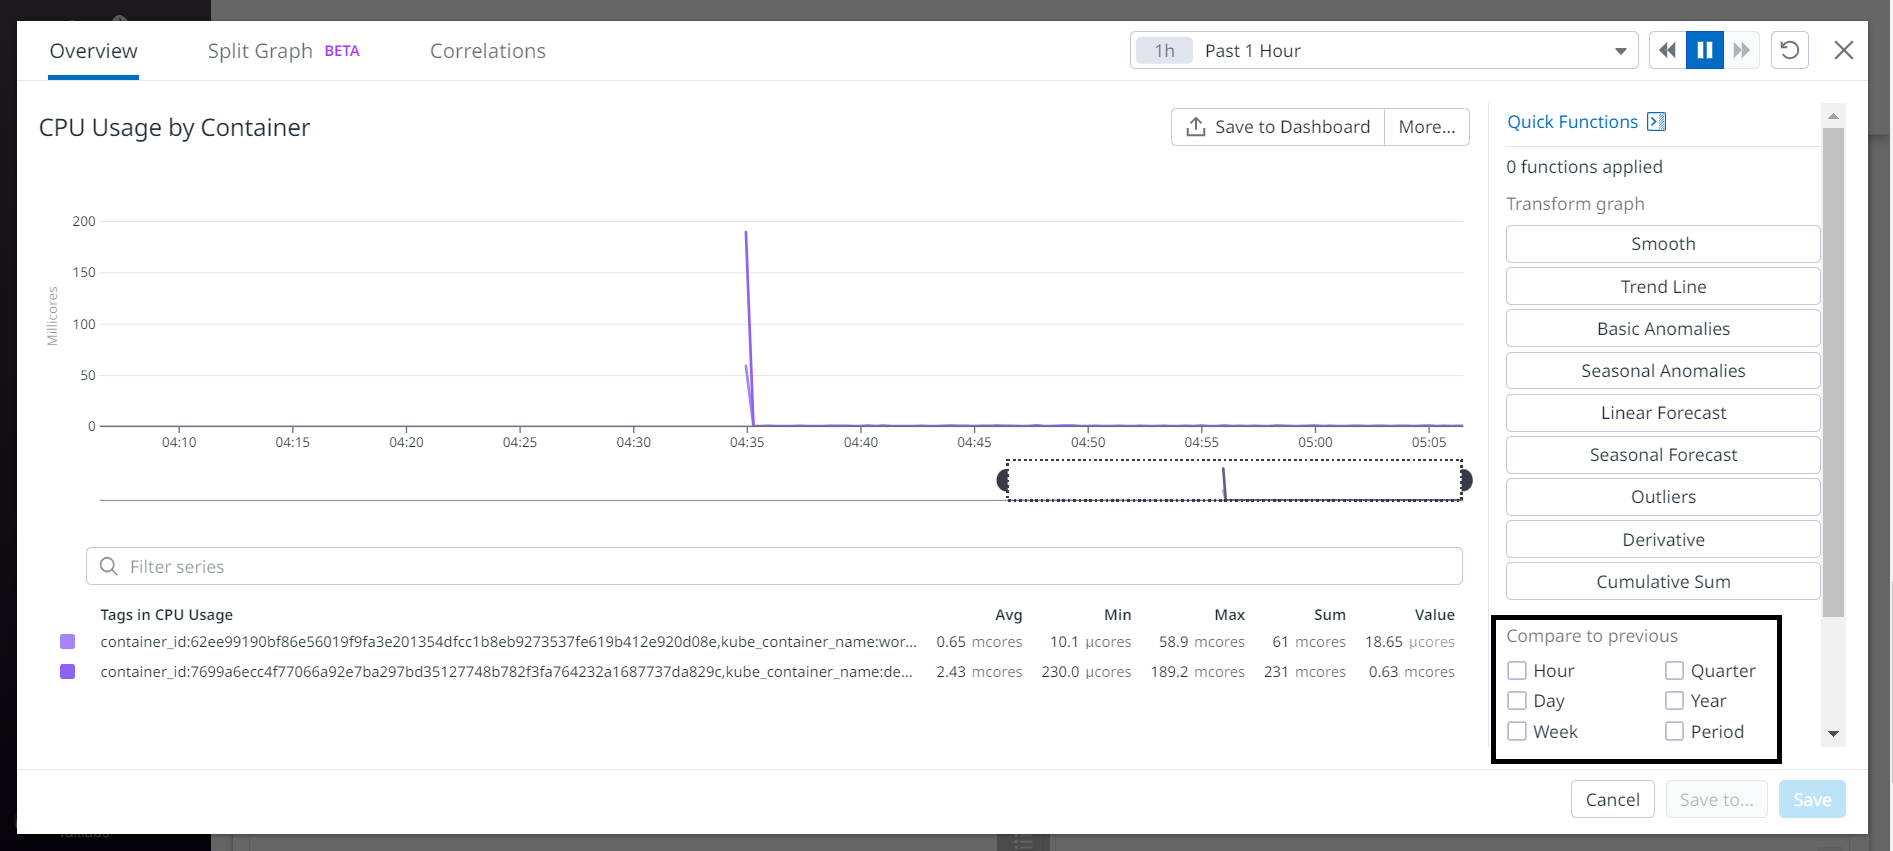
We have a full-screen view of the graph, and we have more detail in order to set up filters or even metric comparisons based on hours, days, periods etc.
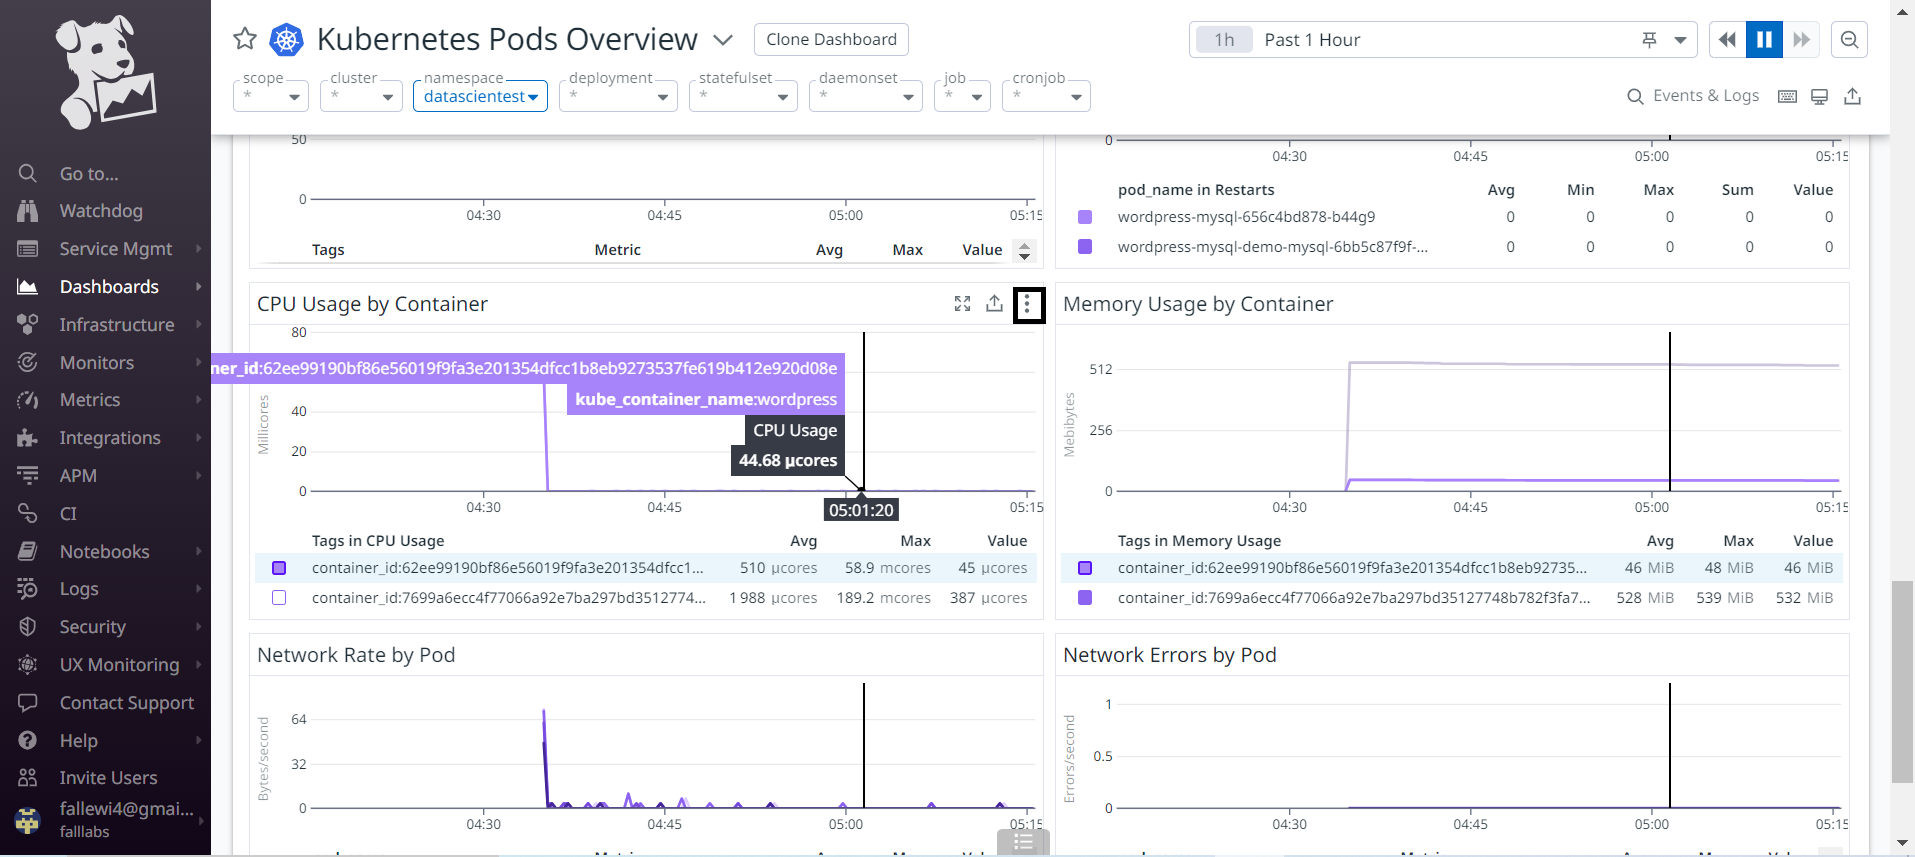
We can also return to the previous view to set up a CPU consumption alert for our wordpress container. Let's place the cursor on the container CPU consumption graph and click on the 03 little buttons.
Let's click on the Create Monitor button.
We are redirected to another window on which we need to set up our monitor configuration.
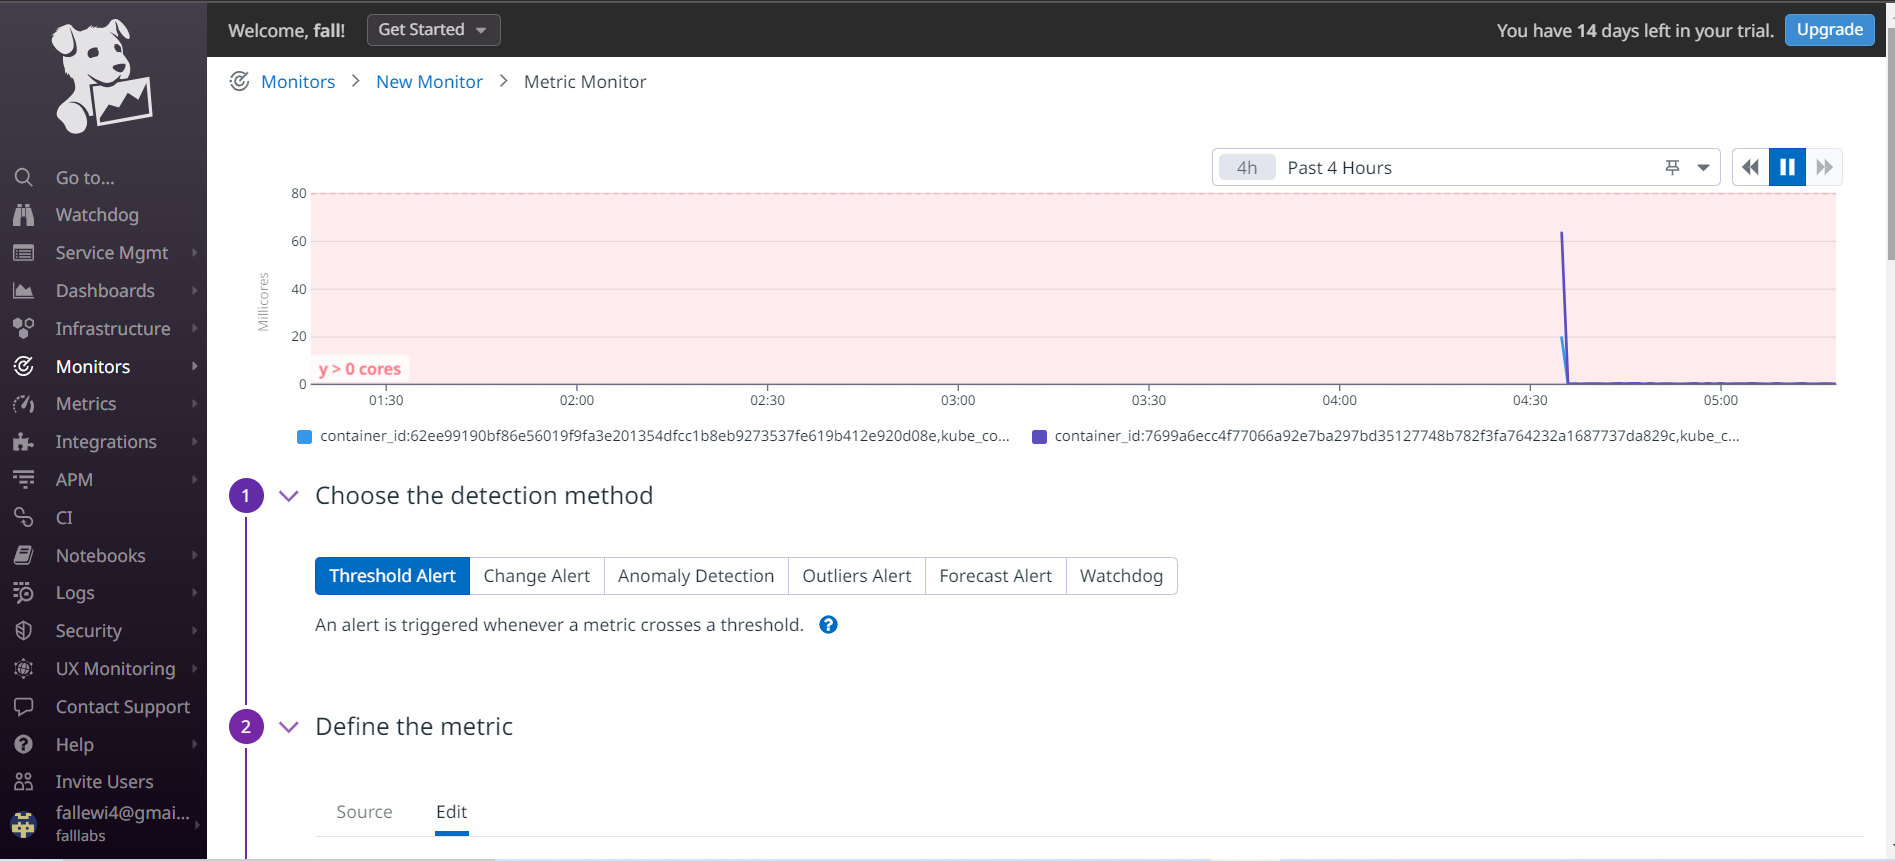
We arrive at a new page on which we can select several alert types. Let's select Threshold Alertand define below the define the metric field, we'll leave the default values.
in the from field a we also leave all values default.
Below on the Set Alert Conditions part, we define the threshold for which we'll be alerted to CPU usage for our containers. In the field, Alert Threshold we set the value 80 and in the Warning Threshold field, we set the value 60.

Here, in the defined metric, we have chosen in the metrics to be analyzed by Datadog kubernetes.cpu.usage.total of the current source on Cluster, and the value returned must be by container name. In the alert condition, we simply define that whenever the CPU consumption of one of our containers is greater than 80 cores, Datadog should generate an alert for us and save the parameters.
We can define messages for various conditions as follows in the Notify your team field:
In the
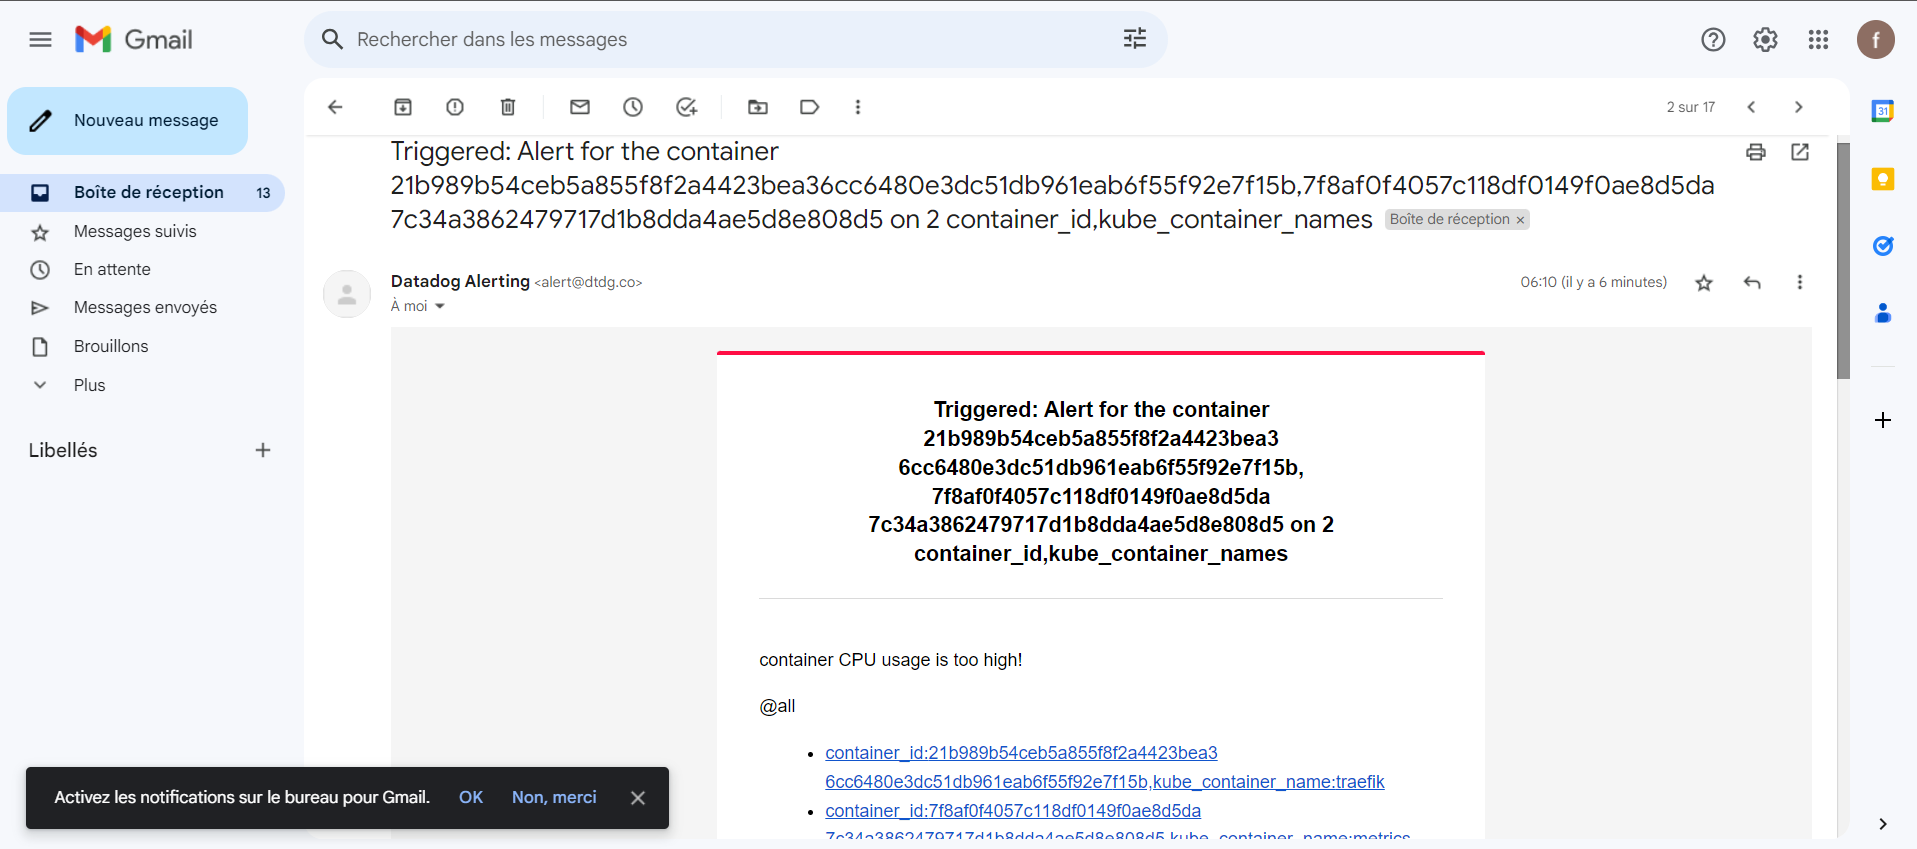
Editfield, we'll add the message:Alert for the container {{container_id.name}}For the message content, we'll use conditions so we can display different messages depending on the RAM condition.
{{#is_alert}} container CPU usage is too high! {{/is_alert}}to specify that CPU consumption is very high in the event of aalertmessage. This will be sent if the message type isAlert.{{#is_warning}} container CPU usage seems high{{/is_warning}}to specify that CPU consumption is in aWarningstate. This will be sent if it is aWarningtype message.{{#is_recovery}}container CPU usage is Ok {{/is_recovery}}to specify that all is well on the CPU usage side of the resource. This will be sent if the message type isRecovery.
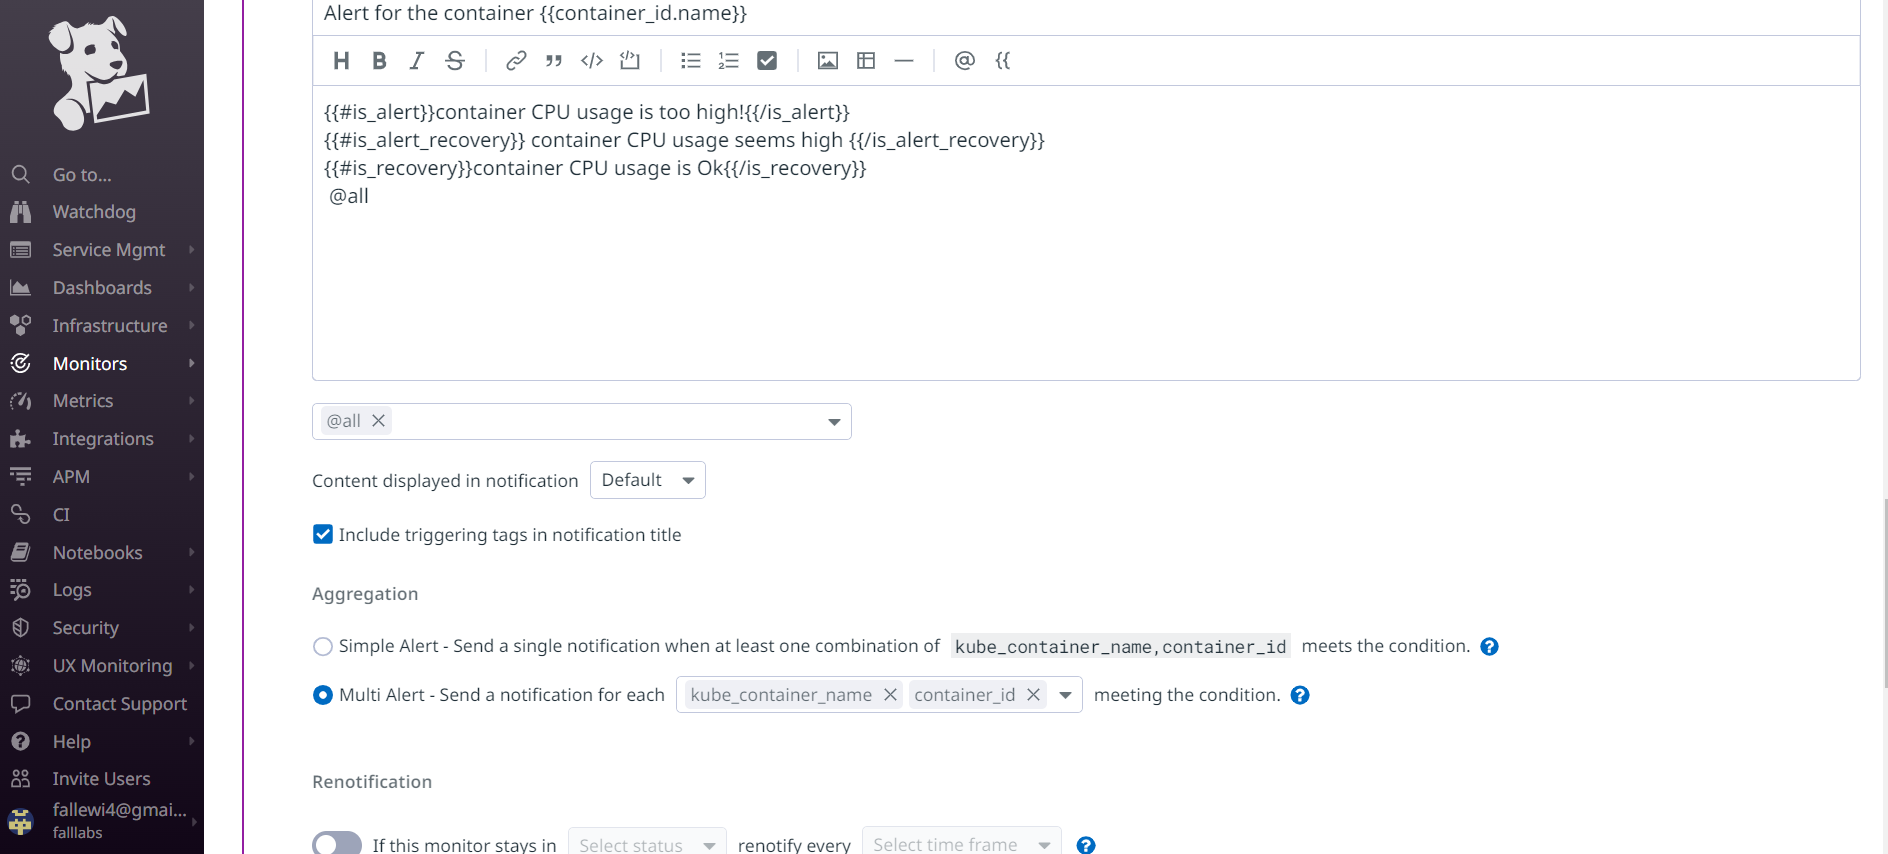
Let's then select @all from the drop-down menu that will notify each user we've added to our Datadog organization.We can leave the rest of the information as default and click the create button to create this new Monitor.
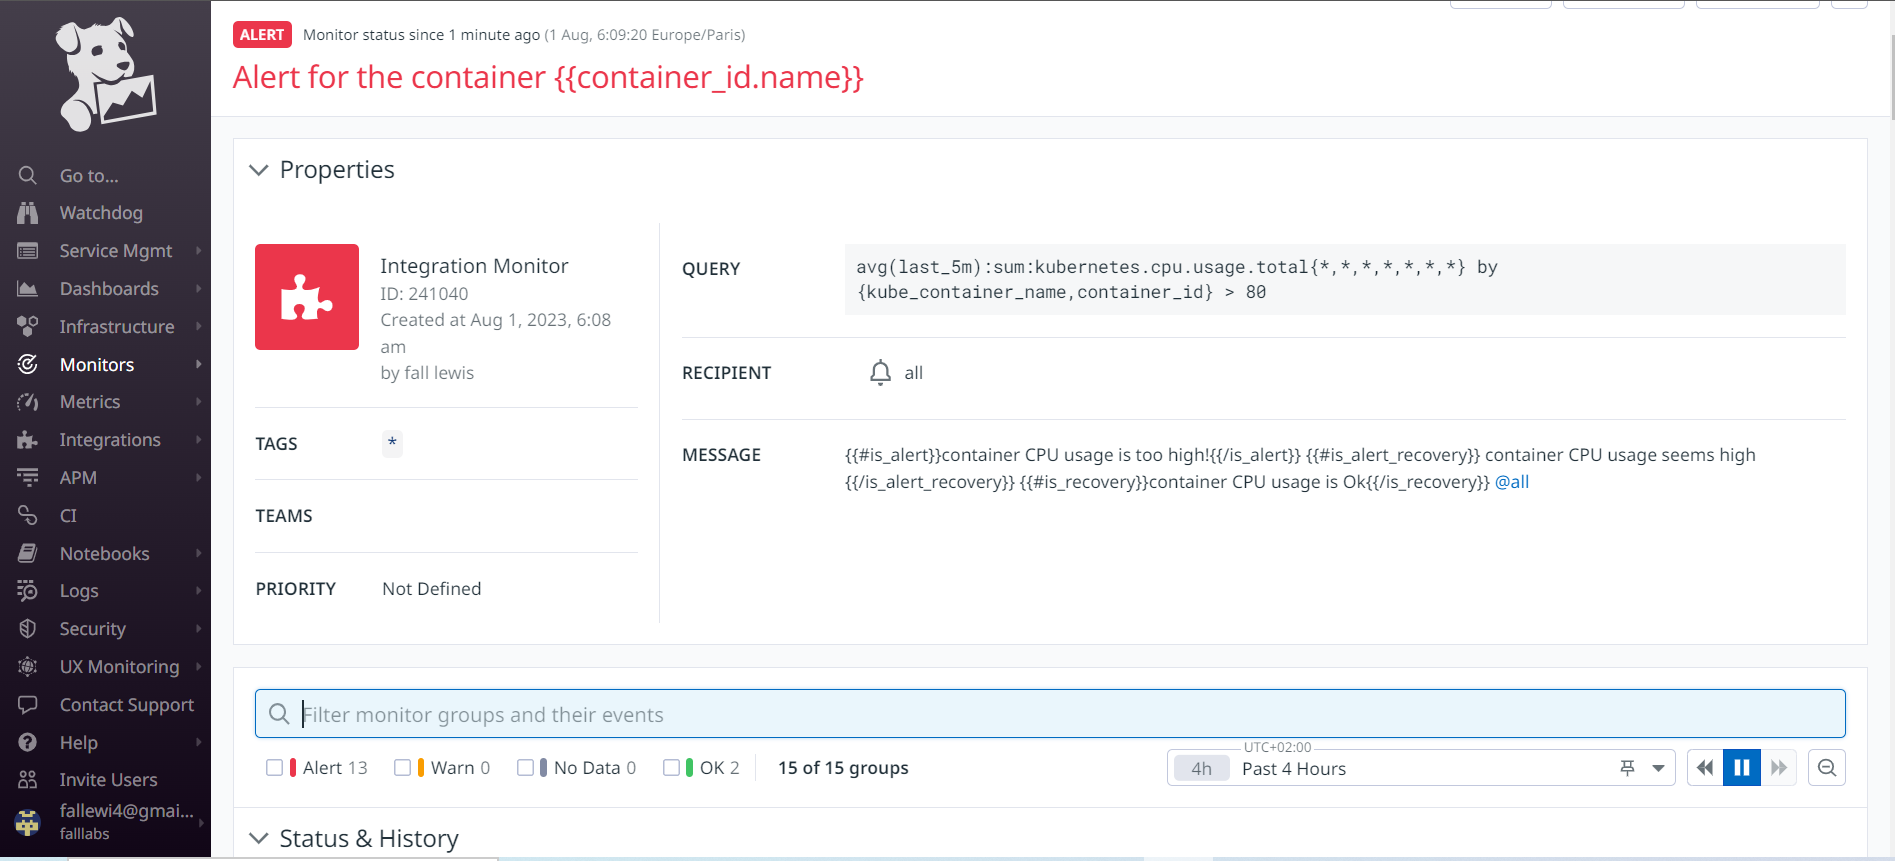
If the processor consumption of our containers is high, the monitor is in the alert state, the message is displayed in red color. Otherwise, the color is green.
We can see that several containers have exceeded the CPU consumption of 80 cores.
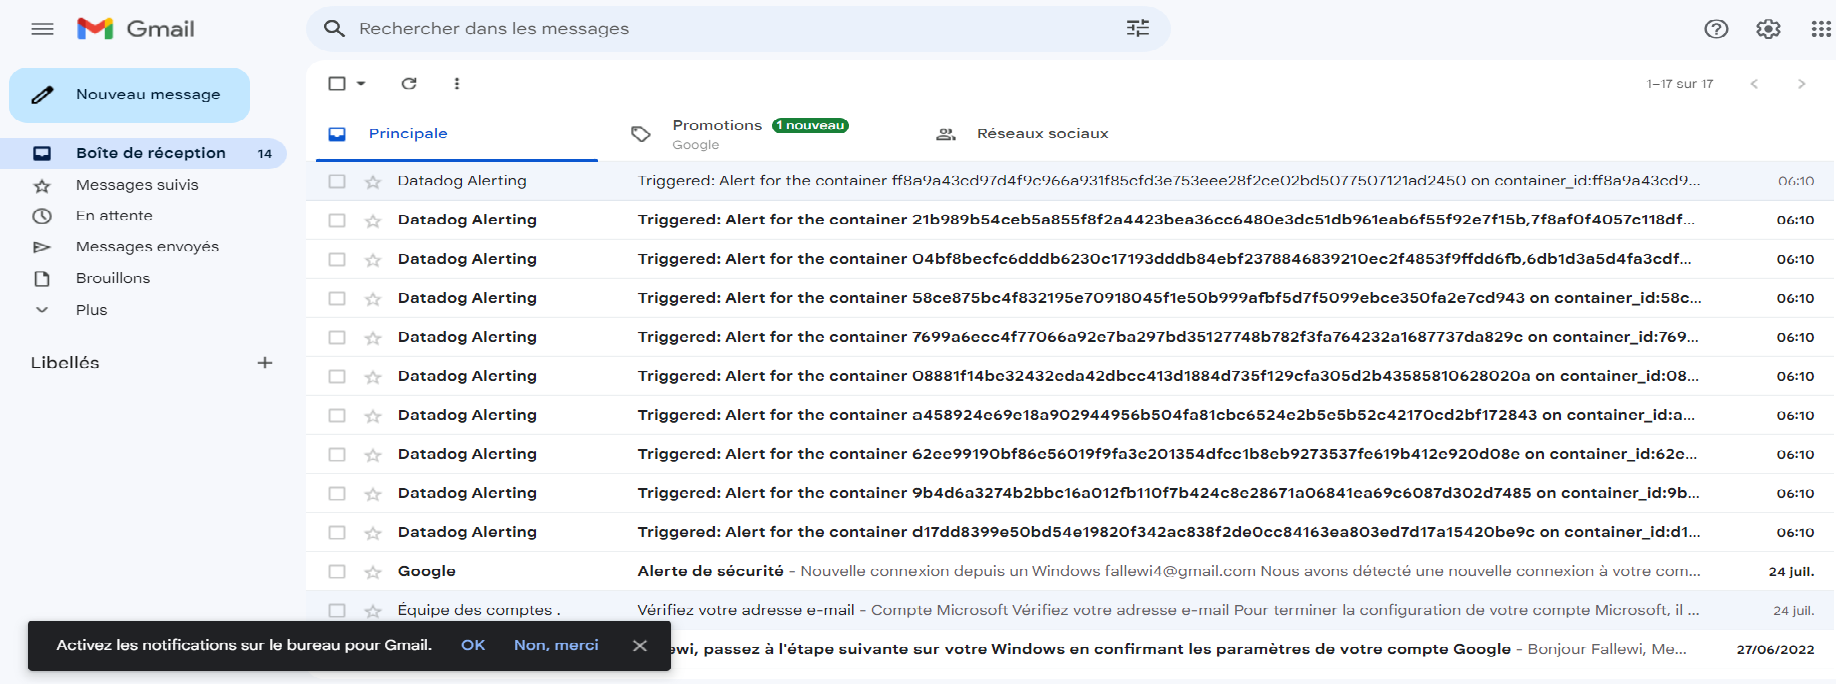
If we click on one of the emails, we'll see that we have a message in the form requested.
f - Monitoring as Code
f.1 - Presentation
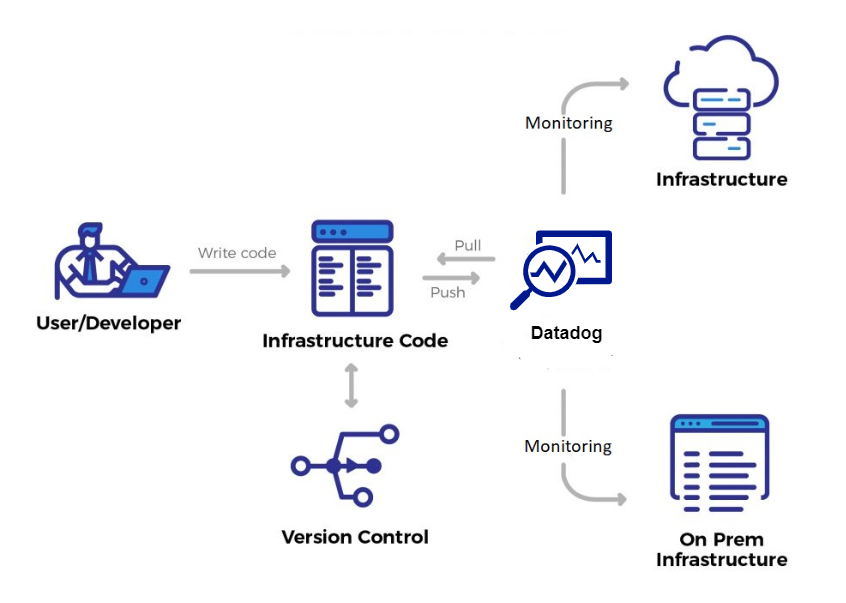
Over the past decade, we've seen a growing number of operations and development teams use a Infrastructure-as-code (IaC) process to provision cloud-based infrastructure. In this model, IaC tools such as CDK, Ansible, chef, puppet or Terraform are used to enable developers to code, deploy and manage cloud-based infrastructure, or to enable the configuration of numerous tools.
The advent of cloud services, and IaC tools has freed engineering teams from error-prone (and slow) manual infrastructure provisioning processes. The ability to code our infrastructure alongside our version-controlled application code has been a game-changer for many organizations.
As IaC becomes an increasingly valuable tool for infrastructure management, it's only natural that other parts of the ecosystem follow this philosophy, including the way testing and monitoring are carried out.
Similar to IaC, the concept of Monitoring as code (MaC) allows us to describe a monitoring infrastructure in code form. Today, many DevOps teams employ MaC using some of the aforementioned IaC tools such as Terraform, to create, run and manage their browser and API monitoring regimes. Monitoring controls can be defined in JavaScript, TypeScript or HCL, then these can be validated with application code.
The modern Mac is maturing fast; it doesn't even require traditional IaC tools but activates MaC without additional tools. Modern platforms enable this by providing CLIs to achieve it. Making monitoring an integral and complementary part of your code base has many advantages and benefits.
f.2 - Terraform
Terraform is one of the most popular infrastructure-as-code (IaC) tools, used by DevOps teams to automate infrastructure tasks. It is used to automate the provisioning of your cloud resources. Terraform is a cloud-independent open source provisioning tool developed by HashiCorp and written in the GO language. Terraform is HashiCorp's open source solution for Infrastructure-as-code (IaC). With Terraform, we can declaratively manage our infrastructure in HCL (Hashicorp Config Language). With HCL as a declarative language, this means we declare only the desired state, rather than the steps to get there.
Creating an infrastructure as code has several advantages that we can also exploit for observability with Datadog. For a start, we have the configuration in code form instead of locking it in Datadog's user interface. By managing our configuration in code, we can easily replicate it on other Datadog accounts. We can also use version control to manage our Datadog configuration and even deploy from a CI/CD pipeline.
Terraform can be used with hundreds of providers, including popular cloud services such as AWS, Azure and GCP, as well as widely used services such as Kubernetes, VMWare and Datadog. The Datadog provider can be used to create and manage Datadog resources such as monitors, bringing all the benefits of infrastructure as code to our Datadog deployment.
f.3 - Datadog Provider
Terraform Datadog Provider
To use terraform's datadog provider, we first need to set up our Datadog API credentials, as we need to provide our Datadog API key and application key to Terraform to authenticate. We'll start by creating a directory called datadog-agent.
mkdir datadog-agent
cd datadog-agent
We can create a file named datadog.tf containing the following code:
terraform {
  required_providers {
    datadog = {
      source = "DataDog/datadog"
    }
  }
}
# Configure the Datadog provider
provider "datadog" {
  api_key = var.datadog_api_key
  app_key = var.datadog_app_key
  api_url = var.datadog_api_url
}
Consult more information about the Datadog provider on the official Terraform documentation website .
We're going to create a new file named helm-datadog.tf that will allow us to define the Helm provider for terraform and deploy through this provider the Datadog agent within the Namespace datascientest-monitoring of our Kubernetes cluster. We'll fill it with the following content:
# helm provider
provider "helm" {
  kubernetes {
    config_path = "~/.kube/config"
  }
}
# deploy a helm release for datadog agent
resource "helm_release" "datadog_agent" {
  name = "datadog-agent"
  chart = "datadog"
  repository = "https://helm.datadoghq.com"
  version = "3.10.9"
  namespace = kubernetes_namespace.datascientest-monioring.id

# set a custom in modifying de default value on the values.yaml file. in command line, we can specify "--set datadog.apikey=xxxxxxxxxxxx"
  set_sensitive {
    name = "datadog.apiKey"
    value = var.datadog_api_key
  }

# in command line, we can specify "--set datadog.site=xxxxxxxxxxxx"
  set {
    name = "datadog.site"
    value = var.datadog_site
  }

# in command line, we can specify "--set datadog.log.enabled=true"
  set {
    name = "datadog.logs.enabled"
    value = true
  }

# in command line, we can specify "--set datadog.log.enabled=true"
  set {
    name = "datadog.logs.containerCollectAll"
    value = true
  }

  set {
    name = "datadog.leaderElection"
    value = true
  }

  set {
    name = "datadog.collectEvents"
    value = true
  }

  set {
    name = "clusterAgent.enabled"
    value = true
  }

  set {
    name = "clusterAgent.metricsProvider.enabled"
    value = true
  }

  set {
    name = "networkMonitoring.enabled"
    value = true
  }

  set {
    name = "systemProbe.enableTCPQueueLength"
    value = true
  }

  set {
    name = "systemProbe.enableOOMKill"
    value = true
  }

  set {
    name = "securityAgent.runtime.enabled"
    value = true
  }

  set {
    name = "datadog.hostVolumeMountPropagation"
    value = "HostToContainer"
  }
}

# creation of the namespace called datascientest-monioring where we will deploy the Datadog agent
resource "kubernetes_namespace" "datascientest-monioring" {
  metadata {
    name = "datascientest-monioring"
  }
}
We'll also create a file called variables.tf to define the variables used in our Terraform code.
Our variables.tf file will have the following contents:
variable "datadog_api_key" {
  type = string
  description = "Datadog API Key used for the deployment"
  value = "xxxxxxxxxxxxxxxxxxxxxxxxxxxxxxx" # you have to replace this value with your datadog api key
}

variable "datadog_app_key" {
  type = string
  description = "Datadog Application Key"
   value = "xxxxxxxxxxxxxxxxxxxxxxxxxxx" # you have ti replace this value with your datadog application key
}

variable "datadog_site" {
  type = string
  description = "Datadog Site URL"
  default = "us5.datadoghq.com"
}

variable "datadog_api_url" {
  type = string
  description = "Datadog API URL"
  default = "https://api.datadoghq.com"
}
e.4 - Installing terraform
We're now going to install terraform so that we can set up our configuration.
Let's start by installing terraform within our Datascientest machine. We'll be able to use the apt packet manager to install terraform:
sudo snap install terraform --classic
This Helm configuration requires your Datadog API and application keys. Set these values as environment variables in your terminal.
Next, let's export our environment variables to set up our configurations. Let's run the following command, replacing it <API-Key>with our Datadog API key we registered earlier.
export TF_VAR_datadog_api_key="<API-Key>"
We'll do the same by replacing <App-Key>with our Datadog application key that we registered earlier.
export TF_VAR_datadog_app_key="<App-Key>"
We'll do the same by defining the Datadog site previously used to create our account.
export TF_VAR_datadog_site="us5.datadoghq.com"
We'll do the same by defining the Datadog API URL used previously to create our account.
$ export TF_VAR_datadog_api_url="https://api.us5.datadoghq.com"
f.3 - Deploying the Datadog agent
We've now installed terraform, it's high time to deploy our first resources.
To do this, we'll use the init command followed by the apply command to actually create our resources.
terraform init
Output display:
Initializing the backend...

Initializing provider plugins...
- Finding latest version of datadog/datadog...
- Finding latest version of hashicorp/helm...
- Finding latest version of hashicorp/kubernetes...
- Installing hashicorp/kubernetes v2.23.0...
- Installed hashicorp/kubernetes v2.23.0 (signed by HashiCorp)
- Installing datadog/datadog v3.29.0...
- Installed datadog/datadog v3.29.0 (signed by a HashiCorp partner, key ID FB70BE941301C3EA)
- Installing hashicorp/helm v2.11.0...
- Installed hashicorp/helm v2.11.0 (signed by HashiCorp)

Partner and community providers are signed by their developers.
If you'd like to know more about provider signing, you can read about it here:
https://www.terraform.io/docs/cli/plugins/signing.html

Terraform has created a lock file .terraform.lock.hcl to record the provider
selections it made above. Include this file in your version control repository
so that Terraform can guarantee to make the same selections by default when
you run "terraform init" in the future.

Terraform has been successfully initialized!

You may now begin working with Terraform. Try running "terraform plan" to see
any changes that are required for your infrastructure. All Terraform commands
should now work.

If you ever set or change modules or backend configuration for Terraform,
rerun this command to reinitialize your working directory. If you forget, other
commands will detect it and remind you to do so if necessary.
Once this is done, we can validate our syntax as follows:
terraform validate
Output display:
Success! The configuration is valid.
We can then apply this configuration to have our datadog agent deployed, thanks to Terraform.
terraform apply --auto-approve
f.4 - Deploying our resources
Once our configurations are in place, we need to define resources that will be monitored by the agent so that we can retrieve metrics from these resources.
We'll then create a resources.tf file to declare our various resources to be monitored within the Kubernetes cluster. We'll add the following content:
# creation of the namespace of the resource
resource "kubernetes_namespace" "datascientest" {
  metadata {
    name = "datascientest"
  }
}

# creation of a deployment named datascientest-deploy
resource "kubernetes_deployment" "datascientest-deploy" {
  metadata {
    name = var.application_name
    namespace = kubernetes_namespace.datascientest.id
    labels = {
      app = var.application_name
    }
  }

  spec {
    replicas = 3

    selector {
      match_labels = {
        app = var.application_name
      }
    }

    template {
      metadata {
        labels = {
          app = var.application_name
        }
      }

      spec {
        container {
          image = "nginx:latest"
          name = var.application_name
        }
      }
    }
  }
}

# creation of a service named datascientest-service
resource "kubernetes_service" "datascientest-service" {
  metadata {
    name = var.application_name
    namespace = kubernetes_namespace.datascientest.id
  }
  spec {
    selector = {
      app = kubernetes_deployment.datascientest-deploy.metadata[0].labels.app
    }
    port {
      port = 8080
      target_port = 80
    }
    type = "NodePort
  }
}
this code allows us to declare the Namespace used to create our resource, a deployment and a service to expose our application. The content is fairly self-explanatory, which is why we won't go into detail about the resources created.
Now let's add the following content to the variables.tf file in order to define a default value for the application_name variable.
variable "application_name" {
  type = string
  description = "Name of the application"
  default = "datascientest"
}
We can now validate our configuration:
terraform validate
Output display:
Success! The configuration is valid.
We can now apply our configuration.
terraform apply --auto-approve
Once this configuration has been set up, we can run some checks.
kubectl get namespaces
Output display:
datascientest Active 3m
We can check our deployment.
kubectl get deployment -n datascientest
Output display:
NAME READY UP-TO-DATE AVAILABLE AGE
datascientest-k8S 3/3 3 3 3m
- f.5 Using Terraform to create Datadog monitors
All the benefits of Infrastructure as Code can be applied to creating Datadog monitors in Terraform. This includes version-controlled configuration, observability, automation, consistency and repeatability, scalability and the ability to integrate Datadog configurations with other parts of your infrastructure.
Configuring Datadog resources such as dashboards, alerts and monitors in Terraform can help you manage Datadog more effectively and efficiently.
One of the main benefits of managing our Datadog deployment with Terraform is the additional infrastructure drift detection Terraform provides when you run a terraform plan or terraform apply.
Any changes to our Datadog infrastructure that are not defined in our code and have been made manually can be detected, helping to keep our infrastructure in the desired state, making it easier to identify and fix any configuration issues.
We can now create the file that will describe the monitor to be installed for our Kubernetes cluster and the alert settings to be implemented.
We can create the file kubernetes-monitor.tf with the following contents:
resource "datadog_monitor" "datascientest-monitor" {
  name = "Kubernetes Pod Health"
  type = "metric alert"
  message = "Kubernetes Pods are not in an optimal health state. Notify: @operator"
  escalation_message = "Please investigate the Kubernetes Pods, @operator"

  query = "max(last_1m):sum:kubernetes.containers.running{short_image:datascientest-k8S} <= 1"

  monitor_thresholds {
    ok = 3
    warning = 2
    critical = 1
  }

  notify_no_data = true

  tags = ["app:datascientest-k8S", "env:demo"]
}
Some explanations:
The resourcedatadog_monitor.datascientest-monitor notifies based on the health status of the NGINX application. The query argument is used to define how Datadog communicates with pods.
- If all three pods are operational, the status of our Datadog monitor indicates OK, a sort of all's well.
- If one of the pods fails, the status of your Datadog monitor will change to Warning, just to make it clear that something is going wrong in our application.
- If several pods fail, the status of your Datadog monitor will change to Alert, so we'll be alerted accordingly.
To apply this configuration, which we could add directly into the code of our file, we have the terraform apply command.
terraform apply --auto-approve
