Prometheus - How to use Prometheus ?
 Stopped
Prometheus
2. How to use Prometheus ?
So far, we have only seen how to use Prometheus in a self monitoring environment : there was no service to really monitor. In this part, we will see how to use Prometheus to monitor different services.
Remember that Prometheus is based on a PULL model : it will not look for the information that you want to get but it will scrape information that is provided by the service. Therefore those services need to make this information accessible.
In the previous parts, we have seen that Prometheus writes information on the 9090 port of the host machine, at the /metrics endpoint.
There are four ways of collecting data from a service:
- Native export : the service exposes natively the metrics (for example Prometheus).
- Direct instrumentation : the code of the service contains directly the information to display using a client library.
- Using Exporters : a daemon is running alongside the service you want to monitor and provides the information.
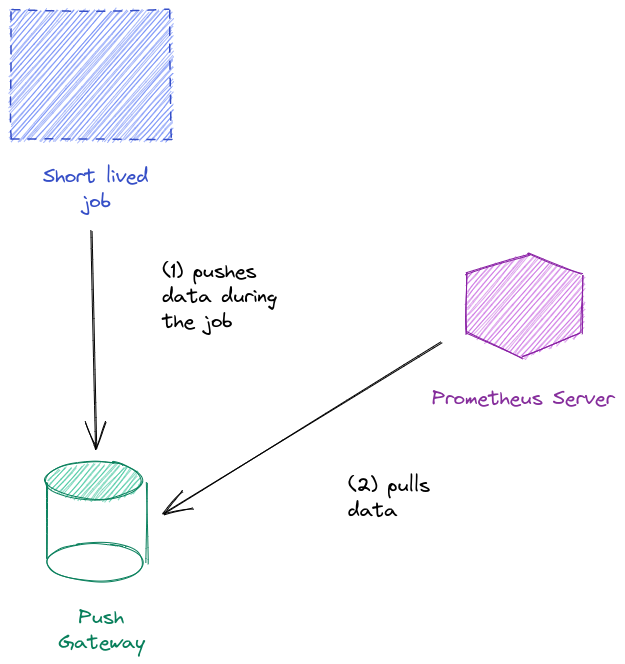
- Push Gateway : this daemon is used for ephemeral jobs: you can push some text to it and it relays the metrics to the Server.
Monitoring a machine
In this part, we will see how to monitor a server. This will allow us to get information on the capacity, the memory or CPU usage, the temperature of the server... This is very important especially if you administrate a cluster of machines.
There are several way to do this but one of the easiest way to do this is to use an Exporter. We will use the official Node exporter. Its documentation is available here.
We have to download and install The Exporter and put into the /home/ubuntu/node_exporter folder.
We have to run the following commands :
wget https://github.com/prometheus/node_exporter/releases/download/v1.0.1/node_exporter-1.0.1.linux-amd64.tar.gz
tar -xvf ~/node_exporter-1.0.1.linux-amd64.tar.gz
mv ~/node_exporter-1.0.1.linux-amd64 ~/node_exporter
Now, you have just to run it :
node_exporter/node_exporter
You should see that this process is running on the port 9100 of the host machine. To check this, you can open this port and go to the metrics endpoint (http://localhost:9100/metrics if you work ou local machine or http://ip_virtual_machine:9100/metrics if you work on the virtual machine). You can look inside the different metrics that are displayed. You should see information about the I/O operations, the temperature of the CPU, ...
But for now, Prometheus is not aware of this endpoint to scrape. We need to stop it (ctrl+c in the Prometheus server console) and reconfigure the file prometheus.yml.
We will create a copy of this file in case you want to keep a trace of it:
nano prometheus/prometheus.yml
To add a new job, we will need to add information in the last part of the file, under the
scrape_configskey. You can use the example of theprometheusjob if you are not sure about the indentation:
  - job_name: server_monitor
    scrape_interval: 5s
    static_configs:
    - targets: ['localhost:9100']
First we need to indicate the name of the Job. It will be used as a label for the metrics that we will collect. We can specify a different scrape interval which will override the one indicated in the global key.
Then we need to specify more information in static_configs so that Prometheus knows where to get information. This is given by the targets list. Here we have only one target, which means one instance of the job.
We specify the IP and port where the metrics can be found. We do not need to specify the endpoint as it is by default /metrics.
Once this is done, close the file and run the Prometheus server:
prometheus/prometheus --config.file=prometheus/prometheus.yml
Reopen Prometheus dashboard. Now we can use this console to look for metrics relative to the server:
node_cpu_scaling_frequency_hertz
Do not hesitate to explore the different metrics that you can list. They are documented in the link given before.
Monitoring a MySQL database
MySQL is a very popular relational database management system. We will be using the official Exporter.
First we need to create a MySQL user and grant him rights to perform operations on the database.
We need first to install mysql. We will use docker to install the image that will allow us to use it. Run the following commands :
docker network create my-mysql-network
docker pull prom/mysqld-exporter
Then launch the container :
docker run -d \
  -p 9104:9104 \
  --network my-mysql-network  \
  -e DATA_SOURCE_NAME="user:password@(hostname:3306)/" \
  prom/mysqld-exporter
To create an
exporteruser, we will use the environment variables located inDATA_SOURCE_NAME.
The credentials to use are the following. Replace those credentials by
userandpasswordin the previous command.
password="P455word_of_exporter"
user="exporter"
As you can see the metrics are displayed on the 9104 port of the host machine. You can open this port to witness it.
If we want to get the data in Prometheus, we just need to stop the server, modify the
prometheus.ymlfile and restart the server.
  - job_name: mysql_exporter
    static_configs:
    - targets: ['localhost:9104']
In Prometheus dashboard, you can look for certain metrics (you can go to this link http://localhost:9104/metrics or http://ip-virtual-machine:9104/metrics). To show that it is working.
Monitoring the Docker daemon
Docker is a popular container management system. It can expose natively metrics to Prometheus. It is already installed on your machine. To trigger metrics export, you can use the following flag when launching Docker daemon:
# to stop docker if launched
sudo service docker stop
# starting docker with the metrics endpoint
sudo dockerd --experimental --metrics-addr 127.0.0.1:9323
The --experimental flag is needed because it is an experimental feature of Docker. You can then open the 9323 port to see the raw metrics.
Time to connect to tell Prometheus to scrape this data: stop the server and add a new job to the
prometheus.ymlfile:
  - job_name: 'docker'
    static_configs:
      - targets: ['127.0.0.1:9323']
Save the file and restart the Prometheus Server. The metrics are then available in Prometheus dashboard:
engine_daemon_container_states_containers
This command will return the number of containers per states (running, stopped, ...).
Note that Docker integrates very well with Prometheus : Exporters can be found in containers format for a lot of applications.
A lot of tools are provided with exporters : a list can be found on Prometheus website. Documentation is generally well done.
Direct instrumentation
In this part we will talk about exporting the metrics yourself. We will talk only of NodeJS and Flask apps but this can be applied to other server libraries of Javascript and Python. We can also use other language such as Java or Scala. The list of the official and unofficial libraries is available here.
Python integration
The prometheus-client is a useful library to expose metrics to Prometheus. There are a lot of functions that are made to make your life easier when creating web servers and other applications. You can see the full documentation here.
In this lesson, we will detail the several way to create metrics (Counter, Gauge, Summary and Histogram) and how to display them. Then we will take a simple Flask app and create an endpoint to study its activity.
If you want to try those functions, you have to installprometheus-client .
Execute this command
pip install prometheus-client
To create metrics, we must import their classes from the
prometheus-clientapp.
from prometheus_client import Counter, Gauge, Summary, Histogram
When we create a metric, we need to give it a
nameand adocumentation. For example, if we want to create a metric callednb_of_requestswhich contains information about thenumber of requests made to the app, we can use the following command:
nb_of_requests_counter = Counter(name='nb_of_requests',
                                 documentation='number of requests made to the app')
We can also give it labels:
nb_of_requests_counter = Counter(name='nb_of_requests_2',
                                 documentation='number of requests made to the app',
                                 labelnames=['method', 'endpoint'])
Here we will want to have a granularity that allows us to distinguish methods and endpoints.
Remember that a Counter is a metric that can only increase or be reset to 0. To increase a Counter, we can use the inc method. But if we have specified labels, we need to give them values.
This can be done by using the
labelsmethod followed by theincmethod. For example, this would give us:
nb_of_requests_counter.labels(method='GET', endpoint='/').inc()
We can increase the counter by a different value by passing it to the inc method.
If we want to generate the metrics exposed text, we can use the
generate_latestfunction:
from prometheus_client import generate_latest
print(generate_latest(nb_of_requests_counter).decode('utf-8'))
You can see that two metrics have been created:
-
nb_of_requests_totalwhich is actually our counter -
nb_of_requests_createdwhich a gauge containing the creation date of the metrics
The count_exceptions method allows to increment a Counter when an exception is raised. You can try the following code:
with nb_of_requests_counter.labels(method='GET', endpoint='/').count_exceptions():
    raise TypeError
And print the value:
print(generate_latest(nb_of_requests_counter).decode('utf-8'))
The Counter has been incremented.
Let's now create a Gauge:
nb_of_active_connections_gauge = Gauge(name="nb_active_connections",
                                       documentation="number of active connections at a given time",
                                       labelnames=['authenticated'])
Gauges can go up or down using
incanddecon the same model as a Counter object:
nb_of_active_connections_gauge.labels(authenticated='false').dec(1.2)
nb_of_active_connections_gauge.labels(authenticated='false').inc(100)
We can also use set to give it a specific value.
Summary let us get information on the quantiles of a metric. It is pretty easy to use here:
requests_duration_summary = Summary(name='requests_duration',
                                    documentation='duration of the requests',
                                    labelnames=['method', 'endpoint'])
requests_duration_summary.labels(method='GET', endpoint='/').observe(1.234)
To make it a bit more interesting we can run multiple observations:
import random
for i in range(100):
    requests_duration_summary.labels(method='GET', endpoint='/').observe(random.uniform(0, 100))


print(generate_latest(requests_duration_summary).decode('utf-8'))
You can see here that the client has created a _count, a _sum and a _created metrics. As of today, Prometheus Python client does not offer the possibility to provide the quantiles.
Histograms are used to compute aggregated per bucket views of a metric. When building a Histogram, we can specify our own buckets or use the default ones:
requests_duration_histogram = Histogram(name='requests_duration_hist',
                                        documentation='requests duration presented as a histogram',
                                        labelnames=['method', 'endpoint'],
                                        buckets=[0, .01, .5, .8, 1., 1.5, 2])
We will simulate some observations in the way as before:
for i in range(100):
    requests_duration_histogram.labels(method='GET', endpoint='/').observe(random.uniform(0, 1) * 2)

print(generate_latest(requests_duration_histogram).decode('utf-8'))
We can see that a lot of lines appear in this: they are the lines for the different bucket counts. Note that we get the number of observations that are lower than the high bound. It is more a cumulative histogram than a regular histogram.
Finally, we can talk about the
Infoclass. This class allow us to pass information on the service to the scraped endpoint in a way that Prometheus will understand:
from prometheus_client import Info
service_info = Info(name='MyServiceInfo',
                    documentation='information on the service')
service_info.info({'author': 'datascientest'})

print(generate_latest(service_info).decode('utf-8'))
The format may seem a bit weird but at least Prometheus will be able to scrape this.
Now we know how to create the text that Prometheus will be able to read for each type of metrics. We need to paste this all together for Prometheus not to scrape multiple endpoints for a single service. We can do this by running a simple for loop but a more practical way of doing this is to use registries.
When you create a metric, it is assigned to a registry called
REGISTRY. You can access it by importingREGISTRY. In the following code, we show the names of the metrics inREGISTRY:
from prometheus_client import REGISTRY
for metric in REGISTRY.collect():
    print(metric.name)
We can find our metrics alongside other metrics. Note that if we use
generate_latestwithout any argument, it will takeREGISTRYas the default entry:
print(generate_latest().decode('utf-8'))
This gives us all the text for these metrics. Yet we may not want to have all this default metrics in our output.
To do so, we can use a different registry,
CollectorRegistry, and specify it when defining metrics:
from prometheus_client import CollectorRegistry

collector = CollectorRegistry()

c1 = Counter(name='example1', documentation='example 1', registry=collector)
c2 = Counter(name='example2', documentation='example 2', registry=collector)

c1.inc()
c2.inc()

print(generate_latest(collector).decode('utf-8'))
So now we know how to generate this text for multiple metrics. Time to see how we can integrate this to a Flask app.
Now, we will create a very simple Flask app that does nothing except wait.
Add this code in a file named
app_metrics.py:
from flask import Flask
import random
import time

# parameters of the app
address = '0.0.0.0'
port = 5000

# creating the app
app = Flask('my app')

# creating a route for the app
@app.route('/', methods=['GET'])
def index():
    # creating a false waiting time to simulate actual work
    # waiting time set between 0 and 2s
    waitingTime = round(random.uniform(a=0, b=1) * 2, 3)

    # waiting
    time.sleep(waitingTime)

    return 'This request took {}s'.format(waitingTime)

if __name__ == '__main__':

    app.run(host=address, port=port)
You can launch the app and see what it is doing by opening the port 5000 of the platform.
In this example, we will create a Counter for the number of requests and a Histogram for the duration of the requests. We will display the metrics at the /my_metrics endpoint: we could use the usual /metrics but this will allow us to show you how to modify this path.
First, we need to import the Counter, Histogram and CollectorRegistry classes. We will also need the exposition.generate_latest function. Finally, we will also need the make_response function and the request object from Flask. This function will help us to give our endpoint the right headers for Prometheus.
Add this code to the file
app_metrics.py:
from prometheus_client import Counter, Histogram, CollectorRegistry
from prometheus_client import generate_latest
from flask import make_response, request
We can instantiate our classes. Add the code below :
collector = CollectorRegistry()

nb_of_requests_counter = Counter(name='nb_of_requests',
                                 documentation='number of requests per method or per endpoint',
                                 labelnames=['method', 'endpoint'],
                                 registry=collector)

duration_of_requests_histogram = Histogram(name='duration_of_requests', documentation='duration of requests per method or endpoint', labelnames=['method', 'endpoint'], registry=collector)
We are using the default buckets for the Histogram as they are designed to respond to that exact question of the length of an HTTP request.
Now let's get into the index function that is triggered each time the / is called. We need to increment the Counter and give the Histogram the time that the request took.
Replace the function
indexby this code :
def index():
    # creating a start time to get the request duration
    start = time.time()
    # keeping the values for the labels:
    method_label = request.method
    endpoint_label = '/'
    # incrementing the Counter
    nb_of_requests_counter.labels(method=method_label, endpoint=endpoint_label).inc()

    # creating a false waiting time to simulate actual work
    # waiting time set between 0 and 2s
    waitingTime = round(random.uniform(a=0, b=1) * 2, 3)

    # waiting
    time.sleep(waitingTime)

    # creating a stop time to get the request duration
    stop = time.time()
    duration_of_requests_histogram.labels(method=method_label, endpoint=endpoint_label).observe(stop - start)

    return 'This request took {}s'.format(waitingTime)
Save and leave the file.
Start this application and open another console to run a little test script that will generate requests to the app.
python3 app_metrics.py
Create a new file named
test_requests.pywhich contains the code below to test the requests :
import requests

# address where to make the requests
address = 'http://localhost:5000/'

# GET requests
for i in range(20):
    response = requests.get(address)
    print(response.content)

# POST requests
for i in range(20):
    response = requests.post(address)
    print(response.content)
In the other console :
python3 test_requests.py
This is not Unit Testing. We just have this script to populate our metrics for later on. Once this is tested, we can work on our endpoint to display the metrics.
Shut down the app and reopen the
app_metrics.pyfile.
nano app_metrics.py
To add the endpoint, we can add the following route:
@app.route('/my_metrics', methods=['GET'])
def my_metrics():
    # creating the text to display
    text_to_display = generate_latest(collector)
    # creating a response object
    response = make_response(text_to_display)
    # specifying response headers
    response.headers['Content-Type'] = 'text/plain'
    # returning the response
    return response
Leave and save the file. Start the app over and in another console, run the tests.
Open the 5000 port at the /my_metrics endpoint. You should see the your metrics appearing.
We can now tell the Prometheus Server where to scrape this data: open the
prometheus.ymlconfiguration file and add the following lines to thescrape_configskey:
  - job_name: python_app
    scrape_interval: 5s
    metrics_path: '/my_metrics'
    static_configs:
    - targets: ['localhost:5000']
Relaunch the Prometheus Server and open the dashboard. If you added all the previous targets, this starts to be a lot of targets to watch: you can use the Status > Targets menu to see which targets are up and running. Status > Service Discovery is also a good way to get a quick summary of the jobs that are scraped. In the Graph panel, we can look for our metrics: nb_of_requests_total and duration_of_requests_buckets. You can populate this metrics by running the test_requests.py file again.
If you want a more "random" behaviour, you can create the
random_client.pyfile below and run it :
import random
import requests
import time

# the address to request
address = 'http://localhost:5000/'

for i in range(100):
    # random sleeping time
    sleeping_time = random.uniform(0, 1)

    # choosing method randomly
    method = random.choice(['GET', 'POST'])

    # making the actual request
    if method == 'GET':
        r = requests.get(address)
    else:
        r = requests.post(address)

    # printing the request and its content
    print(method, ':', r.content)

    # sleeping
    time.sleep(sleeping_time)
The graph of duration_of_requests_buckets becomes very interesting !
In this part, we have seen how to use prometheus-client to display metrics with a Flask app. There are actually simpler ways to do this but we wanted to give you the most general case. You can find more information on the Github of the client.
Node JS integration
In this part, we are going to show how we can integrate a metrics endpoint in a NodeJS app. If you do not use NodeJS, you can skip this part.
We have to install
nodejsand a package namedexpress. Run the commands below :
sudo apt-get update
sudo apt-get install nodejs npm
npm install express
We are going now to create a very simple app in the node_app folder. Here we will find the package.json file and the code for the app in server.js.
Create a folder named
node_app:
mkdir node_app
cd node_app
Add the lines below in the file named
package.json:
{
  "name": "my_node_app",
  "version": "1.0.0",
  "description": "a very simple app ",
  "main": "server.js",
  "scripts": {
    "test": "echo \"Error: no test specified\" && exit 1"
  },
  "author": "datascientest",
  "license": "ISC",
  "dependencies": {
    "express": "^4.17.1",
    "prom-client": "^12.0.0"
  }
}
Dependencies are interesting here:
-
expressis a common library to create server -
prom-clientis the Prometheus client
In the file named
server.js, add the code below :
'use strict';
// importing the request library
const express = require('express');

// choosing a port
const port = 3000;

// creating an app
const app = express();

// creating an endpoint
app.get('/',
    function(req, res) {
        // we will wait a random time between 0 and 2 seconds
        // this will replace an actual work but you can imagine a long sequence of actions
        // Picking the waiting time
        var waitingTime = Math.floor(Math.random() * 2000);
        // Waiting
        setTimeout(function() {}, waitingTime);

        res.send('The request has taken ' + waitingTime + 'ms.')

    }
)

// starting the app
app.listen(port, () => console.log('App running at http://localhost:' + port))
You can launch it by using the following command:
node server.js
It is running on port 3000. You can open it to see the result.
Now we will use the Prometheus client library in order to create metrics. We will expose them on the /metrics endpoint.
You can create a copy of this file and open it :
cp server.js server_metrics.js
nano server_metrics.js
We have to install the package
prom-client.
nmp install prom-client
First, before defining the routes, we need to import the client and define a Counter for the number of requests and a Histogram for the duration of the requests just as we did for Flask.
// importing the Prometheus client library
const prometheus_client = require('prom-client');

// collecting default metrics
prometheus_client.collectDefaultMetrics();

// creating a counter for the number of requests
var nb_of_requests_counter = new prometheus_client.Counter({
    'name': 'nb_of_requests',
    'help': 'number of requests in our NodeJS app'
});

// creating a Histogram for the duration of the requests
var duration_of_requests_histogram = new prometheus_client.Histogram({
    'name': 'duration_of_requests',
    'help': 'duration of requests in our NodeJS app',
    'buckets': [.1, .5, 1, 1.5, 2]
});
Then, in the route, we need to update these two metrics:
app.get('/',
    function(req, res) {
        // saving the starting time of the request
        var request_start = new Date();

        // incrementing the counter
        nb_of_requests_counter.inc();

        // we will wait a random time between 0 and 2 seconds
        // this will replace an actual work but you can imagine a long sequence of actions
        // Picking the waiting time
        var waitingTime = Math.floor(Math.random() * 2000);
        // Waiting
        setTimeout(function() {}, waitingTime);

        // saving stopping time of the request
        var request_stop = new Date();

        // observing the duration of the request in s
        duration_of_requests_histogram.observe((request_stop - request_start) / 1000)

        res.send('The request has taken ' + waitingTime + 'ms.')

    }
)
Finally, we need to expose our metrics on the
/metricsendpoint:
// dealing with the `/metrics` endpoint
app.get('/metrics',
    function (req, res) {
        // setting the right content type
        res.set('Content-Type', prometheus_client.register.contentType)
        // sending the metrics
        res.end(prometheus_client.register.metrics())
    }
)
We can close and save the file and launch the app:
node server_metrics.js
Open the 3000 port and go to the /metrics endpoint. You should your metrics. You can try a few requests on the / endpoint to make the metrics change. The collectDefaultMetrics is not necessary but it can provide a lot of useful information.
If you want to monitor this app, you can add this configuration to the
prometheus.ymlfile and restart Prometheus Server:
  - job_name: nodejs_app
    static_configs:
    - targets: ['localhost:3000']
Using Prometheus is even easier with NodeJs than with Python. As a lot of APIs or web servers rely on NodeJS, this can be a great tool to monitor your services. You can find the whole documentation here.
Using the Push Gateway
Sometimes, our jobs are too short to create an endpoint for Prometheus Server to scrape. In this particular case, we can use the Push Gateway. Our jobs will push data to the Push Gateway and this daemon will expose its port to the Prometheus Server to scrape the data.
The Push Gateway has to be downloaded separately. We have to install it.
Run the commands below :
 wget https://github.com/prometheus/pushgateway/releases/download/v1.4.1/pushgateway-1.4.1.linux-amd64.tar.gz
 tar -xvf pushgateway-1.4.1.linux-amd64.tar.gz
 mv pushgateway-1.4.1.linux-amd64 pushgateway
First we need to launch the Push Gateway:
pushgateway/pushgateway
By default, it is running on the 9091 port. You can open this port and see the web interface. We have only two menus: Metrics and Status. The second one gives us information on the status of the Push Gateway while the first one sums up the metrics received by the Push Gateway.
First we will push a simple metric using
Python: in another console, run the following command.
echo "my_metric_though_push_gateway 1" | curl -X POST --data-binary @- http://localhost:9091/metrics/job/my_fake_job/instance/my_fake_instance/my_other_label/its_value
Pay attention to the way we are assigning a job, an instance and some other label. Now if you get back to the Metrics menu of the Web interface, you should see your metric.
We can delete this metric by doing a DELETE request. If we want to delete all the information regarding some label, we just have to enter the good URL: for example, if we want to delete all the metrics where the label label1 is set to value1, we will do:
curl -X DELETE http://localhost:9091/metrics/label1/value1
Do not delete this for now on, we will set Prometheus Server to scrape the Push Gateway.
Open Prometheus configuration file:
nano prometheus/prometheus.yml
We will add a new job as usual:
  - job_name: push_gateway
    static_configs:
    - targets: ['localhost:9091']
Shut down Prometheus Server and start it over. Go to the dashboard and make the following query:
my_metric_through_push_gateway
You should see your value ! Note that Prometheus has changed your job and instance label to exported_job and exported_instance.
This kind of behavior can be interesting to check if a job has run correctly: we will create a Python script, that does nothing of importance. But we will integrate a small part to make it push information about the job.
Create a file named
nothing.pyand add this code :The principle is similar to what we have done with
Flask: we use a simpleprometheus-clientfunction to give the metrics to the Push Gateway:
import time
from prometheus_client import Counter, Info, CollectorRegistry, push_to_gateway

# the address of the Push Gateway
push_gateway_address = 'http://localhost:9091'

# creating a registry
collector = CollectorRegistry()

# creating an info metric
info = Info(name='name_of_the_script',
    documentation='documentation of the script',
    registry=collector)
info.info({'version': '0.1', 'author': 'datascientest'})

# creating a counter to count iteration
# but it could count exceptions, measure time, ...
counter = Counter(
    name='iterations',
    documentation='a counter used to record the starting time of the job',
    labelnames=['job'],
    registry=collector)

for i in range(10):
    # incrementing counter
    counter.labels(job="my_python_script").inc()

    # sleeping for 1 second
    # time.sleep(1)
    print(10 - i - 1, 's to sleep remaining...')

push_to_gateway(gateway=push_gateway_address, job="my_python_script", registry=collector)
Run it and look for the metrics relative to the
exported_jobmy_python_script.
python3 nothing.py
Use the following
PromQLquery:
{exported_job="my_python_script"}
The Push Gateway architecture is interesting but it must not be used all the time: if so, it becomes a bottleneck and finally crashes. Exporters and Direct instrumentation is much more solid. You can read more on the use cases on Prometheus website.
