

Abstract 摘要
AIM 目的
To present the multi-omics landscape of cutaneous melanoma (CM) and uveal melanoma (UM) from The Cancer Genome Atlas (TCGA).
旨在从《癌症基因组图谱》(TCGA)呈现皮肤黑色素瘤(CM)和脉络膜黑色素瘤(UM)的多组学图谱。
METHODS 方法
The differentially expressed genes (DEGs) between CM and UM were found and integrated into a gene ontology enrichment analysis. Besides, the differentially expressed miRNAs were also identified. We also compared the methylation level of CM with UM and identified the differentially methylated regions to integrate with the DEGs to display the relationship between the gene expression and DNA methylation. The differentially expressed transcription factors (TFs) were identified.
我们发现了 CM 和 UM 之间的差异表达基因(DEGs),并将这些基因整合到基因本体(GO)富集分析中。此外,还鉴定了差异表达的 miRNA。我们还比较了 CM 和 UM 的甲基化水平,并确定了差异甲基化区域,将其与 DEGs 整合,以展示基因表达与 DNA 甲基化之间的关系。鉴定了差异表达的转录因子(TFs)。
RESULTS 结果
Though CM had more mutational burden than UM, they shared several similarities such as the same rankings in diverse variant types. Except GNAQ and GNA11, the other top 18 mutated genes of the combined group were mostly detected in CM instead of UM. On the transcriptomic level, 4610 DEGs were found and integrated into a gene ontology enrichment analysis. We also identified 485 differentially expressed miRNAs. The methylation analysis showed that UM had a significantly higher methylation level than CM. The integration of differentially methylated regions and DEGs demonstrated that most DEGs were downregulated in UM and the hypo- and hypermethylation presented no obvious difference within these DEGs. Finally, 116 hypermethylated TFs and 114 hypomethylated TFs were identified as differentially expressed TFs in CM when compared with UM.
尽管 CM 的突变负担高于 UM,两者在多种变异类型中排名相似。除了 GNAQ 和 GNA11,联合组中排名前 18 的突变基因大多在 CM 中检测到,而不是在 UM 中。在转录组水平上,发现了 4610 个差异表达基因(DEGs),并进行了基因 ontology 富集分析。我们还鉴定了 485 个差异表达的 miRNA。甲基化分析显示,UM 的甲基化水平显著高于 CM。将差异甲基化区域与 DEGs 进行整合分析表明,大多数 DEGs 在 UM 中下调,这些 DEGs 的低甲基化和高甲基化没有明显差异。最后,我们鉴定了 116 个高甲基化的 TF 和 114 个低甲基化的 TF 作为 CM 与 UM 中差异表达的 TF。
CONCLUSION 结论
This multi-omics study on comparing CM with UM confirms that they differ in all analyzed levels. Of notice, the results also offer new insights with implications for elucidating certain unclear problems such as the distinct role of epithelial mesenchymal transition in two melanomas, the different metastatic routes of CM and UM and the liver tropism of metastatic UM.
本多组学研究将 CM 与 UM 进行比较,证实两者在所有分析的水平上存在差异。值得注意的是,研究结果还提供了新的见解,有助于阐明某些未解问题,如两种黑色素瘤中上皮-间质转化的不同作用、CM 和 UM 的不同转移途径以及转移性 UM 对肝脏的倾向性。
Keywords: cutaneous melanoma, uveal melanoma, genomics, transcriptomics, epigenetics
关键词:皮肤黑色素瘤,眼内黑色素瘤,基因组学,转录组学,表观遗传学
INTRODUCTION 简介
Cutaneous melanoma (CM) and uveal melanoma (UM) are two fatal malignancies. They account for more than 90% and 5% of all melanomas respectively. UM is the most common eye tumor and constitutes about 85% of the intraocular malignancies. The incidences of CM and UM were reported to be 100-300 per 1 million and 7 per 1 million per year, respectively[1]. Though CM and UM arise in different tissues, both of them derive from melanocytes. Despite the common origin, the etiopathogenesis, biological processes, metastatic routes and clinical prognosis of these two melanomas differ greatly from each other[2]. Furthermore, some effective therapeutic methods applied in the treatment of CM have little effects on the UM patients. Thus, it's meaningful to elucidate the detailed distinctive mechanisms underlying these different behaviors of the two tumors[3]. However, cross-cancer studies are rarely performed because of many objective factors such as the limitation of collecting enough samples of varied cancers in a single institution and the huge expenses of large-scale cancer researches.
皮肤黑色素瘤(CM)和脉络膜黑色素瘤(UM)是两种致命的恶性肿瘤。CM 占所有黑色素瘤的 90% 以上,而 UM 占 5% 左右。UM 是最常见的眼内肿瘤,约占眼内恶性肿瘤的 85%。CM 和 UM 的发病率分别为每百万人中 100-300 例和每百万人中 7 例 [1] 。尽管 CM 和 UM 发生在不同的组织中,但它们都起源于黑色素细胞。尽管具有相同的起源,这两种黑色素瘤的病因病理、生物学过程、转移途径和临床预后却大相径庭 [2] 。此外,一些对 CM 有效的治疗方法对 UM 患者效果甚微。因此,阐明这两种肿瘤不同行为背后的详细特异机制具有重要意义 [3] 。然而,由于许多客观因素(如单一机构难以收集到足够多的多种癌症样本以及大规模癌症研究的高昂费用)等原因,跨癌种研究很少进行。
The Cancer Genome Atlas (TCGA) is a dataset that provides comprehensive, multi-level (gene mutation, methylation, mRNA, miRNA, proteins, clinical data) data of 43 selected cancer projects (until Oct. 2018). Because much data on it is publicly available, a lot of TCGA-based studies were already conducted to compare different tumors at a pan-cancer level[4]–[5]. To the best of our knowledge, this is the first TCGA-based study focusing on the comparison of CM with UM on multiple levels.
TCGA 是一个数据集,提供了 43 个选定癌症项目(截至 2018 年 10 月)的全面多水平(基因突变、甲基化、mRNA、miRNA、蛋白质、临床数据)数据。由于其中许多数据是公开的,基于 TCGA 的研究已经广泛开展,用于在泛癌水平上比较不同肿瘤 [4] – [5] 。据我们所知,这是第一个基于 TCGA 比较 CM 与 UM 多水平的肿瘤研究。
MATERIALS AND METHODS
In this study, we used R language (version 3.5.2) and its variety of packages (TCGAbiolinks, TCGAbiolinksGUI and ELMER etc.) to analyze the data from TCGA and illustrate figures[6]–[8]. In order to eliminate the effect of metastatic process, only the data of primary tumors were included in the study.
在本研究中,我们使用 R 语言(版本 3.5.2)及其各种包(TCGAbiolinks、TCGAbiolinksGUI 和 ELMER 等)分析了 TCGA 的数据并绘制了图 [6] – [8] 。为了消除转移过程的影响,仅将原发肿瘤的数据纳入研究。
Multiple Genomic Alteration Analysis
多组学基因改变分析
In order to ensure the data quality, mutation annotation format (MAF) files were downloaded from the TCGA data portal via R. First, the package “TCGAbiolinks” was used to analyze the MAF files of CM (104 files) and UM (80 files) separately. Second, we pooled the MAF files together to identify the top 20 most frequently mutated genes of the combined group which were presented with additional information such as “disease”, “gender” and “race”. All variant coordinates were transferred to genome reference hg38.
为了确保数据质量,我们通过 R 从 TCGA 数据门户下载了突变注释格式(MAF)文件。首先,使用“TCGAbiolinks”包分别分析了 CM(104 个文件)和 UM(80 个文件)的 MAF 文件。其次,我们将 MAF 文件合并,以识别联合组中突变频率最高的前 20 个基因,并提供了“疾病”、“性别”和“种族”等额外信息。所有变异坐标均转换为基因组参考 hg38。
Differentially Expressed Genes
差异表达基因
First, we downloaded the combined mRNA data which contained 103 CM samples and 80 UM samples. The combined data was then analyzed with an Array Array Intensity correlation which defined a square symmetric matrix of Pearson correlation among all 183 samples. Second, the combined mRNA data was processed with within-lane normalization and between-lane normalization. Ultimately, with a threshold of 0.25, differentially expressed genes (DEGs) were identified through edgeR function of the package TCGAbiolinks.
首先,我们下载了包含 103 例皮肤黑色素瘤(CM)样本和 80 例眼内黑色素瘤(UM)样本的联合 mRNA 数据。随后,使用阵列阵列强度相关性对联合数据进行了分析,定义了一个包含所有 183 个样本的皮尔森相关性对称矩阵。其次,联合 mRNA 数据进行了同通道内归一化和不同通道间归一化处理。最终,通过“TCGAbiolinks”包中的 edgeR 函数,使用阈值 0.25 识别出差异表达基因(DEGs)。
Gene Ontology Enrichment Analysis
基因本体论富集分析
With the identified DEGs, we performed the gene ontology (GO) enrichment analysis in three perspectives, biological process, cellular component and molecular function. Besides, 10 most significantly enriched pathways were also identified. The results were plotted by the -log(P-value corrected FDR).
通过已识别的差异表达基因(DEGs),我们从生物过程、细胞成分和分子功能三个角度进行了基因本体(GO)富集分析。此外,还确定了 10 个最显著富集的通路。结果通过-log(调整后的 FDR P 值)进行了绘图。
DNA Methylation DNA 甲基化
DNA methylation analysis of both CM and UM were conducted on the platform “Illumina Human Methylation 450”. We searched for differentially methylated CpG sites, which were regarded as possible functional regions involving in gene transcriptional regulation. In order to find these regions, the beta-values of methylation were used for the comparison. First, the calculation of the mean methylation of each tumor was performed. Second, we calculated the P-value by using a Benjamini-Hochberg adjusted Wilcoxon test. Finally, a heatmap of the methylation of CM and UM was generated with R.
在“ Illumina Human Methylation 450”平台上对 CM 和 UM 的 DNA 甲基化进行了分析。我们搜索了差异甲基化的 CpG 位点,这些位点被认为是可能参与基因转录调控的功能区域。为了找到这些区域,我们使用甲基化β值进行比较。首先,计算每个肿瘤的平均甲基化水平。其次,我们使用 Benjamini-Hochberg 调整后的 Wilcoxon 检验计算 P 值。最后,使用 R 生成 CM 和 UM 的甲基化热图。
Integration of DNA Methylation and Gene Expression Data
DNA 甲基化和基因表达数据的整合
We conducted the integration of DNA methylation and gene expression data with the results from step 2 and step 4 by using the “TCGAvisualize_starburst” function in the “TCGAbiolinks” package.
我们使用“TCGAbiolinks”包中的“TCGAvisualize_starburst”函数,将步骤 2 和步骤 4 的结果进行了 DNA 甲基化和基因表达数据的整合。
Differentially Expressed miRNAs
差异表达的 miRNA
We downloaded the combined miRNA data which contained 103 CM samples and 80 UM samples. By using the function “TCGAanalyze_DEA”, we identified the differentially expressed miRNAs between CM and UM patients. The “fdr.cut” and “logFC.cut” were set to be 0.01 and 1, respectively.
我们下载了包含 103 例皮肤黑色素瘤(CM)样本和 80 例眼内黑色素瘤(UM)样本的联合 miRNA 数据。使用“TCGAanalyze_DEA”功能,我们识别了 CM 和 UM 患者之间的差异表达 miRNA。“fdr.cut”和“logFC.cut”分别设置为 0.01 和 1。
ELMER Analysis on Identifying the Differentially Expressed Master Transcription Factors
ELMER 分析以识别差异表达的主转录因子
With the ELMER package, a Multi Assay Experiment (MAE) object including a DNA methylation matrix and a gene expression matrix was generated. For instance, in the hypomethylated direction, the samples of CM and UM were ranked by the beta values of the DNA methylation and 20% of the samples with the lowest methylation levels were processed with an unpaired one-tailed t-test to find out the comparatively hypomethylated probes in CM. Afterwards, the methylation of the probes and the expression of their 10 nearest upstream and downstream genes were tested for an inverse correlation. The differentially methylated probes were identified via the Mann-Whitney U test and the non-parametric test. Then, we integrated the significant probe-gene pairs to perform the motif enrichment analysis which finally helped to identify the candidate differentially expressed master regulatory transcription factors (TFs). The same method was also applied in the analysis of the hypermethylated direction.
使用 ELMER 包,生成了一个包含 DNA 甲基化矩阵和基因表达矩阵的多组学实验(MAE)对象。例如,在低甲基化方向上,根据 DNA 甲基化的 beta 值对 CM 和 UM 的样本进行排序,并对甲基化水平最低的 20% 样本进行配对单尾 t 检验,以找出 CM 中相对低甲基化的探针。之后,检测这些探针的甲基化水平与其 10 个最近的上游和下游基因的表达水平之间的反相关关系。通过 Mann-Whitney U 检验和非参数检验识别出差异甲基化探针,然后将显著的探针-基因对整合进行 motif 富集分析,最终识别出候选的差异表达主调控转录因子(TFs)。同样的方法也应用于高甲基化方向的分析。
RESULTS 结果
Multiple Genomic Alteration Analysis
多重基因组改变分析
In Figure 1A and 2A, we noticed that single nucleotide polymorphism (SNP) was the most common variant type in both tumors when compared with insertion and deletion. Furthermore, in both tumors, “C>T” was the most frequent one in the six classes of single nucleotide variant (SNV) types. With regard to the variant classification, a same ranking order was observed in both groups, with missense mutation ranking first, followed by nonsense mutation, frameshift deletion and frameshift insertion. Besides, CM samples had a median variants' number of 223.5, with the maximum reaching more than 5000, whereas the median variants' number of UM was only 11 and the maximum was less than 400. This is concordant with a previous study which reported that CM had more mutational burden than UM[9].
在 Figure 1A 和 2A 中,我们注意到与插入和删除相比,单核苷酸多态性(SNP)是两种肿瘤中最常见的变异类型。此外,在六类单核苷酸变异(SNV)类型中,“C>T”是最常见的。关于变异分类,两组中观察到相同的排名顺序,错义突变排名第一,其次是无义突变、移码缺失和移码插入。此外,CM 样本的变异中位数为 223.5,最大值超过 5000,而 UM 样本的变异中位数仅为 11,最大值不到 400。这与之前的一项研究一致,该研究报道 CM 的突变负担比 UM 更多 [9] 。
Figure 1. Multiple genomic alteration analysis of CM.
图 1. CM 的多重基因组改变分析。

A: The counts of 3 variant types; B: The counts of 5 gene variant classifications; C: The variants' counts of 6 SNP classes; D: The variants' counts per CM sample; E: The summary of 5 gene variant classification: box plots show median counts and the interquartile range; F: Top 10 most frequently mutated genes in the CM group.
A: 3 种变异类型的计数;B: 5 种基因变异分类的计数;C: 6 种 SNP 类别的变异计数;D: 每个 CM 样本的变异计数;E: 5 种基因变异分类的总结:箱线图显示中位数计数和四分位数范围;F: CM 组中突变频率最高的前 10 个基因。
Figure 2. Multiple genomic alteration analysis of uveal melanoma.
图 2. 眼内黑色素瘤的多重基因组改变分析。

A: The counts of 3 variant types; B: The counts of 9 gene variant classifications; C: The variants' counts of 6 SNP classes; D: The variants' counts per UM sample; E: The summary of 9 gene variant classification: box plots show median counts and the interquartile range; F: Top 10 most frequently mutated genes in the UM group.
A: 3 种变异类型的数量;B: 9 种基因变异分类的数量;C: 6 种 SNP 类别的变异数量;D: 每个 UM 样本的变异数量;E: 9 种基因变异分类的汇总:箱线图显示中位数和四分位数范围;F: UM 组中突变频率最高的前 10 个基因。
Furthermore, the CM and UM samples were combined together into a pooled analysis (Figure 3). We identified the 20 most frequently mutated genes in the combined group, with TTN (40%) ranking first, followed by MUC16 (37%), BRAF (29%), GNAQ (24%), PCLO (21%), DNAH5 (21%), GNA11 (20%), DNAH7 (18%), ADGRV1 (18%), LRP1B (17%), FAT4 (16%), XIRP2 (16%), CSMD1 (16%), DNAH9 (16%), HYDIN (16%), ANK3 (15%), MGAM (15%), THSD7B (15%), FLG (14%), ZFHX4 (14%). In the included 184 (104 CM and 80 UM) samples, 172 (93.48%) had at least one mutation in the abovementioned 20 genes.
此外,我们将 CM 和 UM 样本合并进行联合分析( Figure 3 )。我们确定了联合组中突变频率最高的 20 个基因,其中 TTN(40%)排名第一,其次是 MUC16(37%)、BRAF(29%)、GNAQ(24%)、PCLO(21%)、DNAH5(21%)、GNA11(20%)、DNAH7(18%)、ADGRV1(18%)、LRP1B(17%)、FAT4(16%)、XIRP2(16%)、CSMD1(16%)、DNAH9(16%)、HYDIN(16%)、ANK3(15%)、MGAM(15%)、THSD7B(15%)、FLG(14%)、ZFHX4(14%)。在包含的 184(104 个 CM 和 80 个 UM)样本中,有 172(93.48%)个样本在上述 20 个基因中至少有一个突变。
Figure 3. Top 20 most frequently mutated genes in the combined group of CM and UM.
图 3. 组合群体(CM 和 UM)中频率最高的前 20 个突变基因。

The upper histogram shows the variants' counts per sample. The percentiles at the left border of the main heatmap mean the occurrence ratio of each gene mutation. The right horizontal histogram presents the variant classifications of each gene. The covariate tracks show clusters for disease, gender, race and variant classification type.
上图显示了每份样本的变异数量。主热图左边界处的百分位数表示每种基因突变的发生比例。右侧的水平直方图展示了每种基因的变异分类。协变量轨迹图显示了疾病、性别、种族和变异分类类型的聚类。
Interestingly, mutation on titin, or TTN, occurred in 71 (68%) of 104 CM samples, whereas only 2 (2.5%) of 80 UM samples were identified to have TTN mutations. In our study, 68 (65 CM and 3 UM) samples were identified to have MUC16 mutations. We also noticed an obvious absence of BRAF mutation in the UM group. In contrast to these top three mutated genes, 40 of the 44 GNAQ-mutated samples originated from UM, with the left four deriving from CM. Thirty-nine samples with mutated PCLO were detected in our study. Among them, 38 were CM samples and only one UM sample. Within the 38 mutated CM samples, the number of male samples (n=26) was more than twice as large as the number of female samples (n=12). Three cytoskeletal dynein genes DNAH5, DNAH7 and DNAH9 were also presented in the top 20 mutated genes. We noticed that only one UM sample was detected with DNAH7 mutation while the others were all CM samples. Similarly, few UM samples were found in the XIRP2-, ADGRV1-, LRP1B-, CSMD1-, HYDIN-, MGAM-, FLG-, ZFHX4-, ANK3- and FAT4-mutated groups.
有趣的是,在 104 例 CM 样本中有 71 例(68%)检测到了 TTN 基因的突变,而在 80 例 UM 样本中只有 2 例(2.5%)检测到了 TTN 基因的突变。在我们的研究中,共有 68 例样本检测到了 MUC16 基因的突变,其中 65 例为 CM 样本,3 例为 UM 样本。我们还注意到 UM 组中 BRAF 基因突变明显缺失。与这三种突变率最高的基因不同,44 例 GNAQ 突变样本中有 40 例来自 UM,其余 4 例来自 CM。我们研究中检测到了 39 例 PCLO 基因突变的样本,其中 38 例为 CM 样本,只有 1 例为 UM 样本。在 38 例 PCLO 突变的 CM 样本中,男性样本(n=26)的数量是女性样本(n=12)的两倍多。在前 20 种突变基因中,我们还发现了三个细胞骨架动力蛋白基因 DNAH5、DNAH7 和 DNAH9。我们注意到,只有 1 例 UM 样本检测到了 DNAH7 突变,其余均为 CM 样本。类似地,在 XIRP2、ADGRV1、LRP1B、CSMD1、HYDIN、MGAM、FLG、ZFHX4、ANK3 和 FAT4 突变的样本组中,UM 样本的数量也很少。
Transcriptomic Analysis 转录组分析
Totally 80 UM and 103 CM mRNA samples were included in the transcriptomic analysis. Finally, 4610 differentially expressed genes were identified. The top 20 differentially expressed genes (Table 1) were selected and ordered by the Delta value (the difference of gene expression between the two tumors multiplied logFC), i.e. KRT14, KRT6A, KRT16, KRT6B, KRT5, KRT17, KRT1, KRT6C, FN1, APOD, SERPINE2, KRT10, COL1A1, S100A9, SFN, TNC, S100A7, EEF2, S100A8, SPRR1B. Interestingly, 9 of the 20 identified genes belonged to the Keratin family which were abundant in the keratinocytes and were regarded as epithelial markers. And three members of S100 protein family (S100A7, S100A8 and S100A9) were also shown in Table 1.
总共包括了 80 个 UCM 和 103 个 CM 的 mRNA 样本进行转录组分析。最终共识别出 4610 个差异表达基因。选择并按Δ值(两肿瘤之间基因表达差异的对数倍数变化)排序的前 20 个差异表达基因,即 KRT14、KRT6A、KRT16、KRT6B、KRT5、KRT17、KRT1、KRT6C、FN1、APOD、SERPINE2、KRT10、COL1A1、S100A9、SFN、TNC、S100A7、EEF2、S100A8、SPRR1B。有趣的是,在这 20 个识别出的基因中有 9 个属于角蛋白家族,这些基因在角质细胞中丰富,被认为是上皮标志物。同时,S100 蛋白家族的三个成员(S100A7、S100A8 和 S100A9)也在其中。
Table 1. Top 20 differentially expressed genes.
表 1. 前 20 个差异表达基因。
| mRNA | logFC | FDR | Expression level 表达水平 |
Deltaa | |
| CM gene CM 基因 | UM gene UM 基因 | ||||
| KRT14 | -11.346077 | 1.38E-55 | 180056.165 | 65.2375 | 2042931.18 |
| KRT6A | -12.533693 | 1.66E-31 | 128946.2816 | 14.25 | 1616173.15 |
| KRT16 | -13.59958 | 2.57E-40 | 100335.6893 | 5.65 | 1364523.22 |
| KRT6B | -13.709598 | 2.20E-44 | 98880.99029 | 5.4375 | 1355618.67 |
| KRT5 | -12.528266 | 2.18E-47 | 94258.47573 | 11.0625 | 1180895.26 |
| KRT17 | -11.839915 | 2.14E-57 | 83843.80583 | 15.95 | 992703.557 |
| KRT1 | -15.248924 | 8.06E-38 | 56077.99029 | 1.1375 | 855129.009 |
| KRT6C | -13.776406 | 2.61E-38 | 55547.1068 | 2.775 | 765239.475 |
| FN1 | -4.6306564 | 8.58E-77 | 154051.5728 | 5163.1125 | 713359.903 |
| APOD | -5.0761006 | 5.21E-63 | 102886.9612 | 2448.025 | 522264.567 |
| SERPINE2 | -2.893698 | 2.24E-42 | 126185.0874 | 15050.6375 | 365141.539 |
| KRT10 | -6.3170001 | 6.68E-53 | 55498.26214 | 656.85 | 350582.525 |
| COL1A1 | -4.0338005 | 6.78E-64 | 85640.96117 | 4216.8875 | 345458.553 |
| S100A9 | -8.4467583 | 8.08E-66 | 33439.74757 | 79.5375 | 282457.466 |
| SFN | -11.525871 | 4.37E-63 | 24372.58252 | 6.5375 | 280915.246 |
| TNC | -7.1195055 | 1.12E-105 | 37638.42718 | 234.8875 | 267966.988 |
| S100A7 | -14.921512 | 2.10E-46 | 15983.15534 | 0.3125 | 238492.842 |
| EEF2 | 1.41987278 | 2.07E-38 | 163253.2816 | 363191.325 | 231798.891 |
| S100A8 | -10.191145 | 8.08E-75 | 22144.60194 | 16.0625 | 225678.852 |
| SPRR1B | -13.252227 | 1.82E-35 | 13745.35922 | 0.8625 | 182156.624 |
FC: Fold change; FDR: False discovery rate. aDelta=|logFC×(CM gene expression level-UM gene expression level)|.
FC: 比值变化;FDR: 假发现率。 a Delta=|logFC×(CM 基因表达水平-UM 基因表达水平)|。
GO Enrichment Analysis GO 富集分析
Basing on the results of DEGs, we performed a GO enrichment analysis to classify the DEGs. Three GO types (biological processes, cellular components, molecular functions) and pathways were investigated. The results were ordered by -log10(FDR).
基于 DEGs 的结果,我们进行了 GO 富集分析以分类 DEGs。研究了三种 GO 类型(生物过程、细胞成分、分子功能)和途径。结果按-log 10 (FDR)排序。
In the 10 identified biological processes, we observed three processes with epidermal characteristics, i.e. the epidermal cell differentiation, epidermis development and keratinocyte differentiation. The DEGs also influence the cell and biological adhesion process. Additionally, two sensory organ-associated process, i.e. sensory perception and cognition, were also identified in the top 10 most significant biological processes.
在识别出的 10 个生物过程中,我们观察到 3 个具有表皮特征的过程,即表皮细胞分化、表皮发育和角质形成细胞分化。差异表达基因(DEGs)还影响细胞和生物黏附过程。此外,在前 10 个最显著的生物过程中,还识别出了两个与感觉器官相关的过程,即感觉感知和认知。
From the perspective of the cellular component, it's noteworthy that eight of the 10 components were associated with cellular membrane, including plasma membrane, extracellular region part, extracellular region, intrinsic to plasma membrane, integral to plasma membrane, proteinaceous extracellular matrix, extracellular matrix and extracellular space.
从细胞组分的角度来看,值得注意的是,在 10 个组分中有 8 个与细胞膜相关,包括细胞膜、细胞外区域部分、细胞外区域、膜内在部分、膜整合部分、蛋白质性细胞外基质、细胞外基质和细胞外空间。
With regard to the molecular function, the DEGs were enriched majorly in the binding functions. Despite the eight identified binding functions, the structural molecule activity and chemokine activity were also presented in the top 10 functions. Finally, the DEGs were integrated to identify the most significantly enriched pathways. We noticed that four of the 10 identified pathways were associated with the immune system, including the granulocyte adhesion and diapedesis, agranulocyte adhesion and diapedesis, T helper cell differentiation and the role of nuclear factor of activated T cells (NFAT) in regulation of the immune response. Other presented pathways like hepatic fibrosis/hepatic stellate cell activation and colorectal cancer metastasis signaling were also identified as DEGs-enriched pathways.
在分子功能方面,差异表达基因(DEGs)主要富集在结合功能中。尽管识别出了八种结合功能,但在前 10 种功能中,结构分子活性和趋化因子活性也有所体现。最后,将 DEGs 整合以识别最显著富集的信号通路。我们注意到,在识别出的 10 个通路中,有 4 个与免疫系统相关,包括中性粒细胞黏附和渗移、无粒细胞黏附和渗移、T 辅助细胞分化以及活化 T 细胞核因子(NFAT)在免疫反应调节中的作用。其他如肝纤维化/肝星状细胞激活和结直肠癌转移信号通路也作为 DEGs 富集的通路被识别出来。
DNA Methylation DNA 甲基化
The methylation data of both tumors (104 CM and 80 UM samples) were acquired through the platform of Infinium Human Methylation 450. First, a comprehensive study was performed to check the mean DNA methylation level of the two tumors. A significant difference of DNA methylation level between the two tumors was confirmed by the t test with P<0.001. Second, a heatmap (Figure 4) was generated to visualize the DNA methylation level across all CM and UM samples. While notable methylation differences could be observed between CM and UM, no obvious disparities were detected in genders and races.
两种肿瘤(104 例皮肤黑色素瘤和 80 例眼内黑色素瘤样本)的甲基化数据通过 Infinium Human Methylation 450 平台获取。首先,进行了全面的研究以检查两种肿瘤的平均 DNA 甲基化水平。t 检验显示两肿瘤之间的 DNA 甲基化水平差异显著,P<0.001。其次,生成了热图( Figure 4 )以可视化所有 CM 和 UM 样本的 DNA 甲基化水平。虽然在 CM 和 UM 之间可以观察到明显的甲基化差异,但在性别和种族方面未发现明显差异。
Figure 4. DNA methylation landscape across all CM and UM samples.
图 4. 所有 CM 和 UM 样本的 DNA 甲基化图谱。
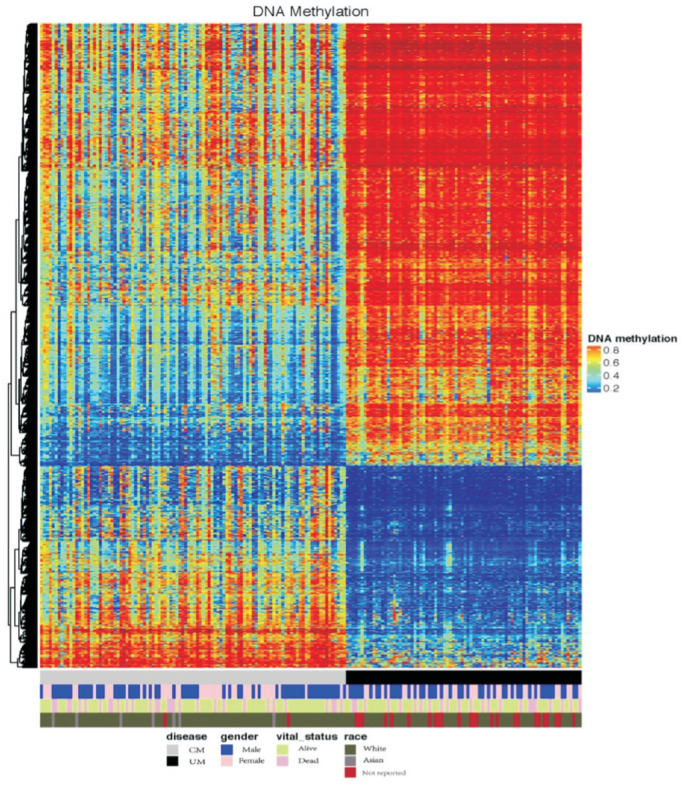
The heatmap shows the DNA methylation levels across CM and UM samples. Covariate tracks show the subtypes of diseases, genders, vital statuses and races.
热图显示了 CM 和 UM 样本的 DNA 甲基化水平。协变量轨迹展示了疾病的亚型、性别、生存状态和种族。
DEGs and DNA Methylation
DEGs 和 DNA 甲基化
DNA methylation locating at promoters has been confirmed to have a silencing effect on the respective genes[10]. To investigate the methylation differences between CM and UM, a starburst plot was produced based on the differentially methylated CpG sites and nearby genes (Figure 5). DNA methylation [log10(FDR-corrected P-value)] and DEGs' expression [log10(FDR-corrected P-value)] were plotted on the x-axis and y-axis, respectively. Both of the horizontal and vertical black dashed lines presented an FDR-adjusted P value of 10−5. We noticed that most DEGs were downregulated in UM. Within the downregulated DEGs, hypo- and hypermethylation presented no obvious difference.
位于启动子区域的 DNA 甲基化已被证实对相应基因具有沉默效应 [10] 。为了研究 CM 和 UM 之间的甲基化差异,基于差异甲基化的 CpG 位点和附近基因,生成了星爆图 Figure 5 。DNA 甲基化[对数 FDR 校正 P 值]在 x 轴上绘制,DEGs 的表达[对数 FDR 校正 P 值]在 y 轴上绘制。横纵坐标上的黑色虚线分别表示 FDR 调整后的 P 值为 10 −5 。我们注意到,大多数 DEGs 在 UM 中下调。在下调的 DEGs 中,低甲基化和高甲基化之间没有明显差异。
Figure 5. Starburst plot based on the differentially methylated CpG sites and nearby genes.
图 5. 基于差异甲基化 CpG 位点及其附近基因的星爆图。

DNA methylation [log10(FDR-corrected P-value)] and DEGs' expression [log10(FDR-corrected P-value)] were plotted on the x-axis and y-axis, respectively. Both of the horizontal and vertical black dashed lines presented an FDR-adjusted P value of 10−5.
DNA 甲基化 [log 10 (FDR 校正 P 值)] 和差异表达基因(DEGs)的表达 [log 10 (FDR 校正 P 值)] 分别被绘制在 x 轴和 y 轴上。横竖两个黑色虚线均表示 FDR 调整后的 P 值为 10 −5 。
miRNA
Totally 485 differentially expressed miRNAs were identified. The top 20 miRNAs were presented and ordered by the absolute value of logFC in Table 2. Despite miR-124-1, the other 19 miRNAs were all downregulated in UM. Recent investigations indicated that miR-205, miR-206, miR-203a, miR-124, miR-105-1, miR-200c and miR-516b was significantly downregulated in several types of malignancies[11]–[16].
总共识别出 485 个差异表达的 miRNA。按 logFC 的绝对值排序,列出了前 20 个 miRNA。尽管 miR-124-1 下调,其他 19 个 miRNA 在 UM 中均下调。最近的研究表明,miR-205、miR-206、miR-203a、miR-124、miR-105-1、miR-200c 和 miR-516b 在多种恶性肿瘤中显著下调[ [11] – [16] ]。
Table 2. Top 20 differentially expressed miRNAs.
表 2. 差表达的前 20 种 miRNA
| miRNAs miRNA | logFC | logCPM | LR | P value P 值 | FDR | ABS (logFC) ABS(logFC) |
| miR-205 | -12.66967581 | 10.2741151 | 325.471682 | 9.31E-73 | 3.23E-70 | 12.6696758 |
| miR-1269b | -7.792267345 | 4.38439951 | 84.2362378 | 4.39E-20 | 5.21E-19 | 7.79226735 |
| miR-206 | -7.443771468 | 5.27880962 | 101.090716 | 8.79E-24 | 1.27E-22 | 7.44377147 |
| miR-4431 | -7.339842966 | 3.98045621 | 182.799675 | 1.19E-41 | 6.59E-40 | 7.33984297 |
| miR-615 | -7.238077 | 3.1900144 | 593.84844 | 3.65E-131 | 5.06E-128 | 7.238077 |
| miR-520c | -6.93553871 | 1.33684989 | 50.5823292 | 1.14E-12 | 8.35E-12 | 6.93553871 |
| miR-520b | -6.566167424 | 3.31422137 | 52.0846379 | 5.32E-13 | 4.01E-12 | 6.56616742 |
| miR-519a-1 | -6.529184223 | 5.01683563 | 71.5554615 | 2.70E-17 | 2.69E-16 | 6.52918422 |
| miR-203a | -6.507885127 | 13.6642122 | 212.183766 | 4.59E-48 | 3.54E-46 | 6.50788513 |
| miR-6510 | -6.46737802 | 1.68143693 | 61.7217392 | 3.96E-15 | 3.50E-14 | 6.46737802 |
| miR-767 | -6.317311885 | 7.78594041 | 150.26145 | 1.52E-34 | 4.49E-33 | 6.31731189 |
| miR-520f | -6.24965796 | 2.21361008 | 42.5022762 | 7.06E-11 | 4.23E-10 | 6.24965796 |
| miR-520g | -6.176848445 | 2.10505402 | 42.8267251 | 5.98E-11 | 3.63E-10 | 6.17684845 |
| miR-122 | -6.050454709 | 3.21884414 | 45.4044877 | 1.60E-11 | 1.03E-10 | 6.05045471 |
| miR-124-1 | 5.923243919 | 0.97794058 | 111.232904 | 5.26E-26 | 8.80E-25 | 5.92324392 |
| miR-519a-2 | -5.857701837 | 3.44673364 | 44.6804669 | 2.32E-11 | 1.46E-10 | 5.85770184 |
| miR-526b | -5.83801509 | 4.97960824 | 64.9939422 | 7.51E-16 | 7.06E-15 | 5.83801509 |
| miR-105-1 | -5.830972062 | 7.53994162 | 135.995571 | 2.00E-31 | 4.96E-30 | 5.83097206 |
| miR-200c | -5.820556883 | 9.58139161 | 293.602553 | 8.16E-66 | 1.89E-63 | 5.82055688 |
| miR-516b-1 | -5.782752272 | 2.0656276 | 34.4289993 | 4.42E-09 | 2.19E-08 | 5.78275227 |
FC: Fold change; CPM: Counts per million; LR: Likelihood ratio; FDR: False discovery rate; ABS: Absolute value.
FC: 倍数变化;CPM: 百万计数;LR: 似然比;FDR: 假发现率;ABS: 绝对值。
Differentially Expressed Master Transcription Factors
差异表达主转录因子
In the hypomethylated (comparative hypomethylated in CM than in UM) direction, 39 enrichment motifs were identified while 66 were identified in the hypermethylated direction. Basing on the identified enriched motifs, we found 114 and 116 potential differentially expressed master TFs in hypomethylated and hypermethylated direction, respectively. Many of the identified master regulatory TFs were associated with the epithelial mesenchymal transition (EMT). Particularly, the acknowledged core EMT-TFs, i.e. SNAI1, SNAI2, TWIST1 and SIX1 were found to be relatively more hypomethylated in the CM than in the UM[17].
在低甲基化方向(CM 相比 UM 低甲基化),共识别出 39 个富集 motif,而在高甲基化方向则识别出 66 个富集 motif。基于识别出的富集 motif,我们分别发现了 114 个和 116 个潜在差异表达的主调控 TFs,分别对应低甲基化和高甲基化方向。许多识别出的主调控 TFs 与上皮-间质转化(EMT)相关。特别是公认的 EMT 核心 TFs,即 SNAI1、SNAI2、TWIST1 和 SIX1,在 CM 中的低甲基化程度明显高于 UM。
DISCUSSION 讨论
Progress in elucidating the cellular and molecular distinctions between CM and UM has been made majorly in form of directly comparing results from isolated studies of the two tumors which might be restricted by the former studies' design and heterogeneity of the data. The publicly available data in the TCGA provide an optimal method to conduct a comprehensive study which can avoid the aforementioned problems. The findings of this multi-omics study enable us to elucidate the important problems concerning both malignancies like the role of EMT in CM and UM, the distinctive metastatic routes and organs' tropism.
在阐明 CM 和 UM 的细胞和分子差异方面取得了重大进展,主要通过直接比较两种肿瘤孤立研究的结果,但这些研究可能受限于前者研究的设计和数据的异质性。TCGA 提供的公开数据为进行全面研究提供了最佳方法,可以避免上述问题。本多组学研究的发现使我们能够阐明涉及这两种恶性肿瘤的重要问题,如 EMT 在 CM 和 UM 中的作用、独特的转移途径以及器官趋向性。
The Role of Epithelial Mesenchymal Transition
上皮-间质转化的作用
The top 20 most frequently mutated genes supported the acknowledged key role of BRAF and GNAQ/11 in the etiopathogenesis of CM and UM, respectively[18]–[19]. While GNAQ/11 mutations were found almost uniquely in the UM, the majority of the other 18 mutated genes (including BRAF) were presented by the CM samples. Within the 18 mutated genes, MUC16, PCLO, DNAH5, DNAH7, DNAH9, ADGRV1, ANK3, FAT4 and XIRP2 encoded cytoskeleton- and extracellular matrix-related proteins (CECMPs) which were reported to provide the most common class of cancer mutants and estimated to play a role in the EMT[20]–[23].
最常见的 20 个突变基因支持了 BRAF 和 GNAQ/11 在 CM 和 UM 发病机制中的公认关键作用—— [18] – [19] 。虽然 GNAQ/11 突变几乎仅限于 UM,但其他 18 个突变基因(包括 BRAF)主要出现在 CM 样本中。在这 18 个突变基因中,MUC16、PCLO、DNAH5、DNAH7、DNAH9、ADGRV1、ANK3、FAT4 和 XIRP2 编码细胞骨架和细胞外基质相关蛋白(CECMPs),这些蛋白被认为是癌症中最常见的突变类型,并被认为在上皮-间质转化(EMT)中发挥作用—— [20] – [23] 。
On the transcriptomic level, it's noteworthy that eight of top 20-DEGs are keratin family members which were regarded as epithelial markers. And several previous studies implied that keratins may play a role in the progression of CM[24]. Besides, the DEGs-listed FN1, SERPINE 2, TNC, EEF2 and COL1A1 were also regarded as EMT-associated genes which could contribute to the proliferation, differentiation and migration of tumors[25]–[29].
在转录组水平上,值得注意的是,最常见的 20 个差异表达基因中有 8 个是角蛋白家族成员,被认为是上皮标志物。此前的一些研究提示角蛋白可能在 CM 的进展中发挥作用—— [24] 。此外,差异表达基因列表中的 FN1、SERPINE 2、TNC、EEF2 和 COL1A1 也被认为是与 EMT 相关的基因,能够促进肿瘤的增殖、分化和迁移—— [25] – [29] 。
Additionally, 13 of the top 20 differentially expressed miRNAs were previously reported to participate in the EMT. And they were all less expressed in CM samples than in UM samples. Ten of the 13 miRNAs, i.e. miR-205, 520c, 520b, 203a, 520f, 122, 124, 526b and 200c, were reported to negatively regulate the EMT through a variety of downstream genes like CDH1, ZEB1, ZEB2, ADAM9, TGFBR2, SNAI2, ERK, MYC, CCND1, JUN and SNAI1 etc[30]–[37]. Thus, we estimate that the relative low expression of these miRNAs in CM would promote the EMT. Nevertheless, the other three miRNAs, miR-520g, 105 and 1269a were reported to positively regulate the EMT through cooperating with SMAD7, TNF, TGFB and SOX4[38]–[40]. Therefore, more in-depth studies are needed to help elucidate the role of miRNAs in CM and UM.
此外,20 个差异表达的 miRNA 中有 13 个之前被报道参与了上皮-间质转化(EMT)。这些 miRNA 在 CM 样本中的表达量均低于 UM 样本。在这 13 个 miRNA 中,有 10 个被报道通过多种下游基因(如 CDH1、ZEB1、ZEB2、ADAM9、TGFBR2、SNAI2、ERK、MYC、CCND1、JUN 和 SNAI1 等)负向调控 EMT [30] – [37] 。因此,我们估计这些 miRNA 在 CM 中的相对低表达会促进 EMT。然而,另外 3 个 miRNA(miR-520g、105 和 1269a)被报道通过与 SMAD7、TNF、TGFB 和 SOX4 等合作正向调控 EMT [38] – [40] 。因此,需要更深入的研究来阐明 miRNA 在 CM 和 UM 中的作用。
In addition, the role of the EMT in differentiating CM and UM was also confirmed by the analysis of differentially expressed master regulatory TFs. In the 114 identified hypomethylated master regulatory TFs (TFs hypomethylated in CM compared to UM), the first three TFs were LEF1, E2F2 and TRIM62. They were all suggested to positively regulate the EMT[41]–[43]. After a brief MeSH (Medical Subject Headings) search on “Google Scholar” (https://scholar.google.com/) until Nov. 01, 2018, at least 65 TFs were previously reported to participate in the EMT, with 57 positively-regulating TFs (including three acknowledged key EMT-TFs, SNAI1, TWIST1 and SIX1) and 8 negatively-regulating TFs.
此外,通过分析差异表达的主调控转录因子(TFs),EMT 在区分 CM 和 UM 中的作用也得到了确认。在 114 个被识别为低甲基化的主调控 TFs 中(与 UM 相比,CM 中的 TFs 低甲基化),前三位分别是 LEF1、E2F2 和 TRIM62。它们都被认为能够正向调节 EMT。截至 2018 年 11 月 1 日在“Google Scholar”上进行简要的 MeSH(医学主题词)搜索,至少有 65 个 TFs 被报道参与 EMT,其中 57 个是正向调节 TFs(包括三个公认的 EMT 关键 TFs,SNAI1、TWIST1 和 SIX1),8 个是负向调节 TFs。
Among the 116 TFs, which were identified as relatively more hypermethylated in CM when compared with UM, we found at least 42 EMT-associated TFs after a brief MeSH search on “Google Scholar”. While 19 of them were reported to negatively regulate the EMT, 23 were found to promote the EMT. Theoretically, the hypermethylation of the 19 negatively-regulating TFs would contribute to the EMT which would support our hypothesis that CM undergoes a more obvious EMT than UM. On the contrary, the hypermethylation of the 23 positively-regulating TFs were supposed to suppress the EMT. Thus, more relevant studies are needed to present a more precise landscape of the TFs' regulating network in these two tumors.
在 116 个被识别为在 CM 中相对高甲基化的 TF 中,我们通过在“Google Scholar”上进行简要的 MeSH 搜索,发现了至少 42 个与 EMT 相关的 TF。其中,有 19 个 TF 被报道负向调节 EMT,而 23 个 TF 被发现促进 EMT。理论上,19 个负向调节 TF 的高甲基化会促进 EMT,这支持了我们的假设,即 CM 比 UM 经历更明显的 EMT。相反,23 个正向调节 TF 的高甲基化可能会抑制 EMT。因此,需要更多的相关研究来呈现这两个肿瘤中 TF 调节网络的更精确图景。
In summary, our multi-omics results indicate that many distinctions between CM and UM were associated with the EMT.
总之,我们的多组学结果表明,CM 和 UM 之间的许多差异与上皮-间质转化(EMT)有关。
Metastatic Routes 转移途径
While CM was estimated to spread through hematologic as well as lymphatic dissemination, UM was believed to only metastasize hematogenously[44]. The lymphatic endothelial cells were reported to secrete chemokines such as chemokine (C-C motif) ligand 21 (CCL21) and stroma cell derived factor-1 (SDF-1) which could stimulate the chemotaxis via the respective receptors C-C chemokine receptor 7 (CCR7) and leucine aminopeptidase 3 (LAP3) on tumor cells[45]–[46]. Besides, integrin α4β1 expressed on lymphatic vessels was also confirmed to play an essential role in the cancer-associated lymphangiogenesis through binding the corresponding ligands such as vascular cell adhesion molecule-1 (VCAM-1), fibronectin 1 (FN1)[47]–[48]. Because the lymphatic dissemination was not estimated to be involved in the metastasis of UM, we conject that the expression of CCR7, LAP3, VCAM-1 and FN1 might be lower expressed in UM when compared with CM. Supporting this, the DEGs' list showed that CCR7 (logFC=-2.378070086), LAP3 (logFC=-1.11), VCAM-1 (logFC=-1.63) and FN1 (logFC=-4.63) were all significantly lower expressed in UM. In addition, we also checked the expression of VEGFC and VEGFD in the DEGs' list because of the established involvement of VEGFC/D induced lymphangiogenesis in tumor metastasis[49]. While VEGFC and VEGFD were not presented in the DEGs, we observed that VEGFA was lower expressed in UM with a logFC of -1.69 (i.e. significantly higher expressed in CM). Basing on a study in mouse, Björndahl et al[50] and colleagues confirmed that the VEGFA induced lymphangiogenesis was independent from the VEGFC/D pathway. Thus, further studies are encouraged to examine the potential role of VEGFA in the lymph angiogenesis of CM.
虽然 CM 被认为通过血液和淋巴系统扩散,而 UM 则仅通过血液转移 [44] 。淋巴管内皮细胞被报道分泌趋化因子如 C-C 基序趋化因子配体 21(CCL21)和基质细胞衍生因子-1(SDF-1),这些趋化因子可通过相应的受体 C-C 基序趋化因子受体 7(CCR7)和亮氨肽酶 3(LAP3)刺激肿瘤细胞的趋化性 [45] – [46] 。此外,淋巴管上表达的整合素α4β1 也被证实通过结合相应的配体如血管细胞黏附分子-1(VCAM-1)、纤维连接蛋白 1(FN1)在与癌症相关的淋巴管生成中发挥重要作用 [47] – [48] 。由于淋巴系统扩散未被认为参与 UM 的转移,我们推测 UM 中 CCR7、LAP3、VCAM-1 和 FN1 的表达可能低于 CM。支持这一观点的是,差异表达基因列表显示,CCR7(logFC=-2.378070086)、LAP3(logFC=-1.11)、VCAM-1(logFC=-1.63)和 FN1(logFC=-4.63)在 UM 中的表达均显著降低。 此外,我们还检查了 DEGs 列表中 VEGFC 和 VEGFD 的表达情况,因为已有研究表明 VEGFC/D 诱导的淋巴管生成在肿瘤转移中起作用 [49] 。虽然 VEGFC 和 VEGFD 未出现在 DEGs 中,但我们发现 UM 中 VEGFA 的表达量较低,logFC 为-1.69(即在 CM 中显著高表达)。基于 Björndahl 等人的研究 [50] ,他们证实 VEGFA 诱导的淋巴管生成与 VEGFC/D 途径无关。因此,鼓励进一步研究 VEGFA 在 CM 淋巴管生成中的潜在作用。
Liver Tropism of the Metastatic UM
转移性 UM 的肝 tropism
Though CM has no metastatic propensity for the liver, metastatic UM has an obvious unexplained liver tropism. Previous studies of UM have shown that the increased expression of Met gene in the primary tumors would promote the liver metastasis[51]. It was estimated that the liver propensity occurred because of the high HGF expression in the liver cell membrane surface. The activation of Met by binding hepatocyte growth factor (HGF) would lead to a series of downstream reactions which resulted in tumor cell proliferation and progression[52]. Our DEGs' results confirmed the relatively higher expression of Met in UM than in CM (logFC=2.04). Besides, Krüger et al[53] reported that the inhibition of matrix metalloproteinases (MMPs) would increase the expression level of HGF in the liver, thus promote the metastasis formation. In agreement with this, 13 MMP mRNAs in the DEGs were lower expressed in UM than in CM.
尽管皮肤黑色素瘤(CM)没有向肝脏转移的倾向,但黏膜黑色素瘤(UM)却有明显的、无法解释的肝脏倾向。先前对 UM 的研究表明,原发肿瘤中 Met 基因的高表达会促进肝脏转移 [51] 。据估计,这种肝脏倾向是因为肝脏细胞膜表面 HGF 表达较高。HGF 与 Met 结合后激活 Met,会引发一系列下游反应,导致肿瘤细胞的增殖和进展 [52] 。我们的差异表达基因(DEGs)结果证实,UM 中 Met 的表达量明显高于 CM(logFC=2.04)。此外,Krüger 等人 [53] 报道,抑制基质金属蛋白酶(MMPs)会增加肝脏中 HGF 的表达水平,从而促进转移灶的形成。与此一致的是,DEGs 中有 13 种 MMP mRNA 在 UM 中的表达量低于 CM。
Moreover, basing on a study on UM, Laurent et al[54] have reported that the high expression of PTP4A3 could be seen as a predictor for liver tropism. Correspondingly, our study has proved that the PTP4A3 mRNA was significantly higher expressed in UM than in CM (logFC=1.91).
此外,基于对 UVM 的研究,Laurent 等人 [54] 报道高表达的 PTP4A3 可以被视为肝倾向的预测因子。相应地,我们的研究证明在 UVM 中 PTP4A3 mRNA 的表达显著高于 CM(logFC=1.91)。
In summary, the comparison between CM and UM from multiple perspectives presented a comprehensive illustration which provides us a better understanding of these two tumors and new insights for finding better treatment strategies.
综上所述,从多个角度比较 CM 和 UM,为我们全面展示了这两种肿瘤的特点,使我们对其有了更深入的理解,并为寻找更好的治疗策略提供了新的见解。
Acknowledgments 致谢
Foundations: Supported by the China Scholarship Council (CSC) Program (No.201708080023; No.201708080104); Deutsche Forschungsgemeinschaft and Open Access Publishing Fund of University of Tübingen.
基础研究:由中国国家留学基金委员会(CSC)项目(编号:201708080023;编号:201708080104)资助;德国研究基金会和图宾根大学开放获取出版基金。
Conflicts of Interest: Zhang Q, None; Lin ZN, None; Chen J, None; Zheng WX, None.
利益冲突:张 Q,无;林 ZN,无;陈 J,无;郑 WX,无。
REFERENCES 参考文献
-
1.van den Bosch T, Kilic E, Paridaens D, de Klein A. Genetics of uveal melanoma and cutaneous melanoma: two of a kind? Dermatol Res Pract. 2010;2010:360136. doi: 10.1155/2010/360136IF: 1.9 Q3 .IF: 1.9 Q3 [DOI] [PMC free article] [PubMed] [Google Scholar]
van den Bosch T, Kilic E, Paridaens D, de Klein A. 视网膜黑色素瘤和皮肤黑色素瘤的遗传学:同宗同源吗?皮肤研究与实践. 2010;2010:360136. doi: 10.1155/2010/360136IF: 1.9 Q3 IF: 1.9 Q3 -
2.Belmar-Lopez C, Mancheno-Corvo P, Saornil MA, Baril P, Vassaux G, Quintanilla M, Martin-Duque P. Uveal vs. cutaneous melanoma. Origins and causes of the differences. Clin Transl Oncol. 2008;10(3):137–142. doi: 10.1007/s12094-008-0170-4IF: 2.5 Q3 .IF: 2.5 Q3 [DOI] [PubMed] [Google Scholar]
Belmar-Lopez C, Mancheno-Corvo P, Saornil MA, Baril P, Vassaux G, Quintanilla M, Martin-Duque P. 脉络膜黑色素瘤 vs. 皮肤黑色素瘤:起源与差异的原因。临床转化肿瘤学。2008;10(3):137-142. doi: 10.1007/s12094-008-0170-4IF: 2.5 Q3 IF: 2.5 Q3 -
3.Pandiani C, Béranger GE, Leclerc J, Ballotti R, Bertolotto C. Focus on cutaneous and uveal melanoma specificities. Genes Dev. 2017;31(8):724–743. doi: 10.1101/gad.296962.117IF: 7.7 Q1 .IF: 7.7 Q1 [DOI] [PMC free article] [PubMed] [Google Scholar]
3.Pandiani C, Béranger GE, Leclerc J, Ballotti R, Bertolotto C. 皮肤和脉络膜黑色素瘤的特异性研究进展。基因与发展。2017;31(8):724–743。doi: 10.1101/gad.296962.117IF: 7.7 Q1 IF: 7.7 Q1 .IF: 7.7 Q1 [ ] [ PMC free article ] [ PubMed ] [ Google Scholar ] -
4.Leiserson MDM, Vandin F, Wu HT, Dobson JR, Eldridge JV, Thomas JL, Papoutsaki A, Kim Y, Niu BF, McLellan M, Lawrence MS, Gonzalez-Perez A, Tamborero D, Cheng YW, Ryslik GA, Lopez-Bigas N, Getz G, Ding L, Raphael BJ. Pan-cancer network analysis identifies combinations of rare somatic mutations across pathways and protein complexes. Nat Genet. 2015;47(2):106–114. doi: 10.1038/ng.3168IF: 29.0 Q1 .IF: 29.0 Q1 [DOI] [PMC free article] [PubMed] [Google Scholar]
4.Leiserson MDM, Vandin F, Wu HT, Dobson JR, Eldridge JV, Thomas JL, Papoutsaki A, Kim Y, Niu BF, McLellan M, Lawrence MS, Gonzalez-Perez A, Tamborero D, Cheng YW, Ryslik GA, Lopez-Bigas N, Getz G, Ding L, Raphael BJ. 跨通路和蛋白质复合体的泛癌网络分析识别出罕见体突变的组合。自然遗传学。2015;47(2):106–114。doi: 10.1038/ng.3168IF: 29.0 Q1 IF: 29.0 Q1 .IF: 29.0 Q1 [ ] [ PMC free article ] [ PubMed ] [ Google Scholar ] -
5.Liu J, Lichtenberg T, Hoadley KA, Poisson LM, Lazar AJ, Cherniack AD, Kovatich AJ, Benz CC, Levine DA, Lee AV, Omberg L, Wolf DM, Shriver CD, Thorsson V, Cancer Genome Atlas Research Network. Hu H. An integrated TCGA pan-cancer clinical data resource to drive high-quality survival outcome analytics. Cell. 2018;173(2):400–416.e11. doi: 10.1016/j.cell.2018.02.052IF: 42.5 Q1 .IF: 42.5 Q1 [DOI] [PMC free article] [PubMed] [Google Scholar]
5. 刘杰, 利 chtenberg T, Hoadley KA, Poisson LM, Lazar AJ, Cherniack AD, Kovatich AJ, Benz CC, Levine DA, Lee AV, Omberg L, Wolf DM, Shriver CD, Thorsson V, 肿瘤基因组图谱研究网络, 胡海. 集成 TCGA 泛癌临床数据资源以驱动高质量生存分析. 细胞. 2018;173(2):400–416.e11. doi: 10.1016/j.cell.2018.02.052IF: 42.5 Q1 IF: 42.5 Q1 .IF: 42.5 Q1 [ ] [ PMC free article ] [ PubMed ] [ Google Scholar ] -
6.Colaprico A, Silva TC, Olsen C, Garofano L, Cava C, Garolini D, Sabedot TS, Malta TM, Pagnotta SM, Castiglioni I, Ceccarelli M, Bontempi G, Noushmehr H. TCGAbiolinks: an R/Bioconductor package for integrative analysis of TCGA data. Nucleic Acids Res. 2016;44(8):e71. doi: 10.1093/nar/gkv1507IF: 13.1 Q1 .IF: 13.1 Q1 [DOI] [PMC free article] [PubMed] [Google Scholar]
6. Colaprico A, Silva TC, Olsen C, Garofano L, Cava C, Garolini D, Sabedot TS, Malta TM, Pagnotta SM, Castiglioni I, Ceccarelli M, Bontempi G, Noushmehr H. TCGAbiolinks: 一个用于 TCGA 数据综合分析的 R/Bioconductor 包. Nucleic Acids Res. 2016;44(8):e71. doi: 10.1093/nar/gkv1507IF: 13.1 Q1 IF: 13.1 Q1 IF: 13.1 Q1 [ ] [ PMC free article ] [ PubMed ] [ Google Scholar ] -
7.Silva TC, Colaprico A, Olsen C, Bontempi G, Ceccarelli M, Berman BP, Noushmehr H. TCGAbiolinksGUI: a graphical user interface to analyze cancer molecular and clinical data. F1000 Research. 2017;7:439. [Google Scholar]
7. Silva TC, Colaprico A, Olsen C, Bontempi G, Ceccarelli M, Berman BP, Noushmehr H. TCGAbiolinksGUI:一种用于分析癌症分子和临床数据的图形用户界面。F1000 Research. 2017;7:439. [ Google Scholar ] -
8.Silva TC, Coetzee SG, Yao L, Hazelett DJ, Noushmehr H, Berman BP. Enhancer linking by methylation/expression relationships with the R package ELMER version 2. bioRxiv. 2017:148726. [Google Scholar]
8.Silva TC, Coetzee SG, Yao L, Hazelett DJ, Noushmehr H, Berman BP. 通过甲基化/表达关系连接增强子的 R 包 ELMER 版本 2. bioRxiv. 2017:148726. [ Google Scholar ] -
9.Robertson AG, Shih J, Yau C, et al. Integrative analysis identifies four molecular and clinical subsets in uveal melanoma. Cancer Cell. 2018;33(1):151. doi: 10.1016/j.ccell.2017.12.013IF: 44.5 Q1 .IF: 44.5 Q1 [DOI] [PubMed] [Google Scholar]
9.Robertson AG, Shih J, Yau C, 等. 综合分析识别出脉络膜黑色素瘤中的四个分子和临床亚型。Cancer Cell. 2018;33(1):151. doi: 10.1016/j.ccell.2017.12.013IF: 44.5 Q1 IF: 44.5 Q1 .IF: 44.5 Q1 [ ] [ PubMed ] [ Google Scholar ] -
10.Lister R, Pelizzola M, Dowen RH, Hawkins RD, Hon G, Tonti-Filippini J, Nery JR, Lee L, Ye Z, Ngo QM, Edsall L, Antosiewicz-Bourget J, Stewart R, Ruotti V, Millar AH, Thomson JA, Ren B, Ecker JR. Human DNA methylomes at base resolution show widespread epigenomic differences. Nature. 2009;462(7271):315–322. doi: 10.1038/nature08514IF: 48.5 Q1 .IF: 48.5 Q1 [DOI] [PMC free article] [PubMed] [Google Scholar]
10.Lister R, Pelizzola M, Dowen RH, Hawkins RD, Hon G, Tonti-Filippini J, Nery JR, Lee L, Ye Z, Ngo QM, Edsall L, Antosiewicz-Bourget J, Stewart R, Ruotti V, Millar AH, Thomson JA, Ren B, Ecker JR. 人类 DNA 甲基化组在单碱基分辨率下显示广泛的表观遗传学差异。Nature. 2009;462(7271):315–322. doi: 10.1038/nature08514IF: 48.5 Q1 IF: 48.5 Q1 .IF: 48.5 Q1 [ ] [ PMC free article ] [ PubMed ] [ Google Scholar ] -
11.Xu Y, Brenn T, Brown ER, Doherty V, Melton DW. Differential expression of microRNAs during melanoma progression: miR-200c, miR-205 and miR-211 are downregulated in melanoma and act as tumour suppressors. Br J Cancer. 2012;106(3):553–561. doi: 10.1038/bjc.2011.568IF: 6.8 Q1 .IF: 6.8 Q1 [DOI] [PMC free article] [PubMed] [Google Scholar]
11.徐宇, 布伦 T, 布朗 ER, 多赫 erty V, 梅尔顿 DW. 黑色素瘤进展过程中微小 RNA 的差异表达:miR-200c、miR-205 和 miR-211 在黑色素瘤中下调并作为肿瘤抑制因子起作用。英国癌症杂志. 2012;106(3):553–561. doi: 10.1038/bjc.2011.568IF: 6.8 Q1 IF: 6.8 Q1 -
12.Georgantas RW, 3rd, Streicher K, Luo XB, Greenlees L, Zhu W, Liu Z, Brohawn P, Morehouse C, Higgs BW, Richman L, Jallal B, Yao YH, Ranade K. MicroRNA-206 induces G1 arrest in melanoma by inhibition of CDK4 and Cyclin D. Pigment Cell Melanoma Res. 2014;27(2):275–286. doi: 10.1111/pcmr.12200IF: 2.6 Q2 .IF: 2.6 Q2 [DOI] [PubMed] [Google Scholar]
12.乔治纳斯 RW,斯特里彻 K, Luo XB,格林利斯 L,朱 W,刘 Z,布罗豪恩 P,莫雷豪斯 C,希格斯 BW,里奇曼 L,贾拉尔 B,姚 YH,拉纳德 K. 微小 RNA-206 通过抑制 CDK4 和 cyclin D 诱导黑色素瘤 G1 期阻滞. 色素细胞与黑色素瘤研究. 2014;27(2):275–286. doi: 10.1111/pcmr.12200.IF: 2.6 Q2 [ ] [ PubMed ] [ Google Scholar ] -
13.Bu PY, Yang P. MicroRNA-203 inhibits malignant melanoma cell migration by targeting versican. Exp Ther Med. 2014;8(1):309–315. doi: 10.3892/etm.2014.1708IF: 2.3 Q3 .IF: 2.3 Q3 [DOI] [PMC free article] [PubMed] [Google Scholar] [Retracted]
13.布 PY,杨 P. 微小 RNA-203 通过靶向硫酸乙酰肝素蛋白聚糖抑制恶性黑色素瘤细胞迁移. 实验与治疗医学. 2014;8(1):309–315. doi: 10.3892/etm.2014.1708.IF: 2.3 Q3 [ ] [ PMC free article ] [ PubMed ] [ Google Scholar ] [ 已撤回] - 14.Zhang W, Mao YQ, Wang H, Yin WJ, Zhu SX, Wang WC. MiR-124 suppresses cell motility and adhesion by targeting talin 1 in prostate cancer cells. Cancer Cell Int. 2015;15:49. doi: 10.1186/s12935-015-0189-xIF: 6.0 Q1 .IF: 6.0 Q1 [DOI] [PMC free article] [PubMed] [Google Scholar]
- 15.Lu GX, Fu D, Jia CY, Chai L, Han Y, Liu J, Wu TM, Xie RT, Chang ZY, Yang HQ, Luo P, Lv Z, Yu F, Zhong XJ, Ma YS. Reduced miR-105-1 levels are associated with poor survival of patients with non-small cell lung cancer. Oncol Lett. 2017;14(6):7842–7848. doi: 10.3892/ol.2017.7228IF: 2.2 Q3 .IF: 2.2 Q3 [DOI] [PMC free article] [PubMed] [Google Scholar]
- 16.Zhao YF, Wang YQ, Xing GC. miR-516b functions as a tumor suppressor by directly modulating CCNG1 expression in esophageal squamous cell carcinoma. Biomedecine Pharmacother. 2018;106:1650–1660. doi: 10.1016/j.biopha.2018.07.074IF: 7.5 Q1 .IF: 7.5 Q1 [DOI] [PubMed] [Google Scholar]
- 17.Puisieux A, Brabletz T, Caramel J. Oncogenic roles of EMT-inducing transcription factors. Nat Cell Biol. 2014;16(6):488–494. doi: 10.1038/ncb2976IF: 19.1 Q1 .IF: 19.1 Q1 [DOI] [PubMed] [Google Scholar]
- 18.Van Raamsdonk CD, Griewank KG, Crosby MB, et al. Mutations in GNA11 in uveal melanoma. N Engl J Med. 2010;363(23):2191–2199. doi: 10.1056/NEJMoa1000584IF: 78.5 Q1 .IF: 78.5 Q1 [DOI] [PMC free article] [PubMed] [Google Scholar]
- 19.Spendlove HE, Damato BE, Humphreys J, Barker KT, Hiscott PS, Houlston RS. BRAF mutations are detectable in conjunctival but not uveal melanomas. Melanoma Res. 2004;14(6):449–452. doi: 10.1097/00008390-200412000-00003IF: 1.9 Q3 .IF: 1.9 Q3 [DOI] [PubMed] [Google Scholar]
- 20.Parry ML, Ramsamooj M, Blanck G. Big genes are big mutagen targets: a connection to cancerous, spherical cells? Cancer Lett. 2015;356(2 Pt B):479–482. doi: 10.1016/j.canlet.2014.09.044IF: 10.1 Q1 .IF: 10.1 Q1 [DOI] [PubMed] [Google Scholar]
- 21.Parry ML, Blanck G. Flat cells come full sphere: are mutant cytoskeletal-related proteins oncoprotein-monsters or useful immunogens? Hum Vaccin Immunother. 2016;12(1):120–123. doi: 10.1080/21645515.2015.1073428IF: 3.5 Q2 .IF: 3.5 Q2 [DOI] [PMC free article] [PubMed] [Google Scholar]
- 22.Fawcett TJ, Parry ML, Blanck G. A novel approach to evaluating cancer driver gene mutation densities: cytoskeleton-related gene candidates. Cancer Genomics Proteomics. 2015;12(6):283–290. [PubMed] [Google Scholar]
- 23.Kumar S, Das A, Sen S. Extracellular matrix density promotes EMT by weakening cell-cell adhesions. Mol Biosyst. 2014;10(4):838–850. doi: 10.1039/c3mb70431a. [DOI] [PubMed] [Google Scholar]
- 24.Koh SS, Wei JP, Li XM, Huang RR, Doan NB, Scolyer RA, Cochran AJ, Binder SW. Differential gene expression profiling of primary cutaneous melanoma and sentinel lymph node metastases. Mod Pathol. 2012;25(6):828–837. doi: 10.1038/modpathol.2012.32IF: 5.5 Q1 .IF: 5.5 Q1 [DOI] [PubMed] [Google Scholar]
- 25.Takano N, Kawakami T, Kawa Y, Asano M, Watabe H, Ito M, Soma Y, Kubota Y, Mizoguchi M. Fibronectin combined with stem cell factor plays an important role in melanocyte proliferation, differentiation and migration in cultured mouse neural crest cells. Pigment Cell Res. 2002;15(3):192–200. doi: 10.1034/j.1600-0749.2002.01079.x. [DOI] [PubMed] [Google Scholar]
- 26.Wu QW. Serpine2, a potential novel target for combating melanoma metastasis. Am J Transl Res. 2016;8(5):1985–1997. [PMC free article] [PubMed] [Google Scholar]
- 27.Song Y, Sun B, Hao LH, Hu J, Du S, Zhou X, Zhang LY, Liu L, Gong LL, Chi XM, Liu Q, Shao SJ. Elevated eukaryotic elongation factor 2 expression is involved in proliferation and invasion of lung squamous cell carcinoma. Oncotarget. 2016;7(36):58470–58482. doi: 10.18632/oncotarget.11298. [DOI] [PMC free article] [PubMed] [Google Scholar]
- 28.Katoh D, Nagaharu K, Shimojo N, Hanamura N, Yamashita M, Kozuka Y, Imanaka-Yoshida K, Yoshida T. Binding of αvβ1 and αvβ6 integrins to tenascin-C induces epithelial-mesenchymal transition-like change of breast cancer cells. Oncogenesis. 2013;2:e65. doi: 10.1038/oncsis.2013.27IF: 6.4 Q1 .IF: 6.4 Q1 [DOI] [PMC free article] [PubMed] [Google Scholar]
- 29.Hosper NA, van den Berg PP, de Rond S, Popa ER, Wilmer MJ, Masereeuw R, Bank RA. Epithelial-to-mesenchymal transition in fibrosis: collagen type I expression is highly upregulated after EMT, but does not contribute to collagen deposition. Exp Cell Res. 2013;319(19):3000–3009. doi: 10.1016/j.yexcr.2013.07.014IF: 3.5 Q2 .IF: 3.5 Q2 [DOI] [PubMed] [Google Scholar]
- 30.Gregory PA, Bert AG, Paterson EL, Barry SC, Tsykin A, Farshid G, Vadas MA, Khew-Goodall Y, Goodall GJ. The miR-200 family and miR-205 regulate epithelial to mesenchymal transition by targeting ZEB1 and SIP1. Nat Cell Biol. 2008;10(5):593–601. doi: 10.1038/ncb1722IF: 19.1 Q1 .IF: 19.1 Q1 [DOI] [PubMed] [Google Scholar]
- 31.van Kampen JGM, van Hooij O, Jansen CF, Smit FP, van Noort PI, Schultz I, Schaapveld RQJ, Schalken JA, Verhaegh GW. miRNA-520f reverses epithelial-to-mesenchymal transition by targeting ADAM9 and TGFBR2. Cancer Res. 2017;77(8):2008–2017. doi: 10.1158/0008-5472.CAN-16-2609IF: 16.6 Q1 .IF: 16.6 Q1 [DOI] [PubMed] [Google Scholar]
- 32.Lu YC, Cheng AJ, Lee LY, You GR, Li YL, Chen HY, Chang JT. MiR-520b as a novel molecular target for suppressing stemness phenotype of head-neck cancer by inhibiting CD44. Sci Rep. 2017;7(1):2042. doi: 10.1038/s41598-017-02058-8IF: 3.9 Q1 .IF: 3.9 Q1 [DOI] [PMC free article] [PubMed] [Google Scholar]
- 33.Tang CP, Zhou HJ, Qin J, Luo Y, Zhang T. MicroRNA-520c-3p negatively regulates EMT by targeting IL-8 to suppress the invasion and migration of breast cancer. Oncol Rep. 2017;38(5):3144–3152. doi: 10.3892/or.2017.5968IF: 3.9 Q2 .IF: 3.9 Q2 [DOI] [PubMed] [Google Scholar]
- 34.Liang YJ, Wang QY, Zhou CX, Yin QQ, He M, Yu XT, Cao DX, Chen GQ, He JR, Zhao Q. MiR-124 targets Slug to regulate epithelial-mesenchymal transition and metastasis of breast cancer. Carcinogenesis. 2013;34(3):713–722. doi: 10.1093/carcin/bgs383IF: 2.9 Q2 .IF: 2.9 Q2 [DOI] [PMC free article] [PubMed] [Google Scholar]
- 35.Liu X, Yang L, Tu JF, Cai WW, Zhang MQ, Shou ZX, Yao YM, Xu QR. microRNA-526b servers as a prognostic factor and exhibits tumor suppressive property by targeting Sirtuin 7 in hepatocellular carcinoma. Oncotarget. 2017;8(50):87737–87749. doi: 10.18632/oncotarget.21209. [DOI] [PMC free article] [PubMed] [Google Scholar]
- 36.Qin HF, Sha JP, Jiang CX, Gao XM, Qu LL, Yan HY, Xu TJ, Jiang QY, Gao HJ. miR-122 inhibits metastasis and epithelial-mesenchymal transition of non-small-cell lung cancer cells. Onco Targets Ther. 2015;8:3175–3184. doi: 10.2147/OTT.S91696IF: 2.8 Q2 .IF: 2.8 Q2 [DOI] [PMC free article] [PubMed] [Google Scholar]
- 37.Liu DJ, Wu JL, Liu MZ, Yin H, He JT, Zhang B. Downregulation of miRNA-30c and miR-203a is associated with hepatitis C virus core protein-induced epithelial-mesenchymal transition in normal hepatocytes and hepatocellular carcinoma cells. Biochem Biophys Res Commun. 2015;464(4):1215–1221. doi: 10.1016/j.bbrc.2015.07.107IF: 2.2 Q3 .IF: 2.2 Q3 [DOI] [PubMed] [Google Scholar]
- 38.Kan HP, Guo WB, Huang YQ, Liu DL. MicroRNA-520g induces epithelial-mesenchymal transition and promotes metastasis of hepatocellular carcinoma by targeting SMAD7. FEBS Lett. 2015;589(1):102–109. doi: 10.1016/j.febslet.2014.11.031IF: 3.0 Q2 .IF: 3.0 Q2 [DOI] [PubMed] [Google Scholar]
- 39.Shen ZT, Zhou R, Liu C, Wang YF, Zhan WQ, Shao ZY, Liu J, Zhang FF, Xu LJ, Zhou XY, Qi L, Bo F, Ding YQ, Zhao L. MicroRNA-105 is involved in TNF-α-related tumor microenvironment enhanced colorectal cancer progression. Cell Death Dis. 2017;8(12):3213. doi: 10.1038/s41419-017-0048-xIF: 9.6 Q1 .IF: 9.6 Q1 [DOI] [PMC free article] [PubMed] [Google Scholar]
- 40.Bu PC, Wang LH, Chen KY, Rakhilin N, Sun J, Closa A, Tung KL, King S, Kristine Varanko A, Xu YT, Huan Chen J, Zessin AS, Shealy J, Cummings B, Hsu D, Lipkin SM, Moreno V, Gümüş ZH, Shen XL. miR-1269 promotes metastasis and forms a positive feedback loop with TGF-Β. Nat Commun. 2015;6:6879. doi: 10.1038/ncomms7879IF: 15.7 Q1 .IF: 15.7 Q1 [DOI] [PMC free article] [PubMed] [Google Scholar]
- 41.Liang JQ, Li YR, Daniels G, Sfanos K, de Marzo A, Wei JJ, Li X, Chen WQ, Wang JH, Zhong XL, Melamed J, Zhao J, Lee P. LEF1 targeting EMT in prostate cancer invasion is regulated by miR-34a. Mol Cancer Res. 2015;13(4):681–688. doi: 10.1158/1541-7786.MCR-14-0503IF: 4.7 Q1 .IF: 4.7 Q1 [DOI] [PMC free article] [PubMed] [Google Scholar]
- 42.Liu TY, Chen J, Shang CL, Shen HW, Huang JM, Liang YC, Wang W, Zhao YH, Liu D, Shu M, Guo LY, Hu Z, Yao SZ. Tripartite motif containing 62 is a novel prognostic marker and suppresses tumor metastasis via c-Jun/Slug signaling-mediated epithelial-mesenchymal transition in cervical cancer. J Exp Clin Cancer Res. 2016;35(1):170. doi: 10.1186/s13046-016-0445-5IF: 12.8 Q1 .IF: 12.8 Q1 [DOI] [PMC free article] [PubMed] [Google Scholar]
- 43.Feliciano A, Garcia-Mayea Y, Jubierre L, Mir C, Hummel M, Castellvi J, Hernández-Losa J, Paciucci R, Sansano I, Sun YL, Ramón Y, Cajal S, Kondon H, Soriano A, Segura M, Lyakhovich A, LLeonart ME. miR-99a reveals two novel oncogenic proteins E2F2 and EMR2 and represses stemness in lung cancer. Cell Death Dis. 2017;8(10):e3141. doi: 10.1038/cddis.2017.544IF: 9.6 Q1 .IF: 9.6 Q1 [DOI] [PMC free article] [PubMed] [Google Scholar]
- 44.Singh M, Durairaj P, Yeung J. Uveal melanoma: a review of the literature. Oncol Ther. 2018;6(1):87–104. doi: 10.1007/s40487-018-0056-8IF: 3.2 Q2 .IF: 3.2 Q2 [DOI] [PMC free article] [PubMed] [Google Scholar]
- 45.Emmett MS, Lanati S, Dunn DB, Stone OA, Bates DO. CCR7 mediates directed growth of melanomas towards lymphatics. Microcirculation. 2011;18(3):172–182. doi: 10.1111/j.1549-8719.2010.00074.xIF: 2.0 Q3 .IF: 2.0 Q3 [DOI] [PMC free article] [PubMed] [Google Scholar]
- 46.Zhuo W, Jia L, Song N, Lu XN, Ding YP, Wang XF, Song XM, Fu Y, Luo YZ. The CXCL12-CXCR4 chemokine pathway: a novel axis regulates lymphangiogenesis. Clin Cancer Res. 2012;18(19):5387–5398. doi: 10.1158/1078-0432.CCR-12-0708IF: 10.2 Q1 .IF: 10.2 Q1 [DOI] [PubMed] [Google Scholar]
- 47.Garmy-Susini B, Avraamides CJ, Desgrosellier JS, Schmid MC, Foubert P, Ellies LG, Lowy AM, Blair SL, Vandenberg SR, Datnow B, Wang HY, Cheresh DA, Varner J. PI3Kα activates integrin α4β1 to establish a metastatic niche in lymph nodes. Proc Natl Acad Sci U S A. 2013;110(22):9042–9047. doi: 10.1073/pnas.1219603110IF: 9.1 Q1 .IF: 9.1 Q1 [DOI] [PMC free article] [PubMed] [Google Scholar]
- 48.Chen J, Alexander JS, Orr AW. Integrins and their extracellular matrix ligands in lymphangiogenesis and lymph node metastasis. Int J Cell Biol. 2012;2012:853703. doi: 10.1155/2012/853703. [DOI] [PMC free article] [PubMed] [Google Scholar]
- 49.Gu Y, Qi XL, Guo SY. Lymphangiogenesis induced by VEGF-C and VEGF-D promotes metastasis and a poor outcome in breast carcinoma: a retrospective study of 61 cases. Clin Exp Metastasis. 2008;25(7):717–725. doi: 10.1007/s10585-008-9180-4IF: 3.2 Q2 .IF: 3.2 Q2 [DOI] [PubMed] [Google Scholar]
- 50.Björndahl MA, Cao RH, Burton JB, Brakenhielm E, Religa P, Galter D, Wu L, Cao YH. Vascular endothelial growth factor-a promotes peritumoral lymphangiogenesis and lymphatic metastasis. Cancer Res. 2005;65(20):9261–9268. doi: 10.1158/0008-5472.CAN-04-2345IF: 16.6 Q1 .IF: 16.6 Q1 [DOI] [PubMed] [Google Scholar]
- 51.Gardner FP, Serie DJ, Salomao DR, Wu KJ, Markovic SN, Pulido JS, Joseph RW. C-MET expression in primary and liver metastases in uveal melanoma. Melanoma Res. 2014;24(6):617–620. doi: 10.1097/CMR.0000000000000118IF: 1.9 Q3 .IF: 1.9 Q3 [DOI] [PubMed] [Google Scholar]
- 52.Bakalian S, Marshall JC, Logan P, Faingold D, Maloney S, di Cesare S, Martins C, Fernandes BF, Burnier MN., Jr Molecular pathways mediating liver metastasis in patients with uveal melanoma. Clin Cancer Res. 2008;14(4):951–956. doi: 10.1158/1078-0432.CCR-06-2630IF: 10.2 Q1 .IF: 10.2 Q1 [DOI] [PubMed] [Google Scholar]
- 53.Krüger A, Soeltl R, Sopov I, Kopitz C, Arlt M, Magdolen V, Harbeck N, Gänsbacher B, Schmitt M. Hydroxamate-type matrix metalloproteinase inhibitor batimastat promotes liver metastasis. Cancer Res. 2001;61(4):1272–1275. [PubMed] [Google Scholar]
- 54.Laurent C, Valet F, Planque N, Silveri L, Maacha S, Anezo O, Hupe P, Plancher C, Reyes C, Albaud B, Rapinat A, Gentien D, Couturier J, Sastre-Garau X, Desjardins L, Thiery JP, Roman-Roman S, Asselain B, Barillot E, Piperno-Neumann S, Saule S. High PTP4A3 phosphatase expression correlates with metastatic risk in uveal melanoma patients. Cancer Res. 2011;71(3):666–674. doi: 10.1158/0008-5472.CAN-10-0605IF: 16.6 Q1 .IF: 16.6 Q1 [DOI] [PubMed] [Google Scholar]