


100+ Charts & Commentary on all major Markets — for your weekend reading.
“Don’t start the week without it”
KEY TOPICS COVERED
In today’s report:
STOCKS: There’s A Time For Everything — Then It’s Gone.
POPCORN MARKET — *watch the oven*.
Topping Signals (continued).
Updated scans & targets.
FX: BATTLE PLAN for the Dollar (continued).
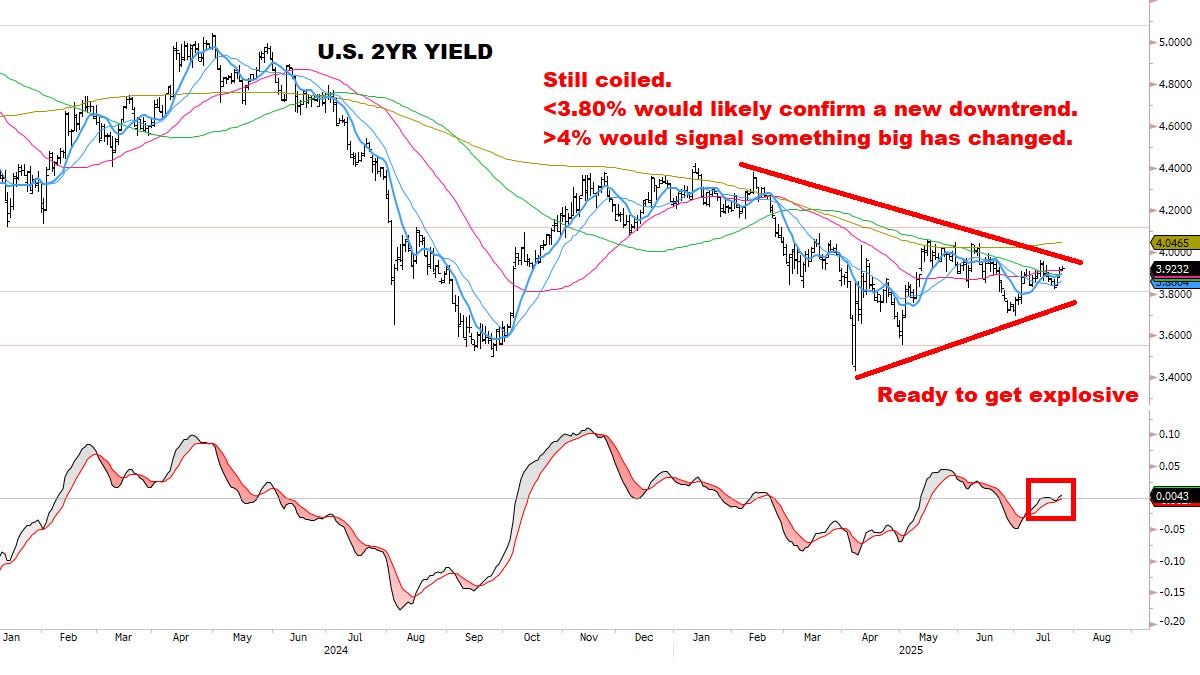
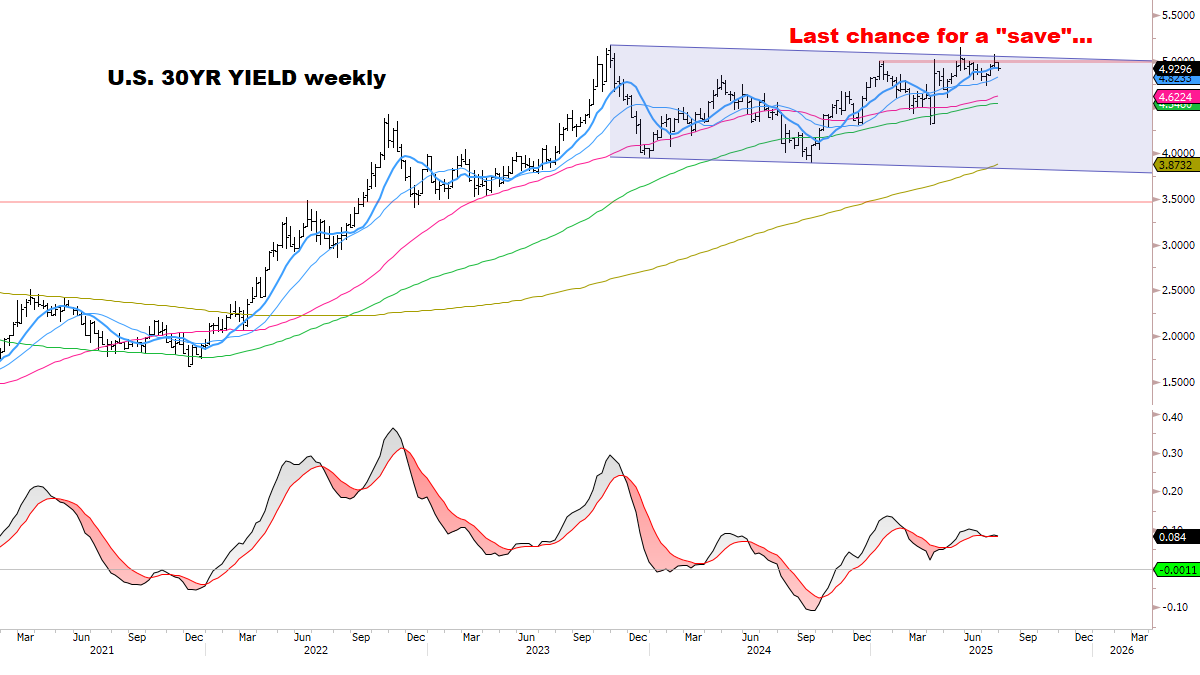
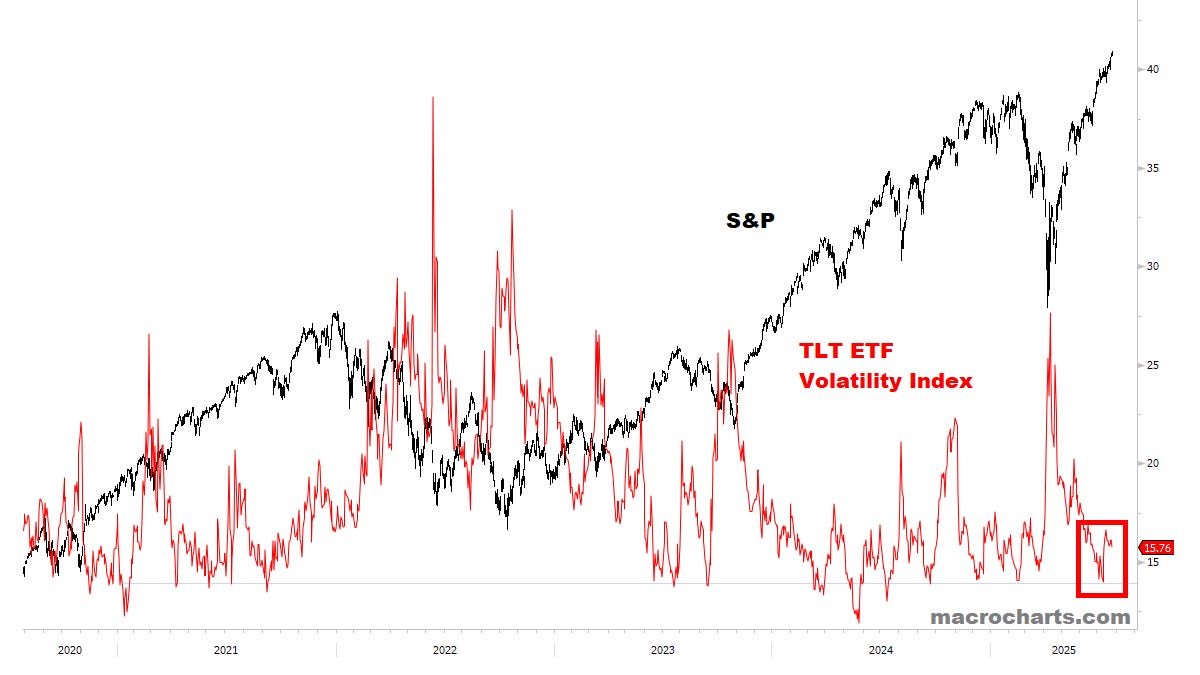
BONDS: Not the Rates you’re looking for…
METALS: Exhaustion.
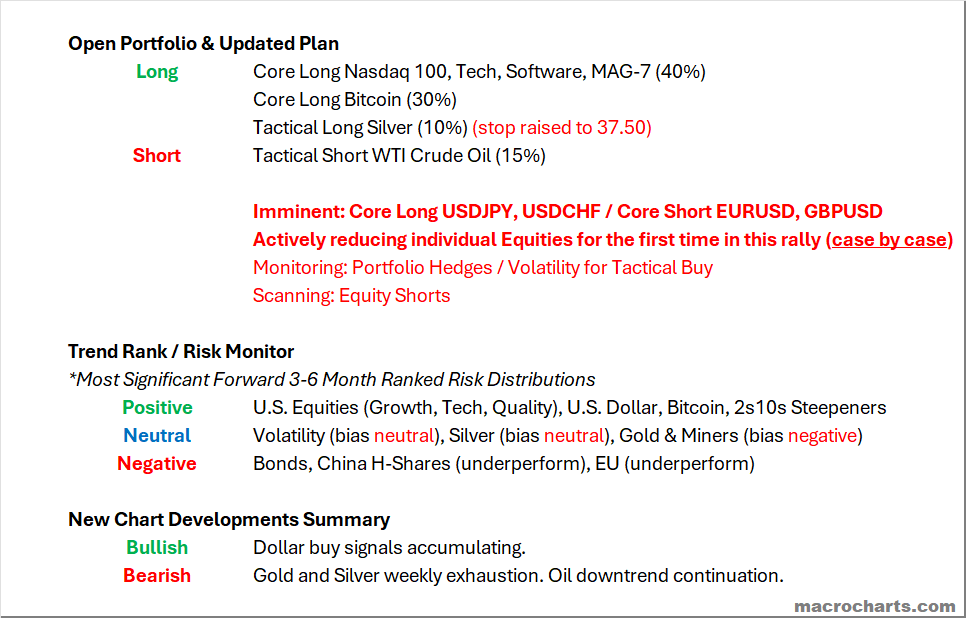
Open Portfolio & Updated Plan
Monitoring for the next big play.
A potential big inflection point brewing:
Dollar buy signals *accumulating*.
Gold and Silver with potential *weekly exhaustion* patterns — watch next week for critical confirmation.
Are Precious Metals signaling the Dollar is “ready to go”?
Next week will be filled with market-moving data: Fed meeting, GDP, PCE, NFP, and ISM — to name a few.
What’s the path of maximum pain for Rates & the Dollar?
CORE MODELS & DATA
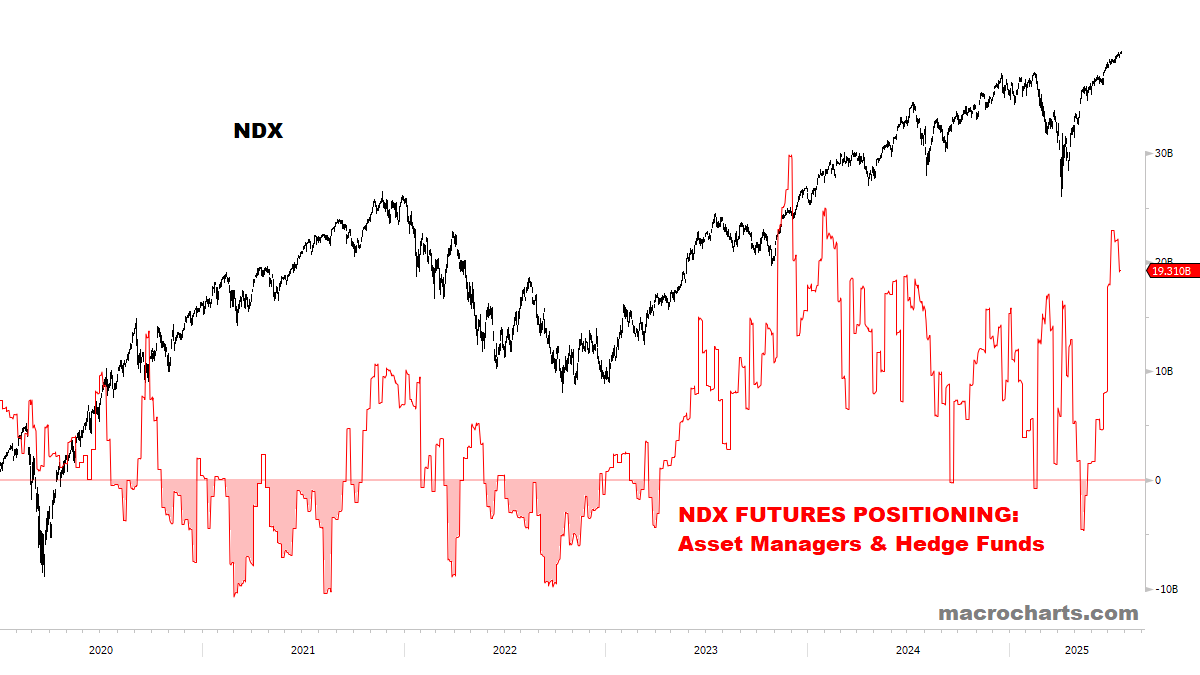
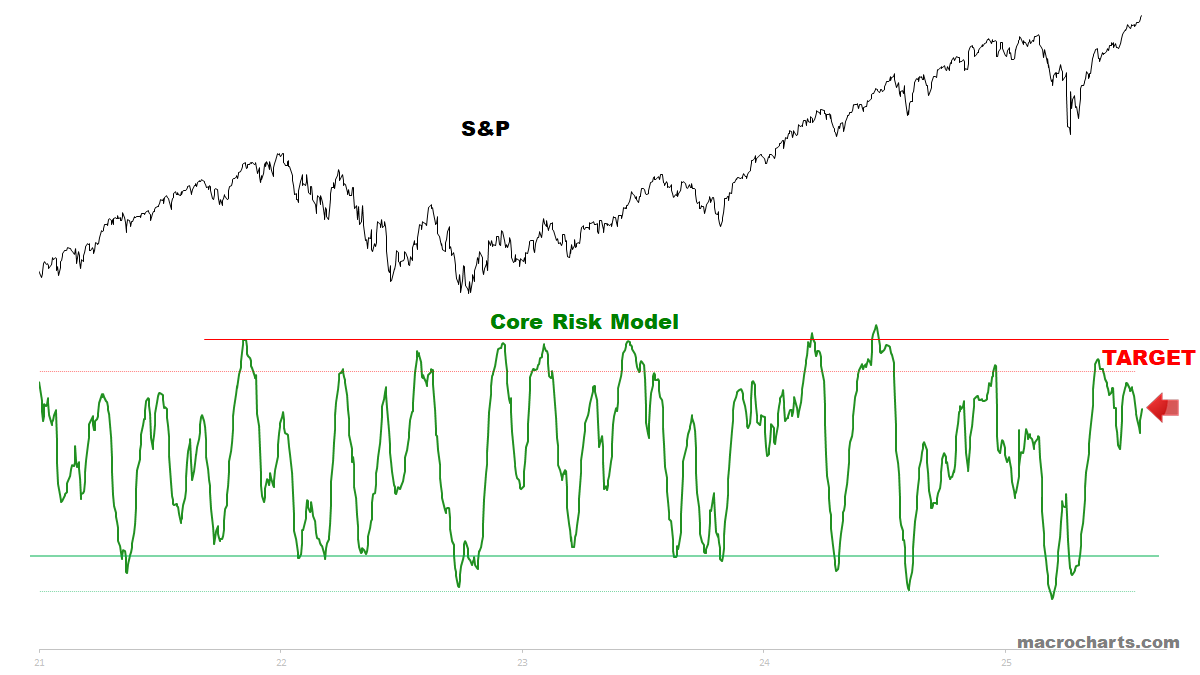
STOCKS
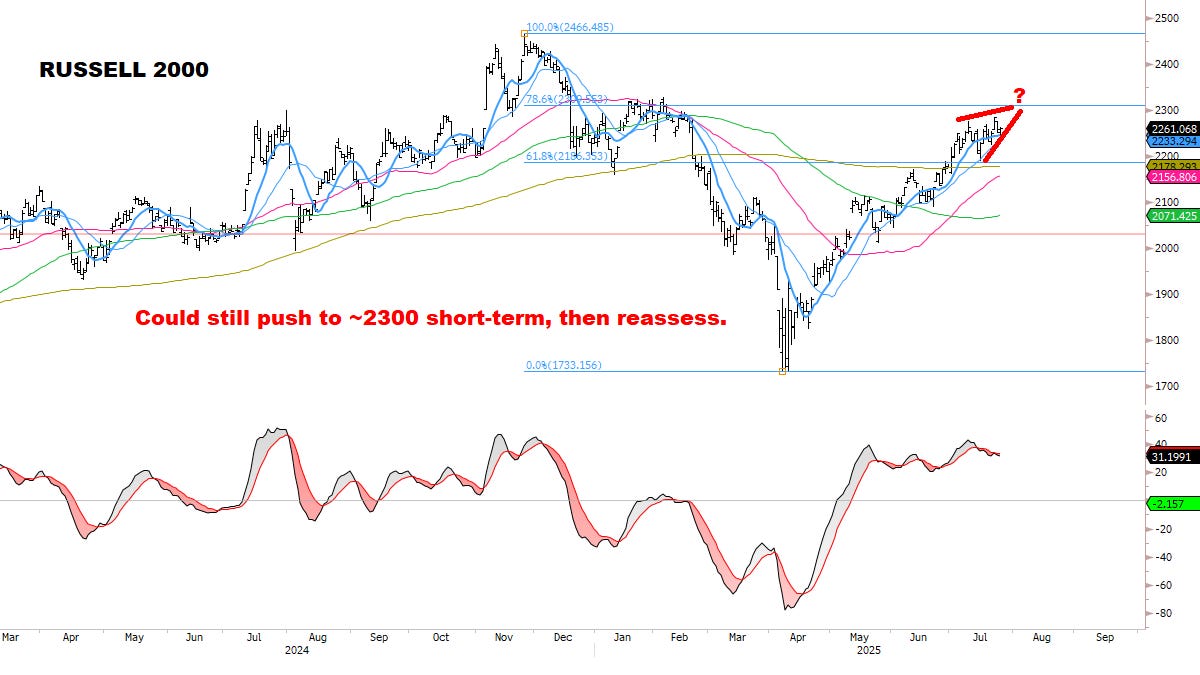
Investor flows in target range for a tactical Top.
We’ve been tracking this sequence for months — the historical pattern is now complete.
These are exact levels where the market topped in JULY 2023 & 2024. Any higher than this is just “gravy”…
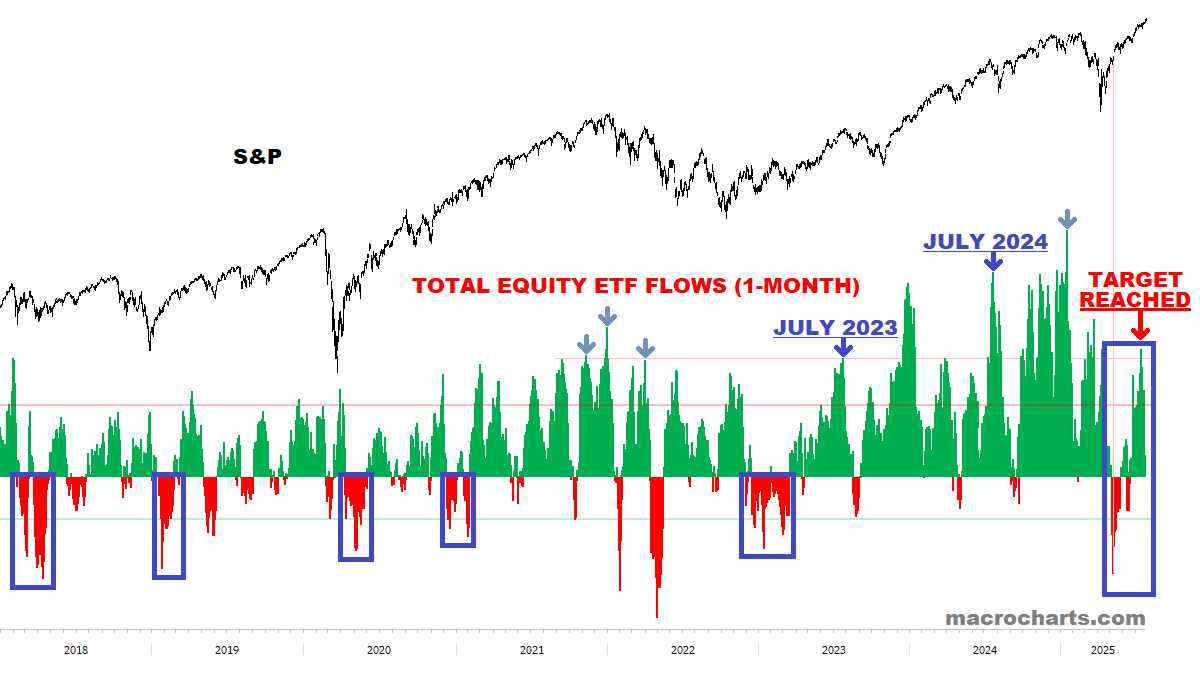
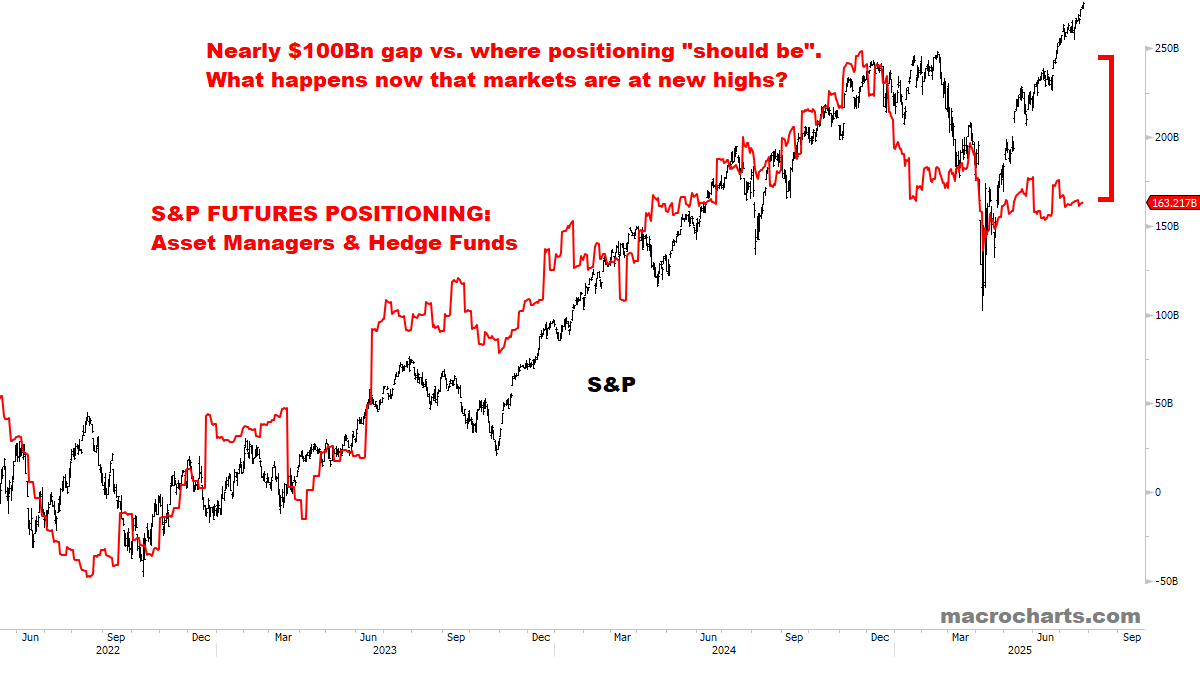
Institutions still have room to catch up:
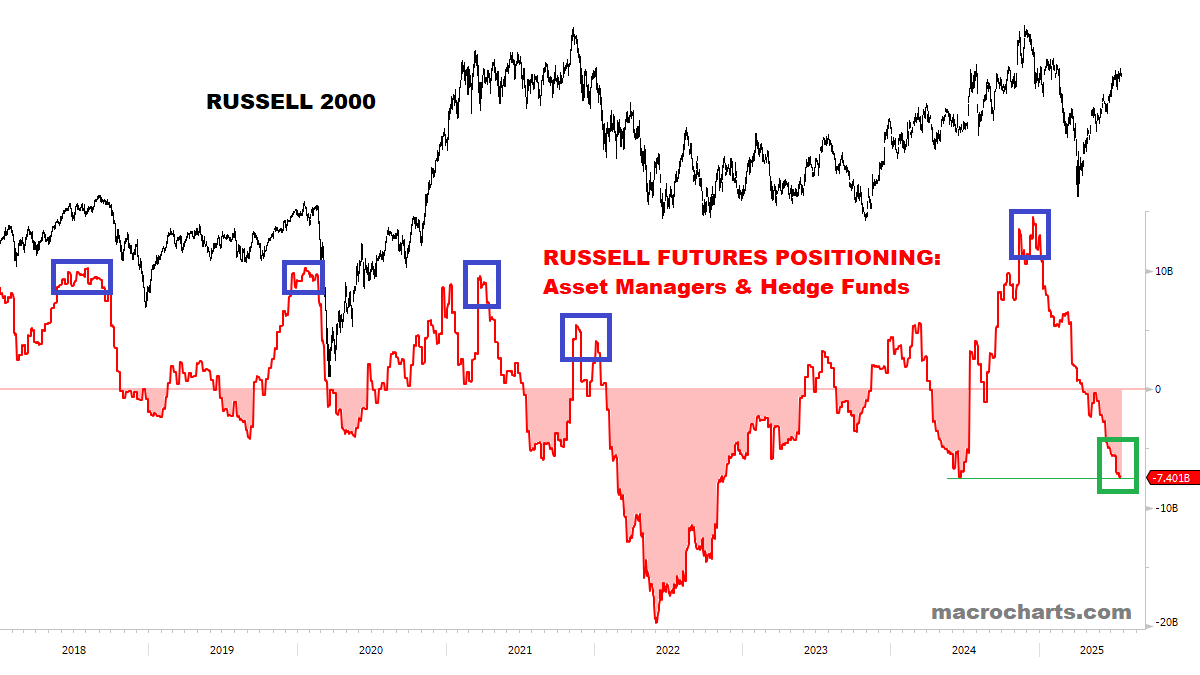
Topping Signals (continued):
Core Risk Models are starting to move higher — *don’t underestimate how quickly this could get overbought. We’ll update as this develops:
When this reaches topping range and turns down, I’ll raise cash / look to put on hedges. We’ll be sharing this and other signals with Subscribers only. No public sites or social media.
We continue to track this closely for a top into late summer — *now entering the time window:
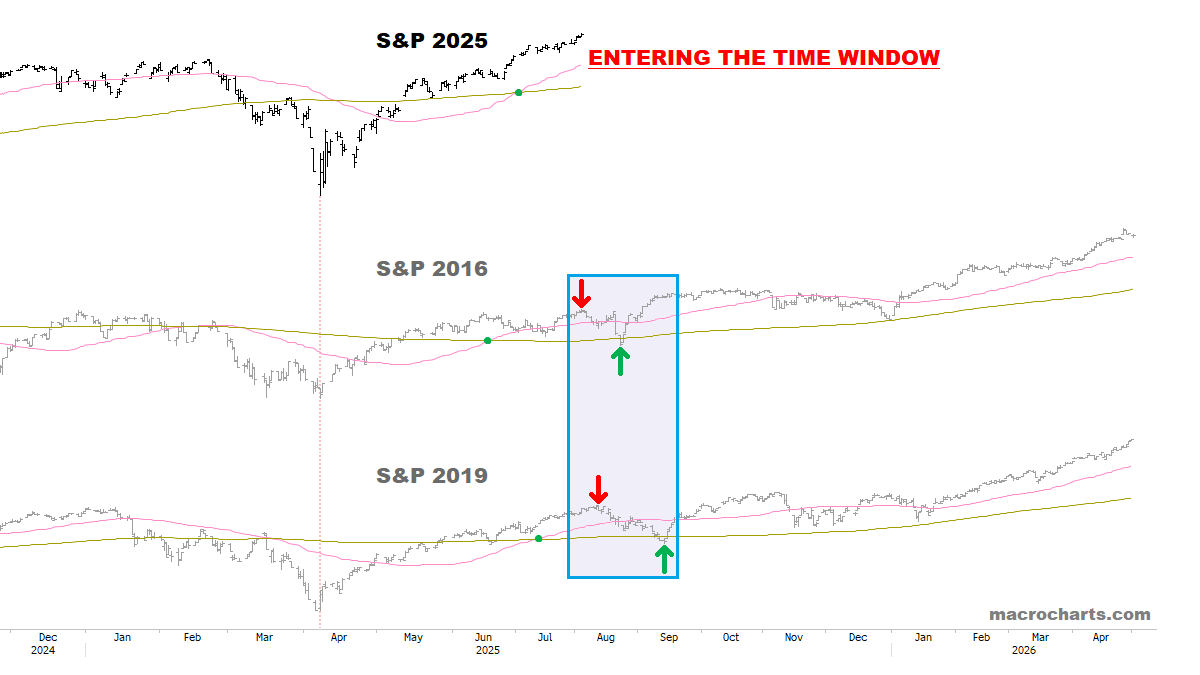
As discussed May 24:
“If the sequence continues, dips should remain shallow for the next few weeks, with the market in a slight upward bias. Overall, a *perfect environment* for stock-picking. *Also: not yet an optimal setup to Short Indexes or buy Volatility.”
*This framework continues to be validated by the market.
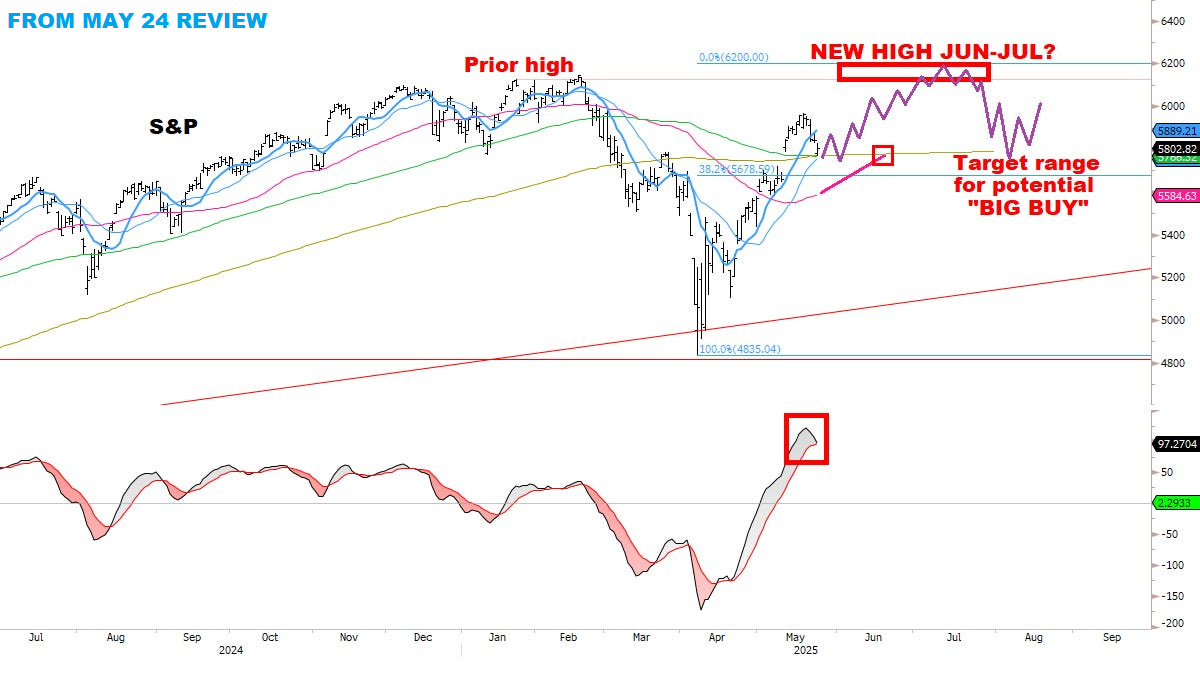
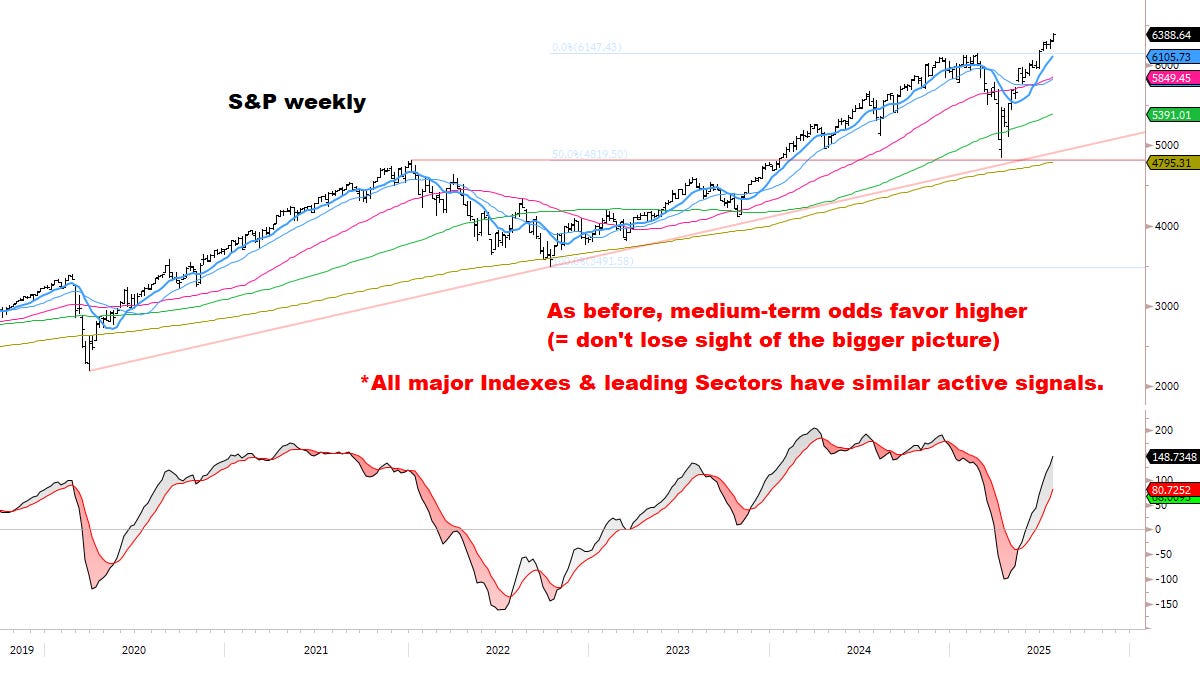
From JULY 16 Report:
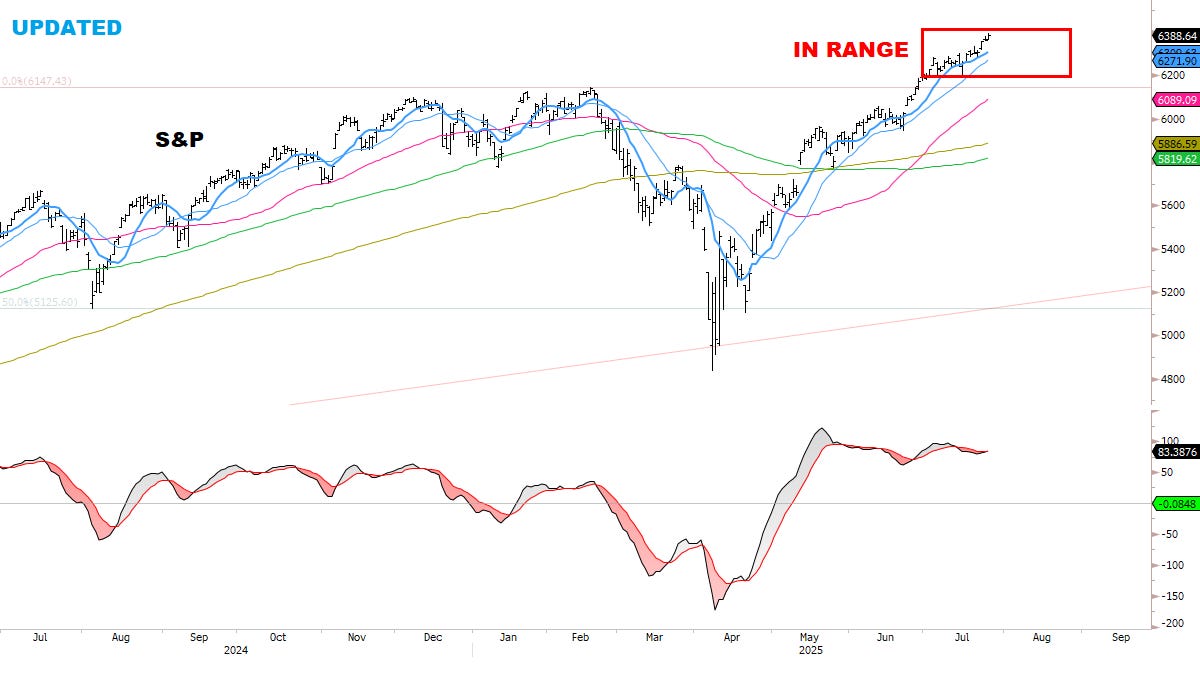
Best estimate (*subject to change*): S&P may be 2-3 weeks from an intermediate top, potentially in the 6300-6400 range. (UPDATE: Market is now in ideal PRICE range, but could still have 1-2 weeks of TIME according to historical patterns and Core Model development. Watching closely, DAY BY DAY now.)
If a top is made, history suggests a 10-15% correction in core Indexes could be seen in Q3. NOT a forecast, but a historical pattern (as discussed throughout this rally).
We’ll be updating conditions in real-time — as the next weeks will be critical.
If more key stocks peel off the rally, we may raise more cash, and/or fully hedge the book (“cost of doing business”).
Will update our hedging plan with priority as we go.
For now, gradually raising cash from high-beta names which are rolling over / triggering trailing stops / extended. Case-by-case, and making incremental decisions — always.
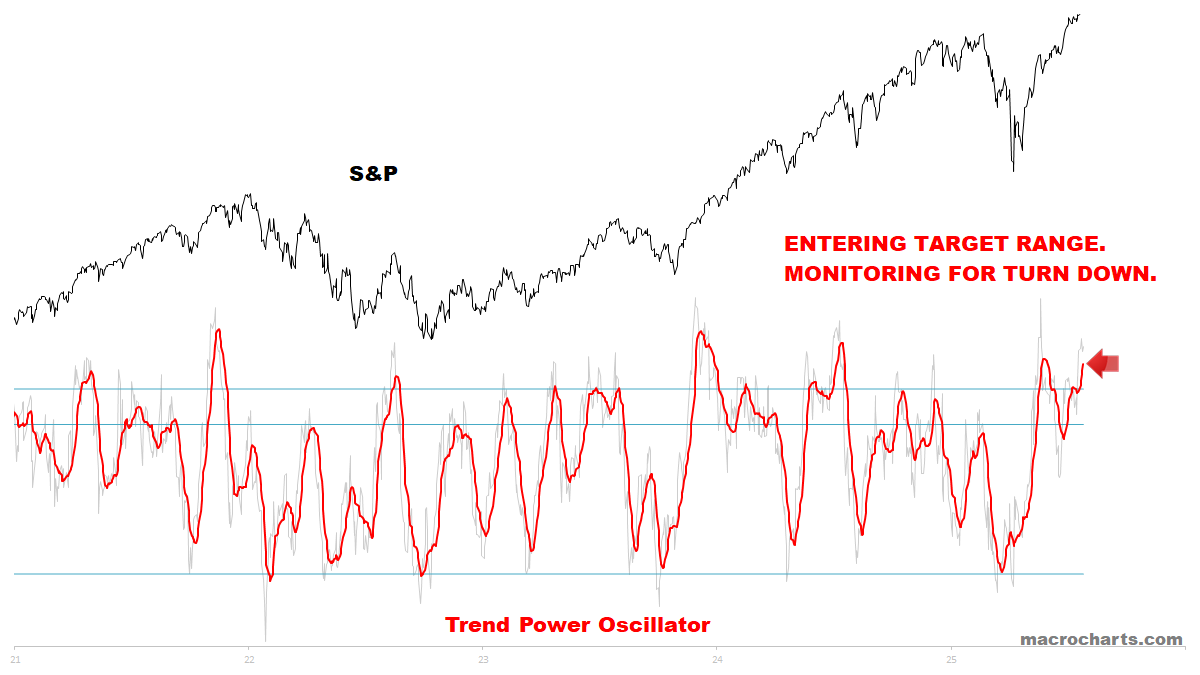
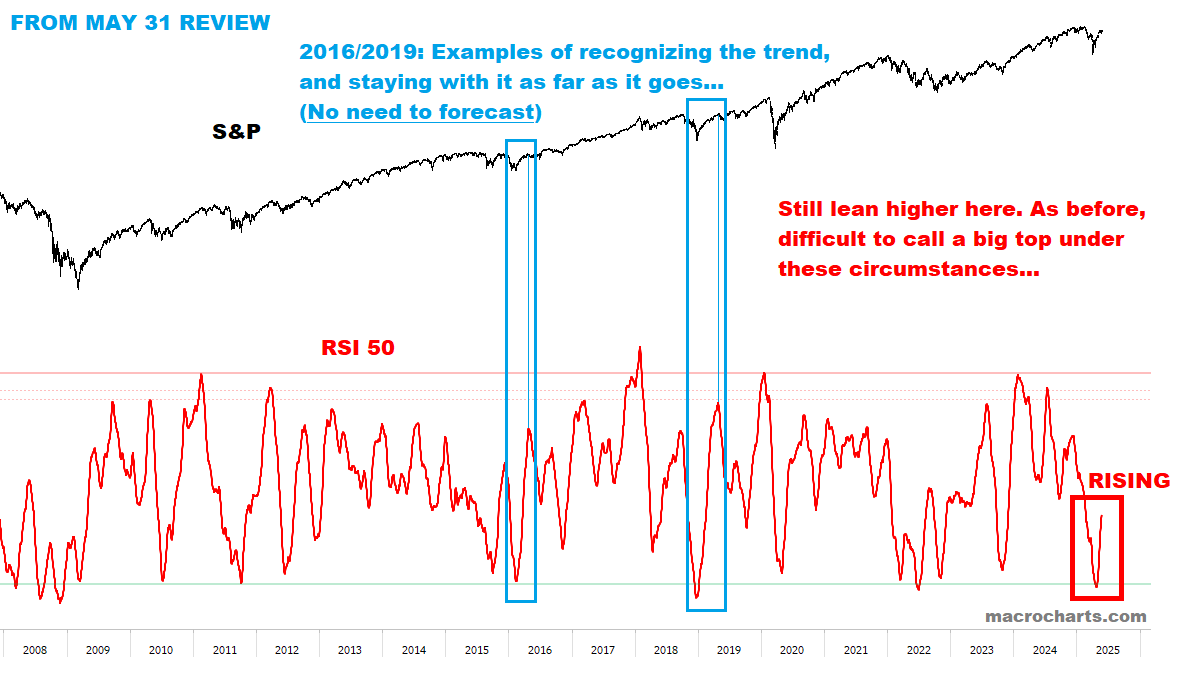
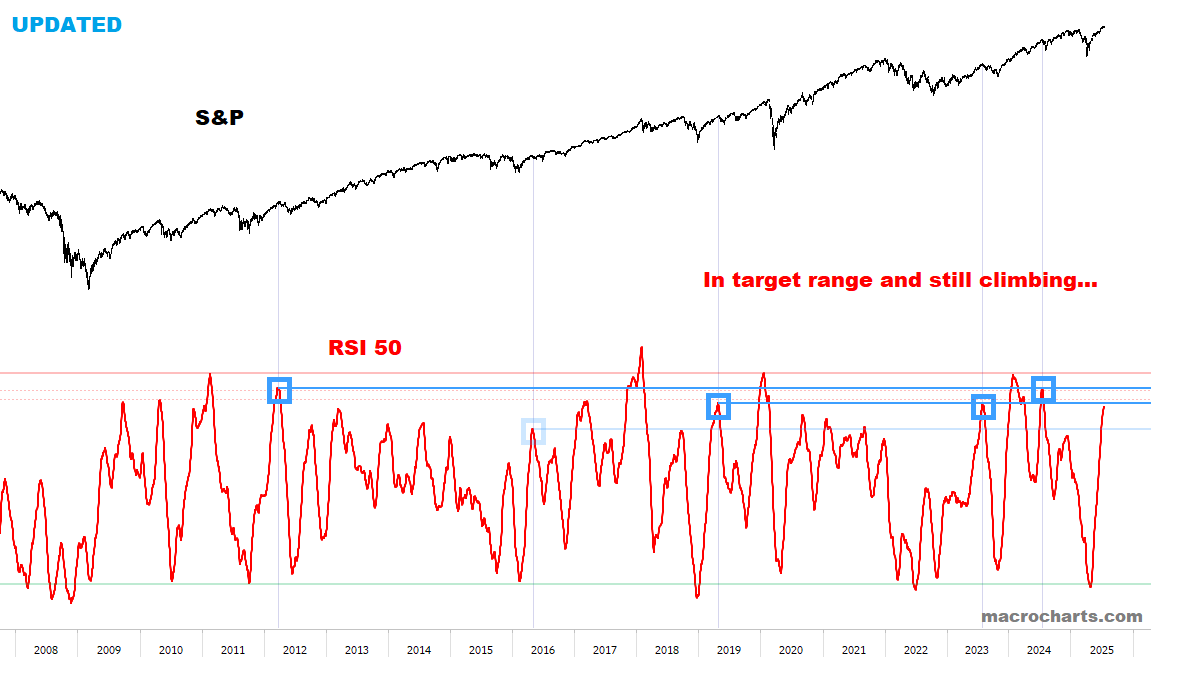
Trend Power Oscillator has entered the target range for a Top — still tracking the 2016/2019 scenario:
When this turns down, I’ll raise cash / look to put on Tactical hedges. Will update.
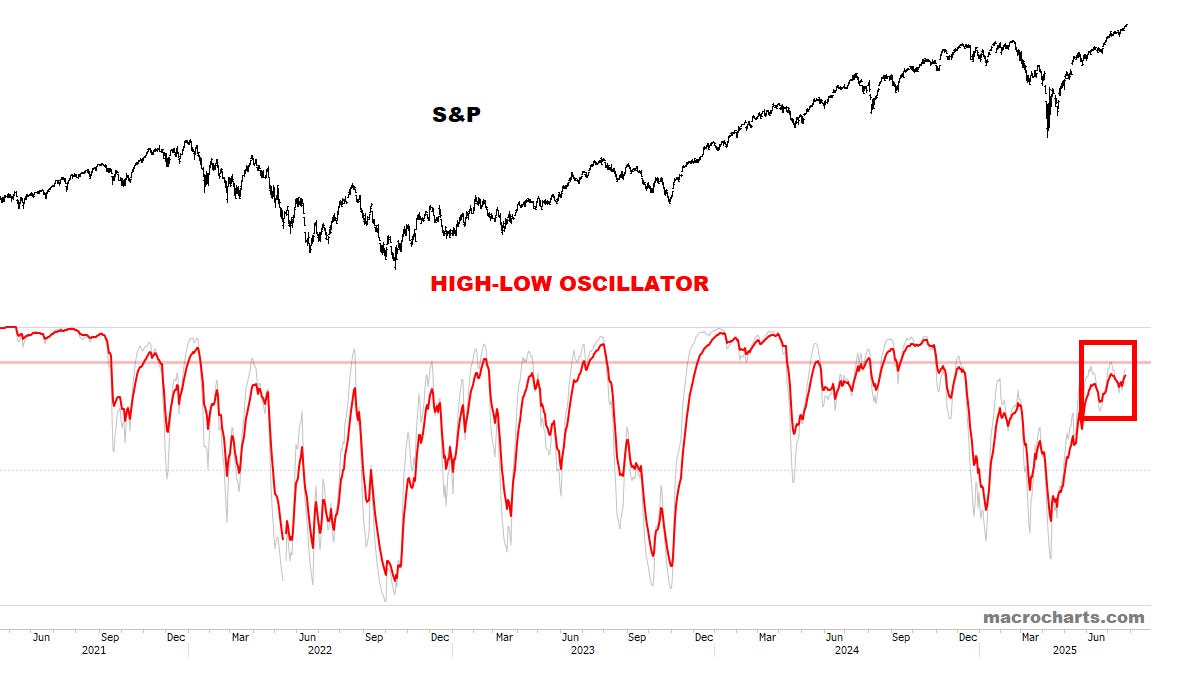
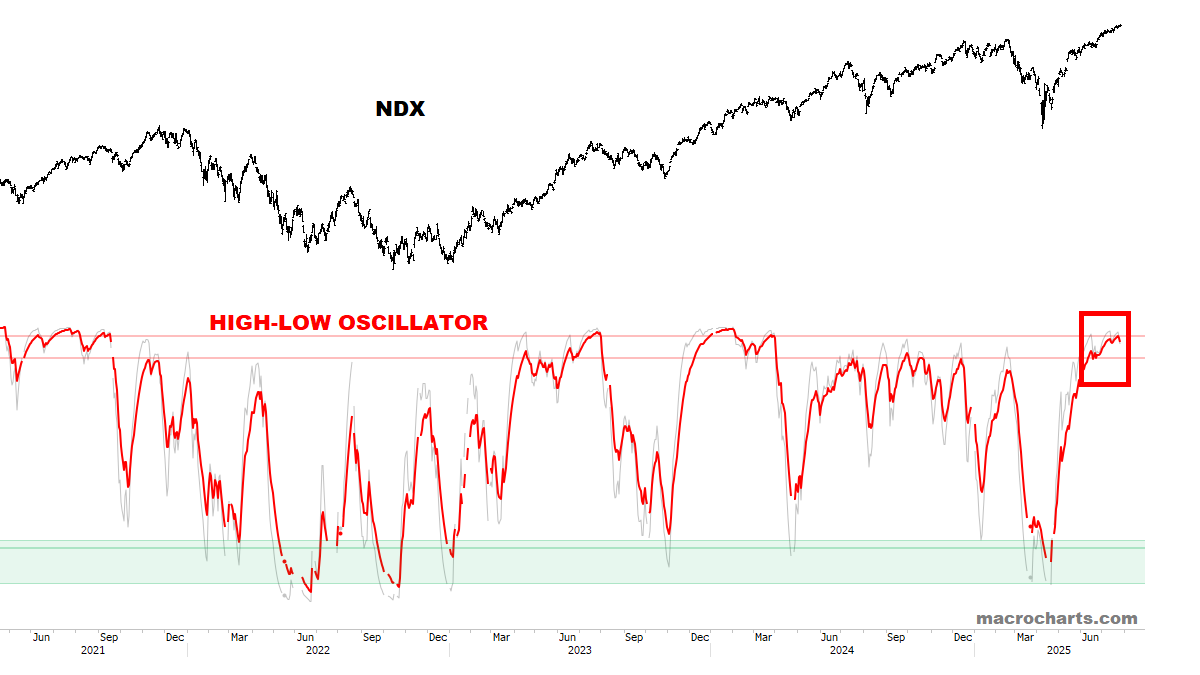
S&P High-Low Oscillator has room to push a tick higher — while NDX is quietly peeling off from overbought (subtle, but important):
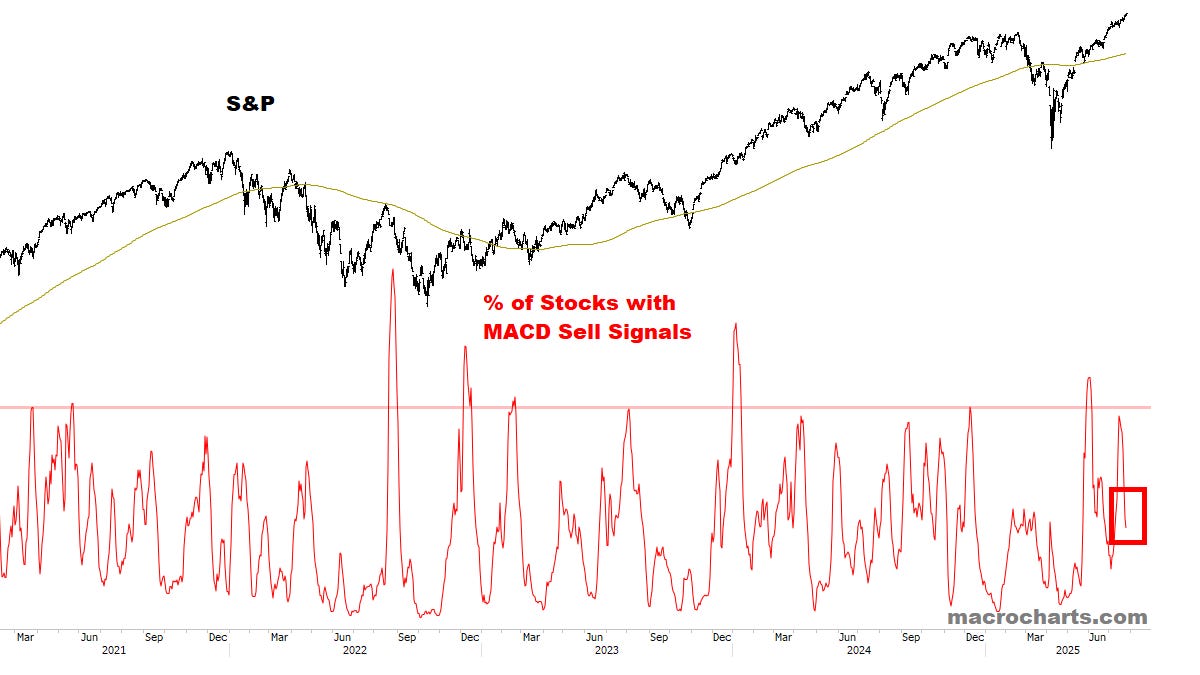
Sell Signals have subsided for now — no “smoking gun” here yet:
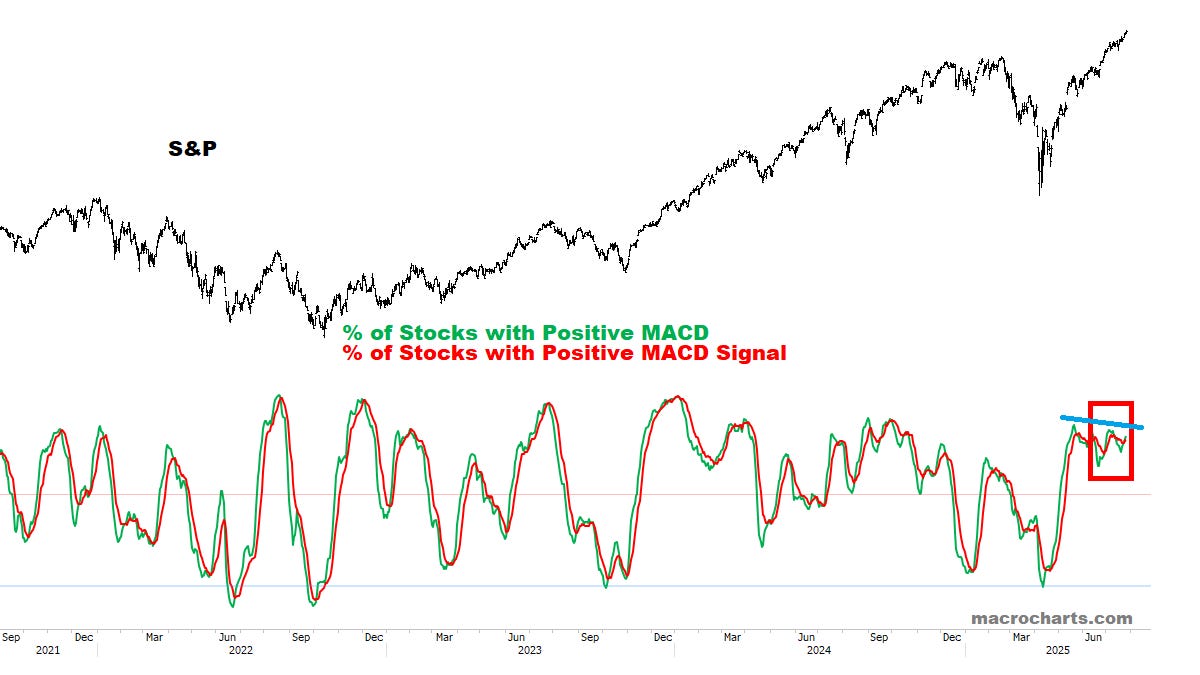
MACD Profiles are still drifting along — but the impulse is long gone:

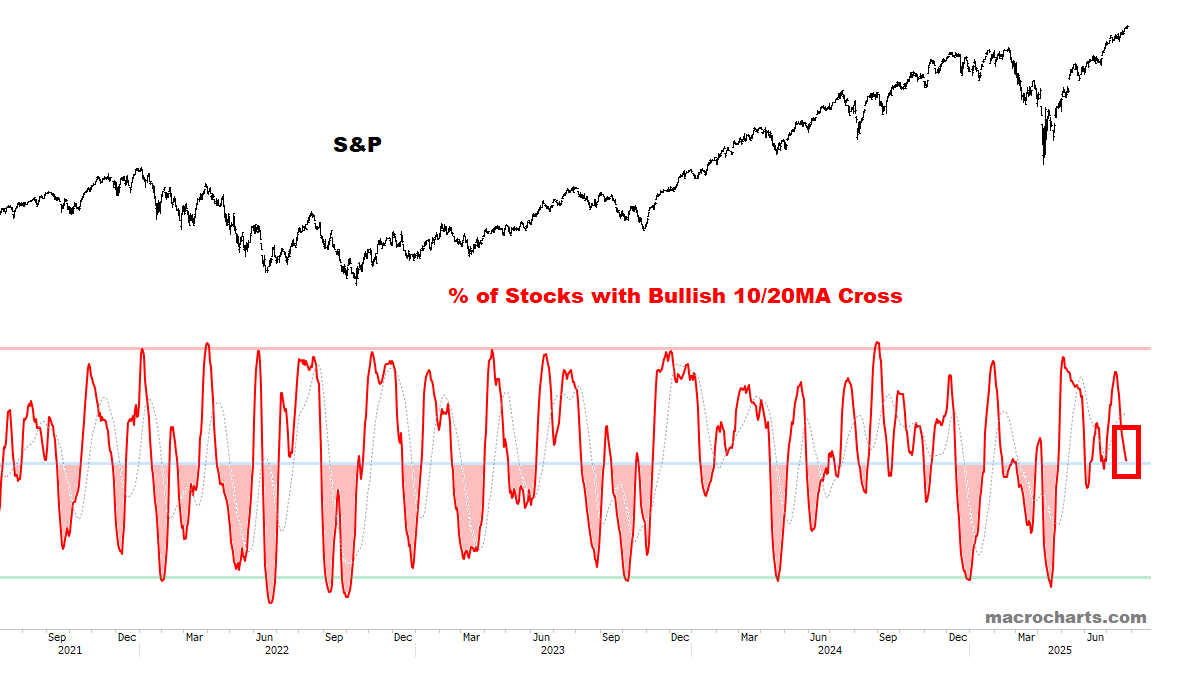
Stocks with a Bullish Cross continue deteriorating — an important warning sign:
Intermediate Breadth has likely peaked and displays a classic bearish divergence for the first time in this rally:
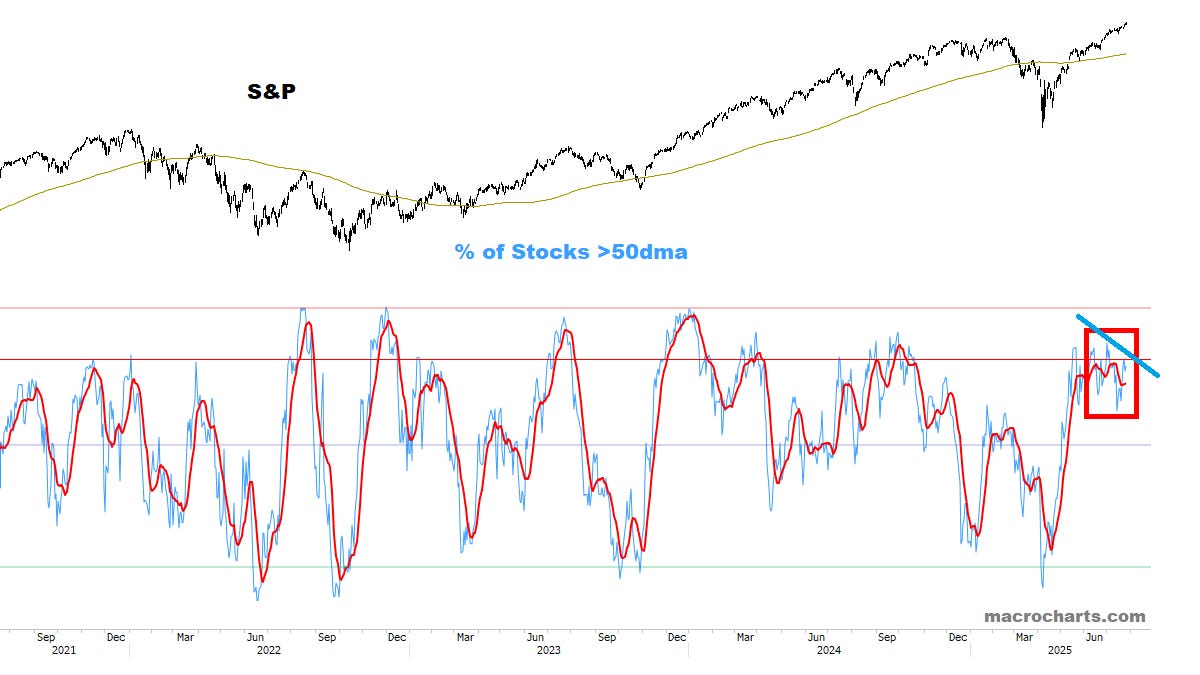
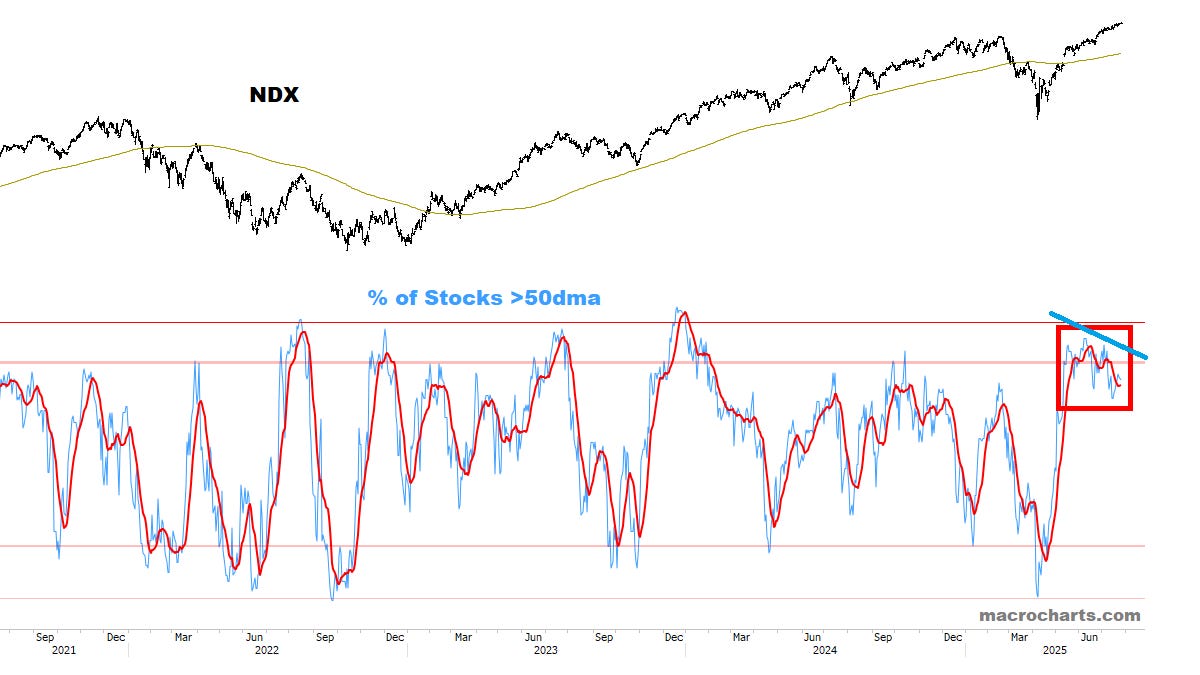
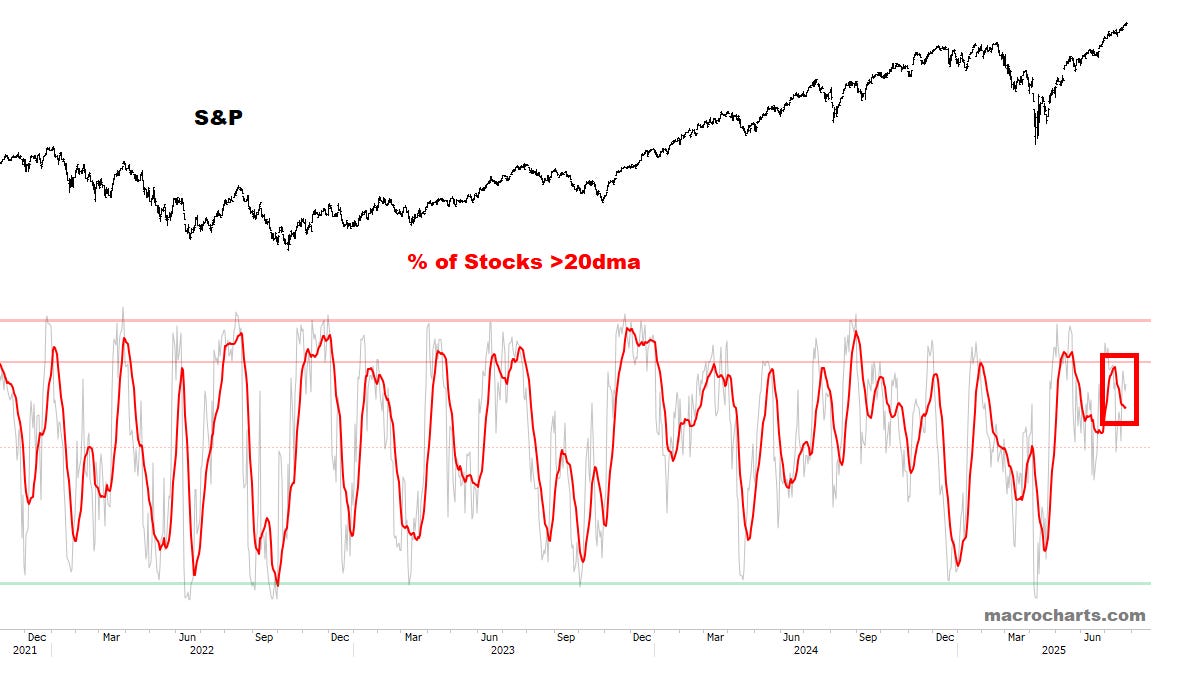
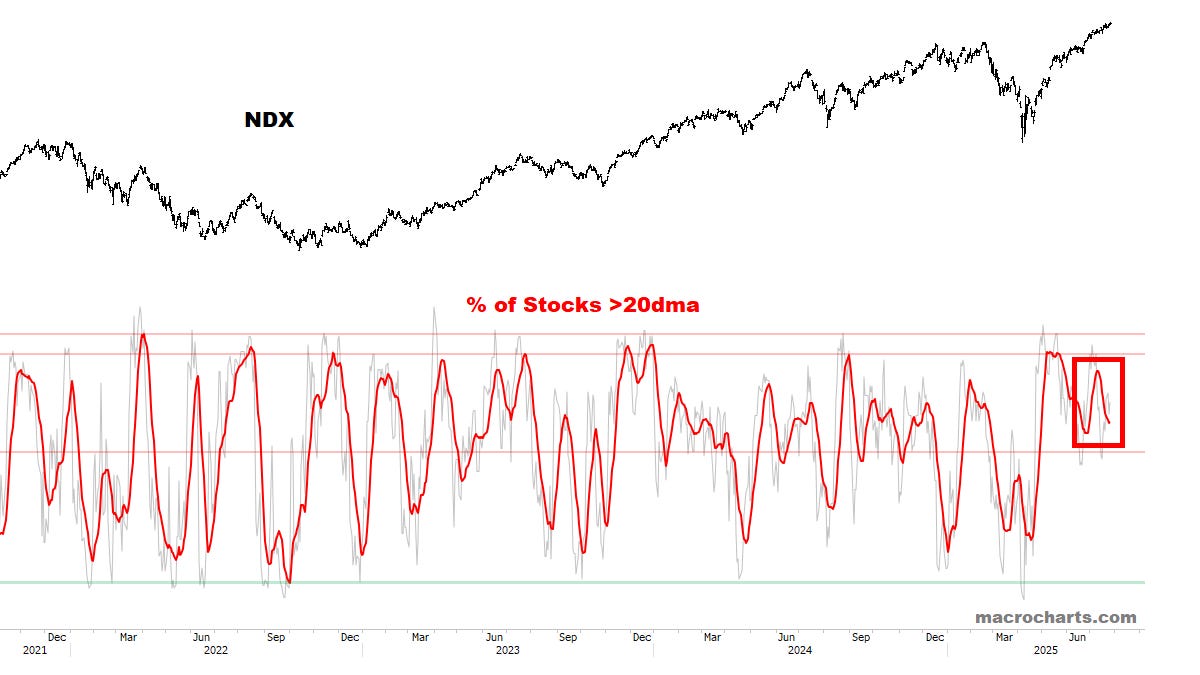
Short-Term Breadth continues to peel off:
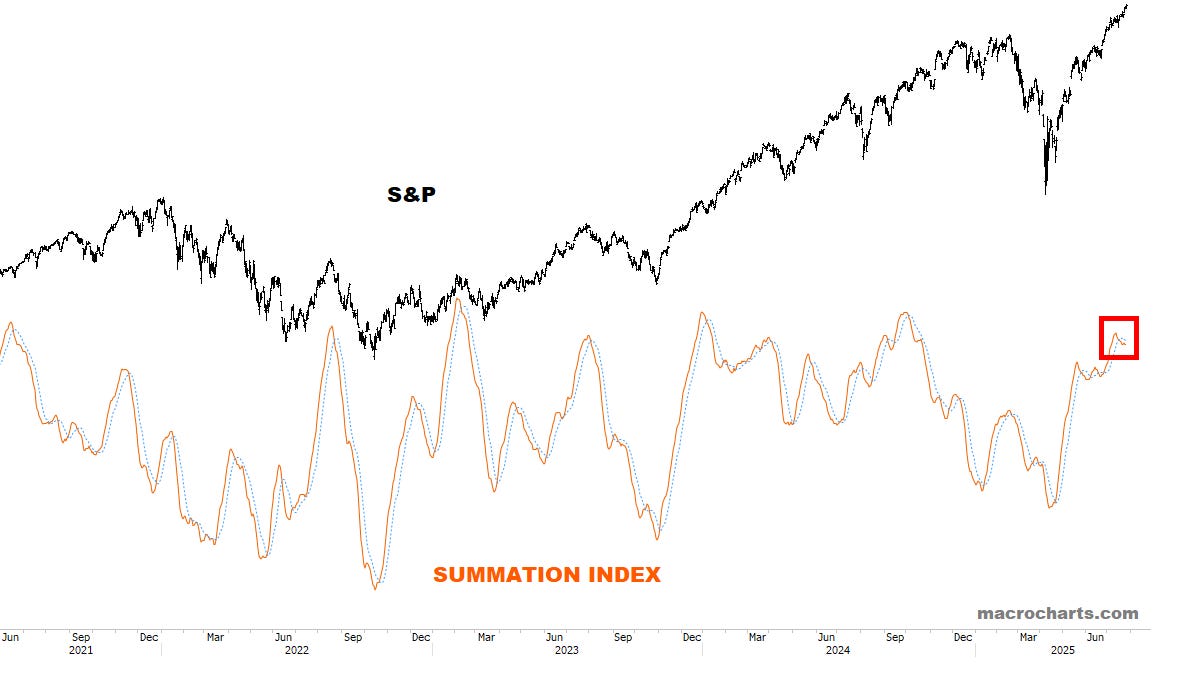
Summation Index remains on a Tactical Sell:
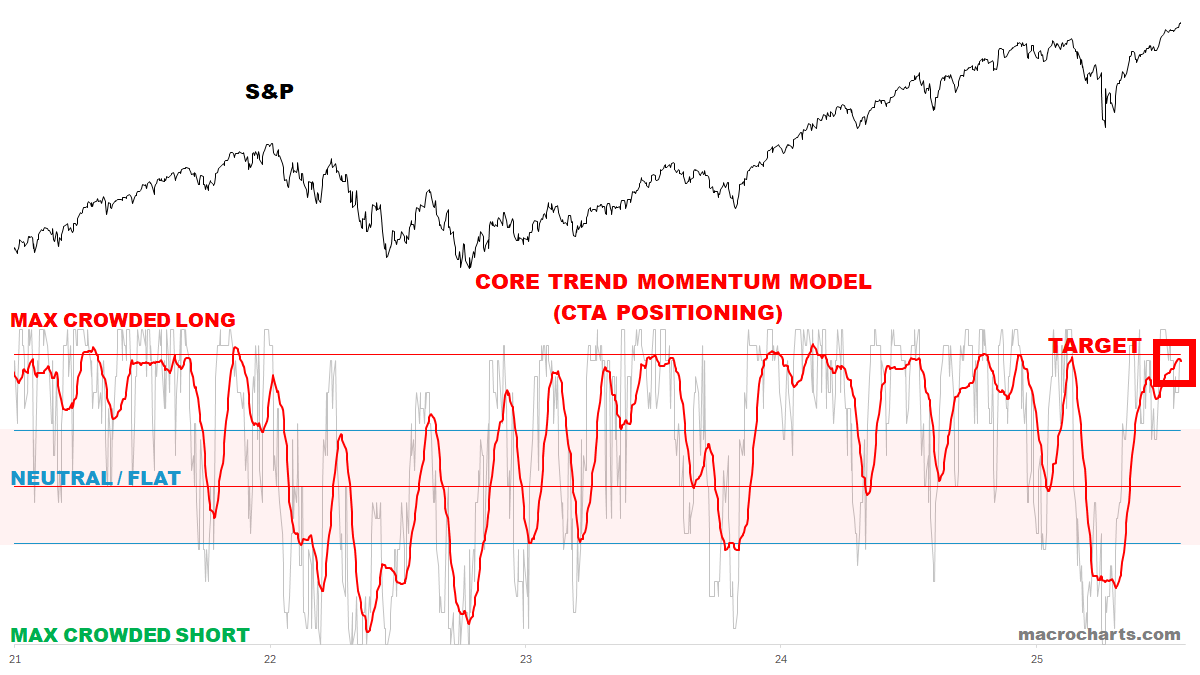
CTA Equity Trend positioning is finally in topping range:
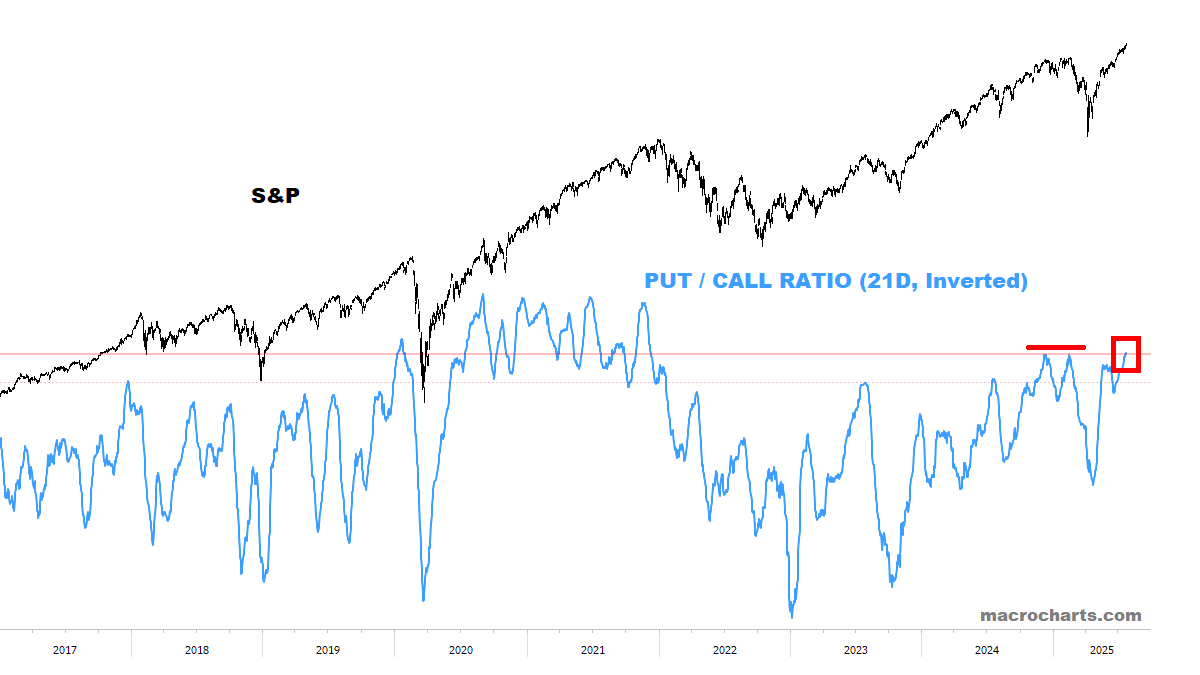
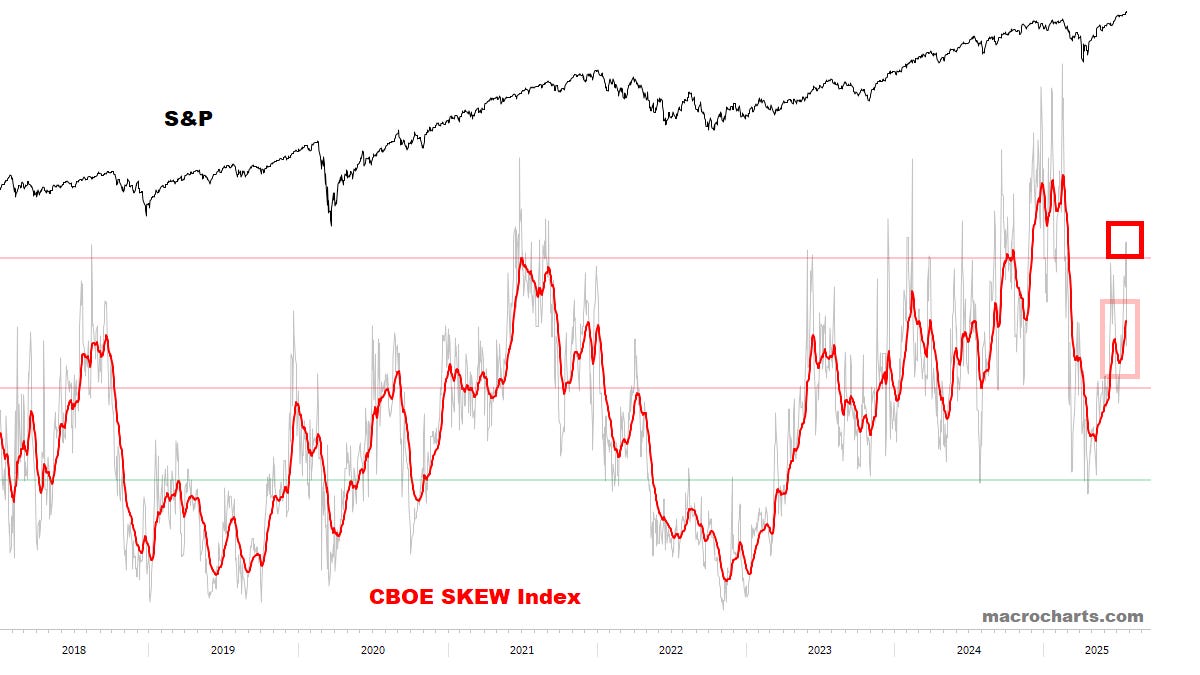
Put/Call Ratios are at the same levels as the February top — *monitoring for a turn DOWN (any extension may not be sustainable):
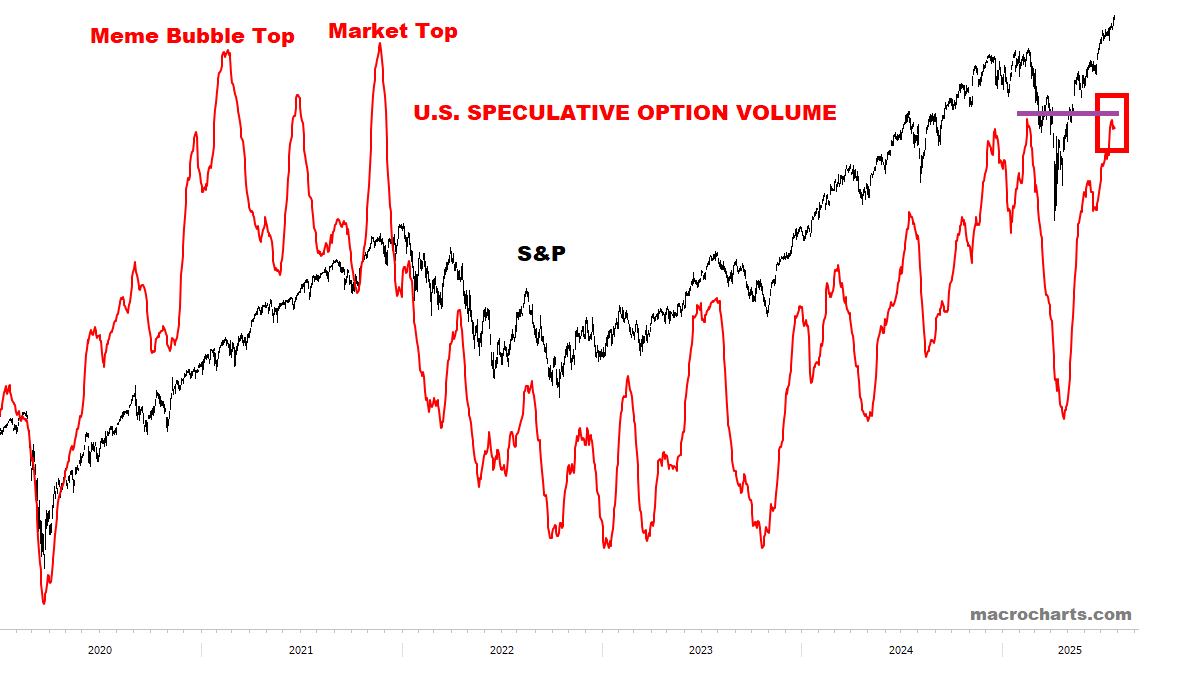
Option Volumes are at February topping levels and ticking DOWN:
Option Skews are starting to spike — another warning signal:
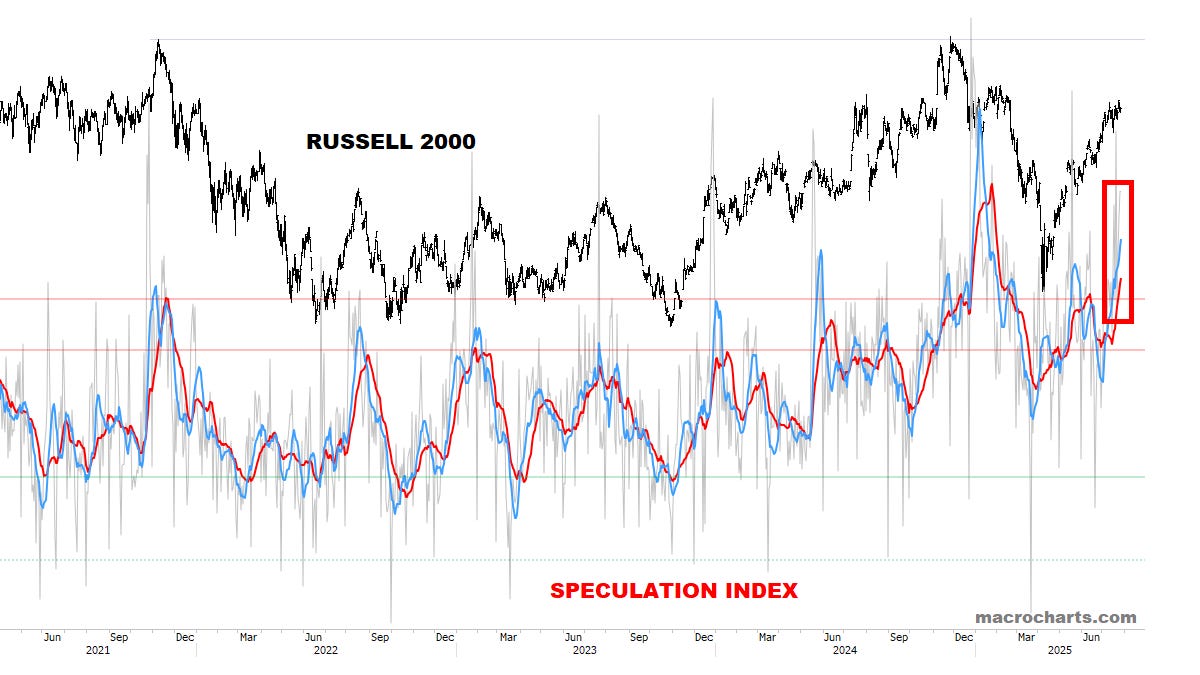
Speculation Index is a major concern now:
*Reiterate: consider avoiding exposure to low-quality / speculative stocks. This likely signals a peak in “Animal Spirits” approaching — as discussed recently.
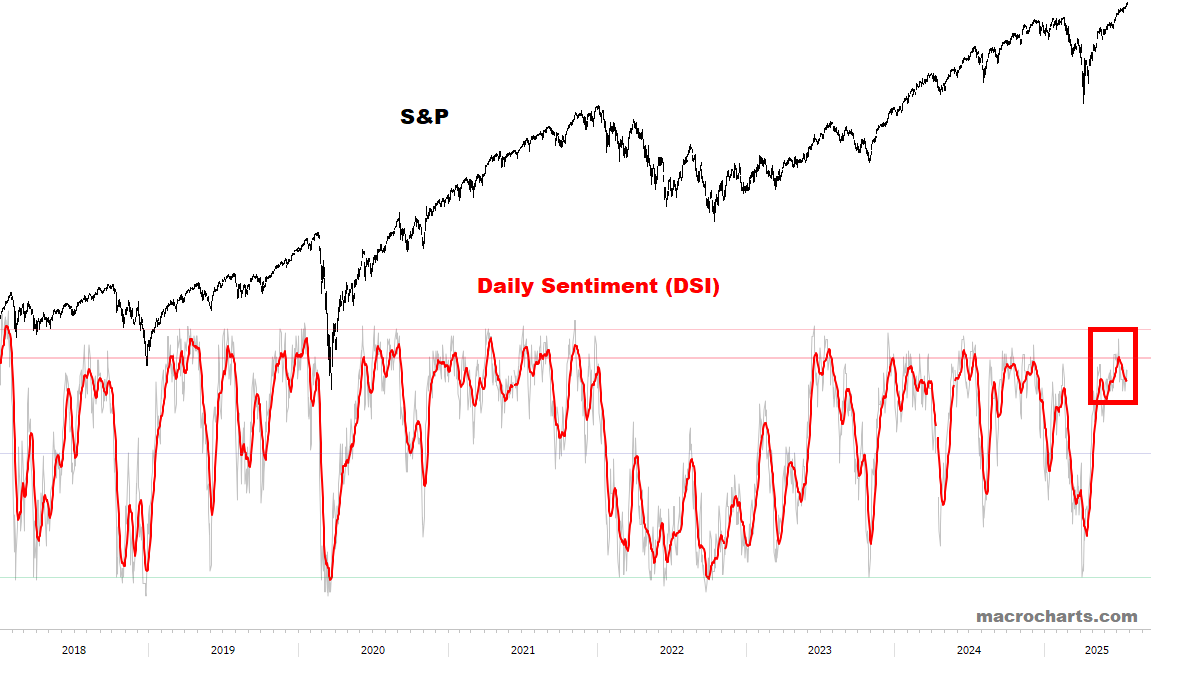
S&P Sentiment is turning down from topping range — but maybe NDX could still make a final pop? (See July 2023 / July 2024 below):

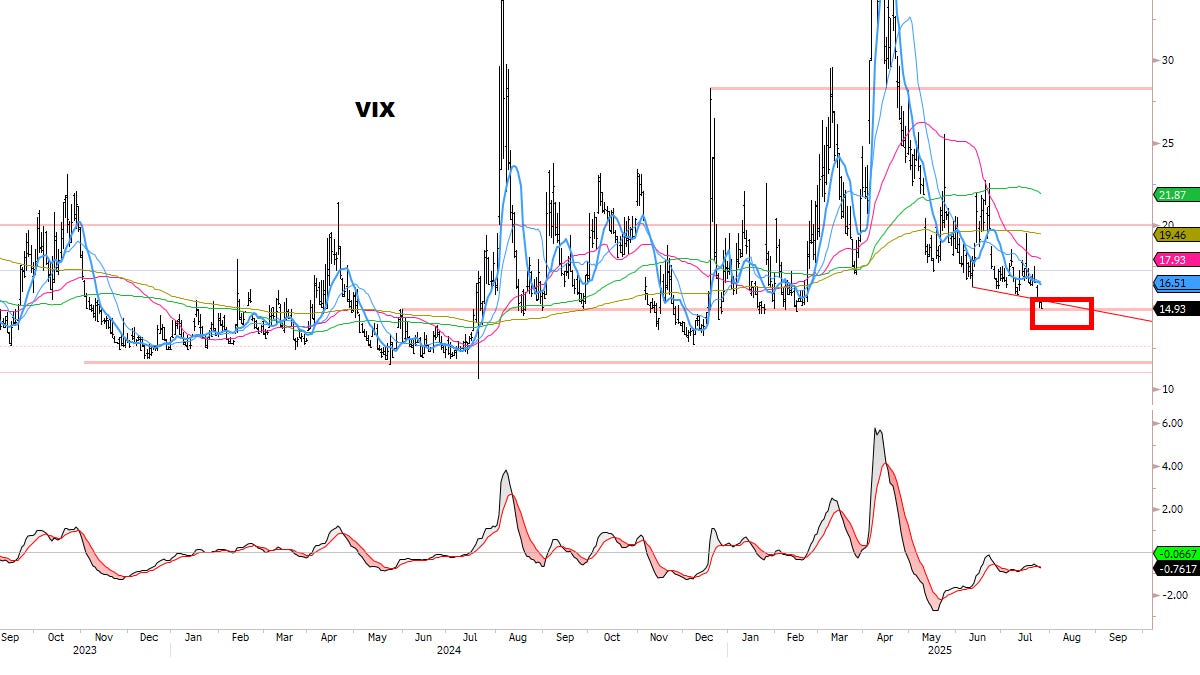
VIX Sentiment is finally moving down to our ideal targets — *and has move to drop a bit more:
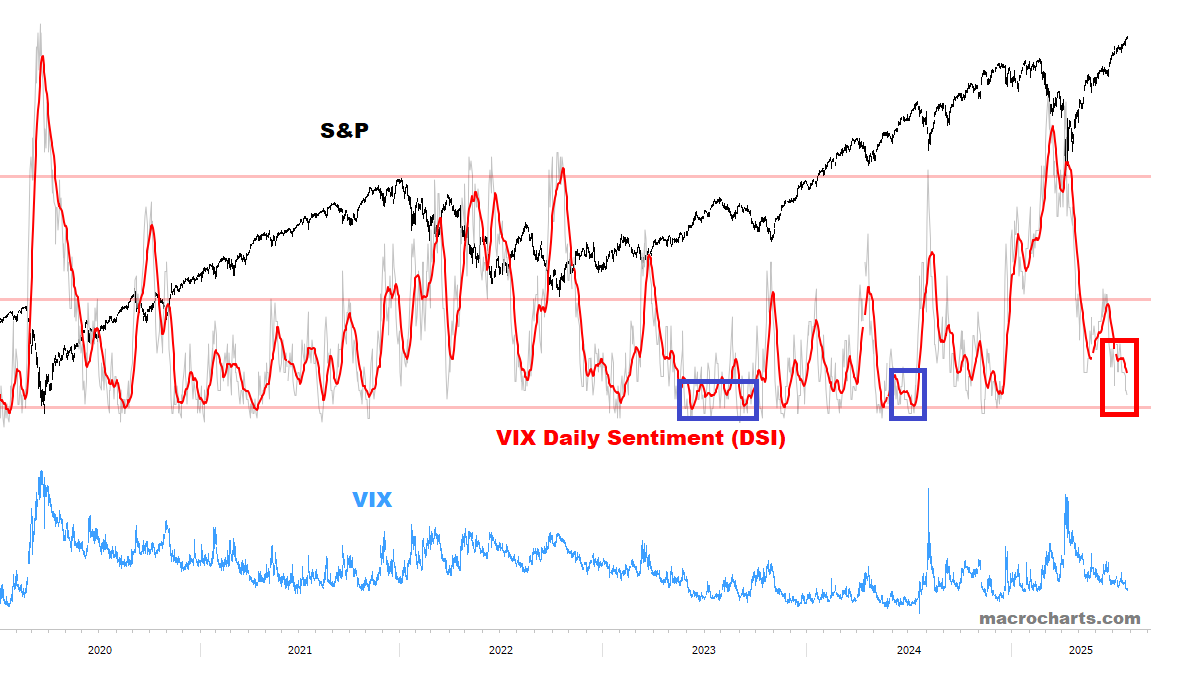
VIX has also reached our lower target range — monitoring for stabilization (*ideally VIX should bottom before stocks peak):

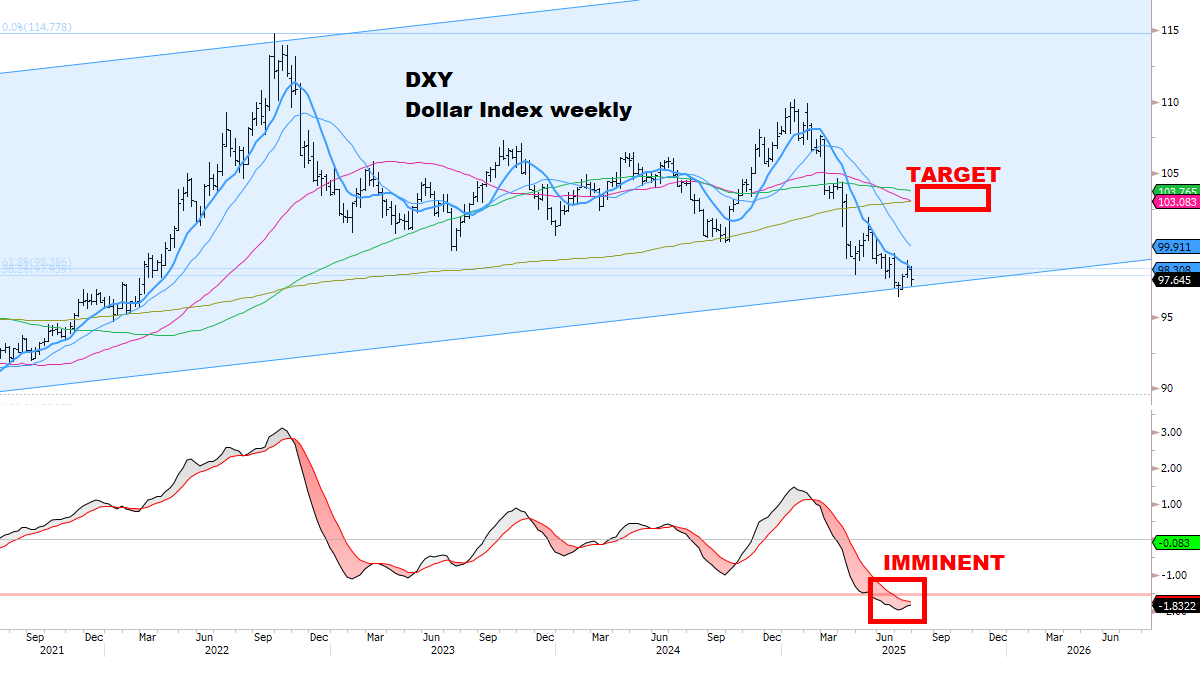
DOLLAR
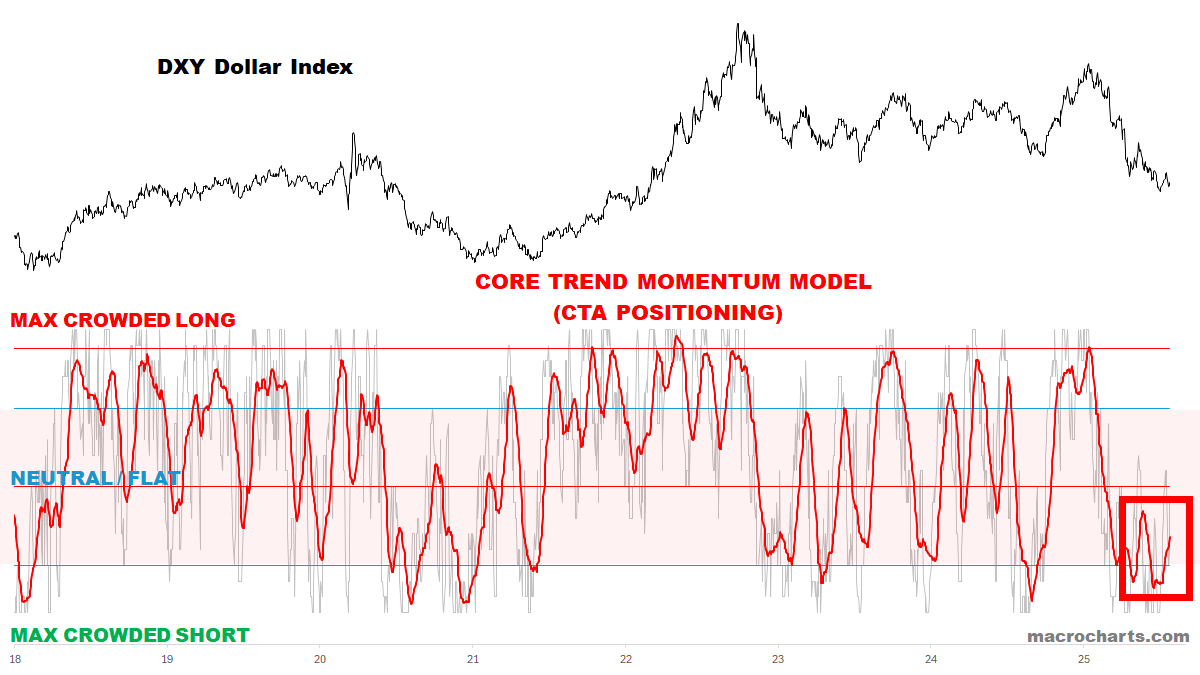
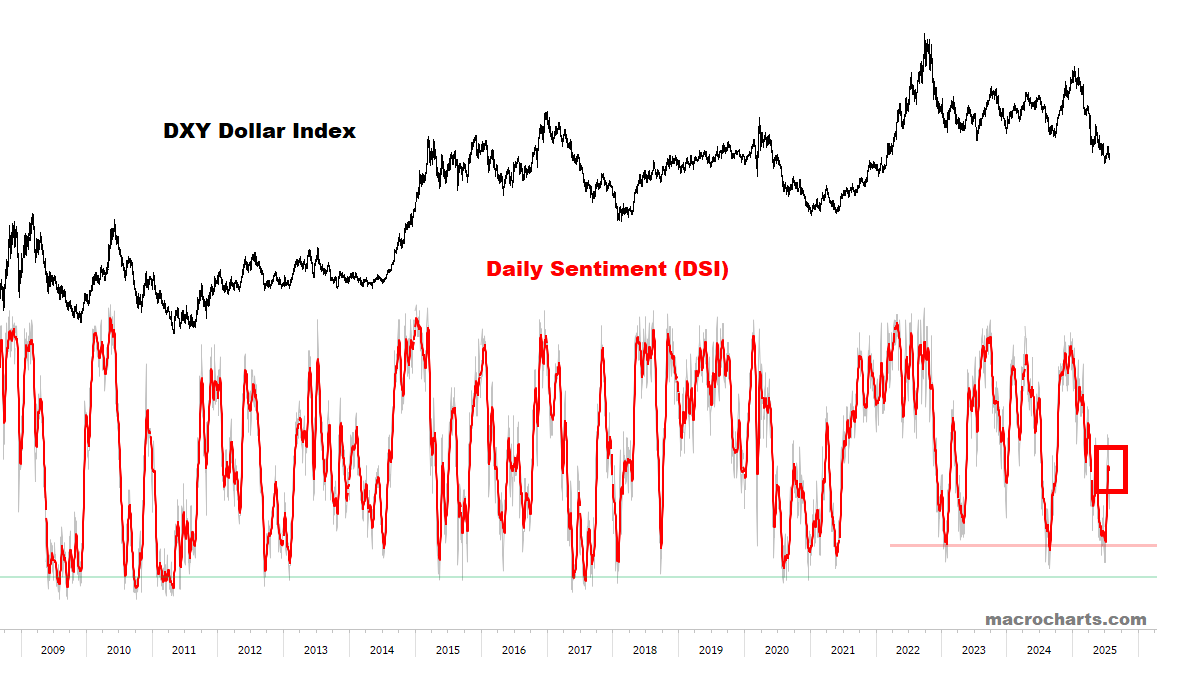
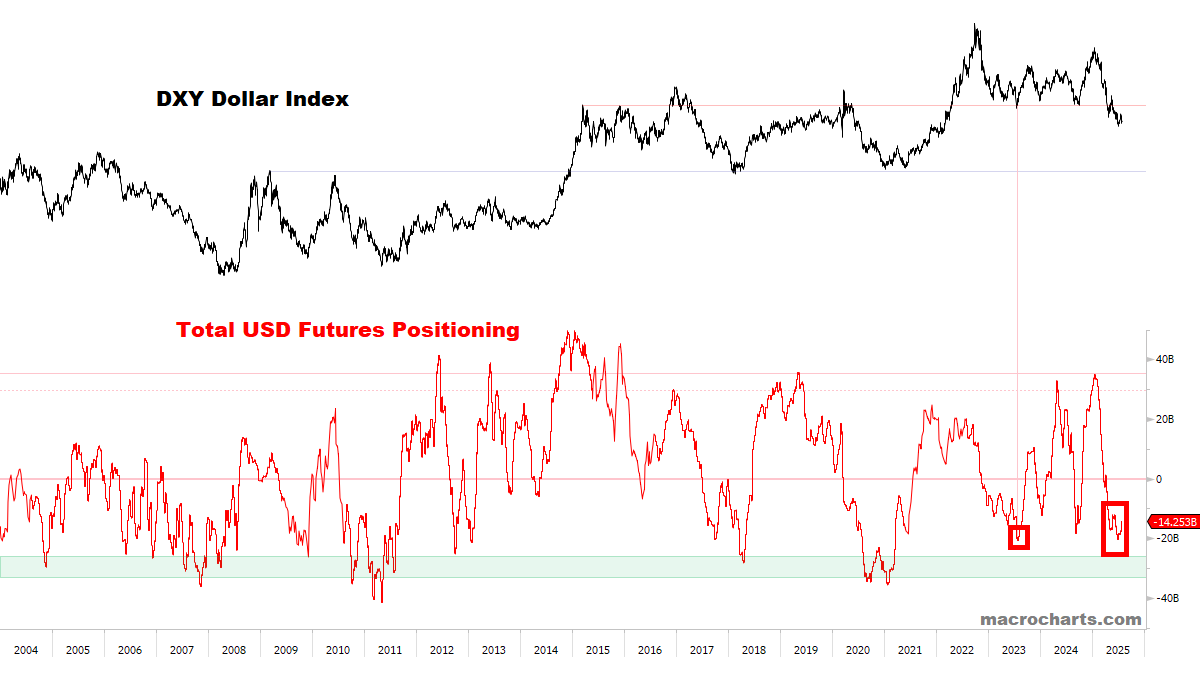
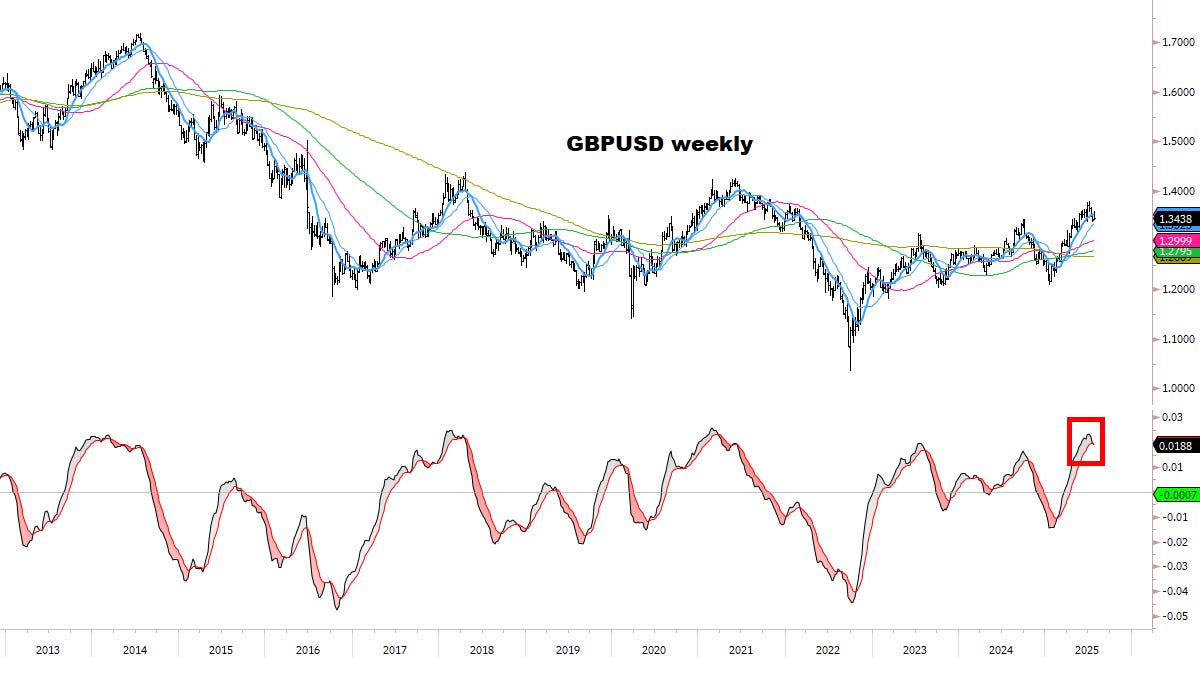
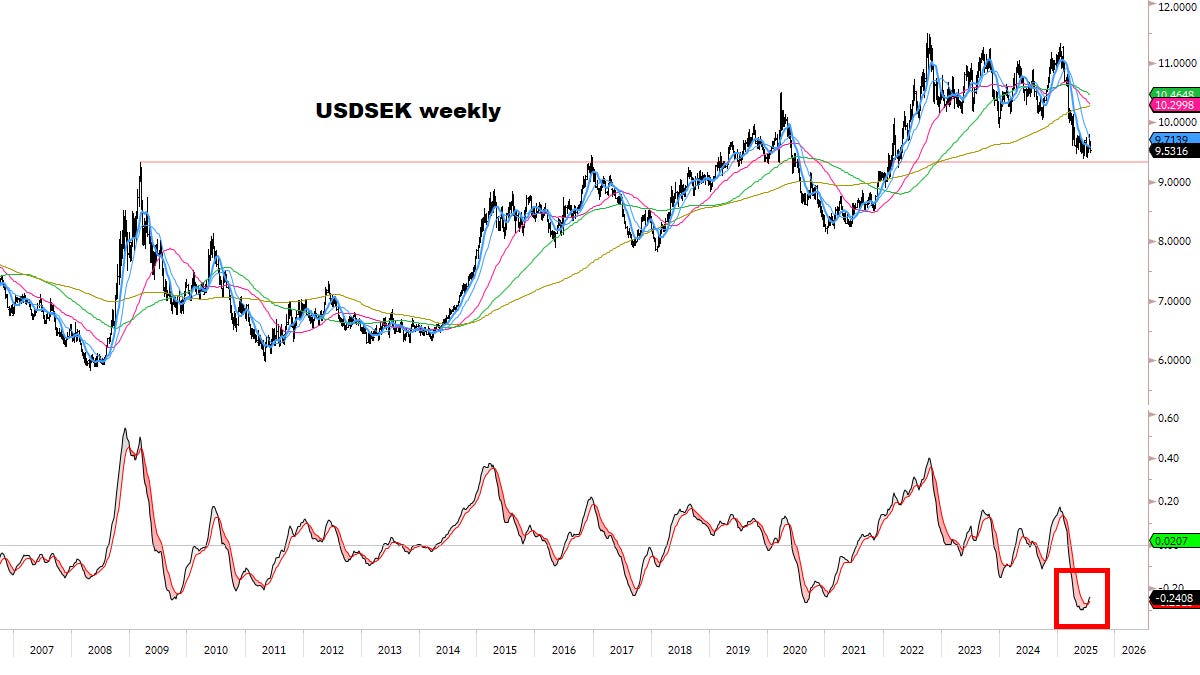
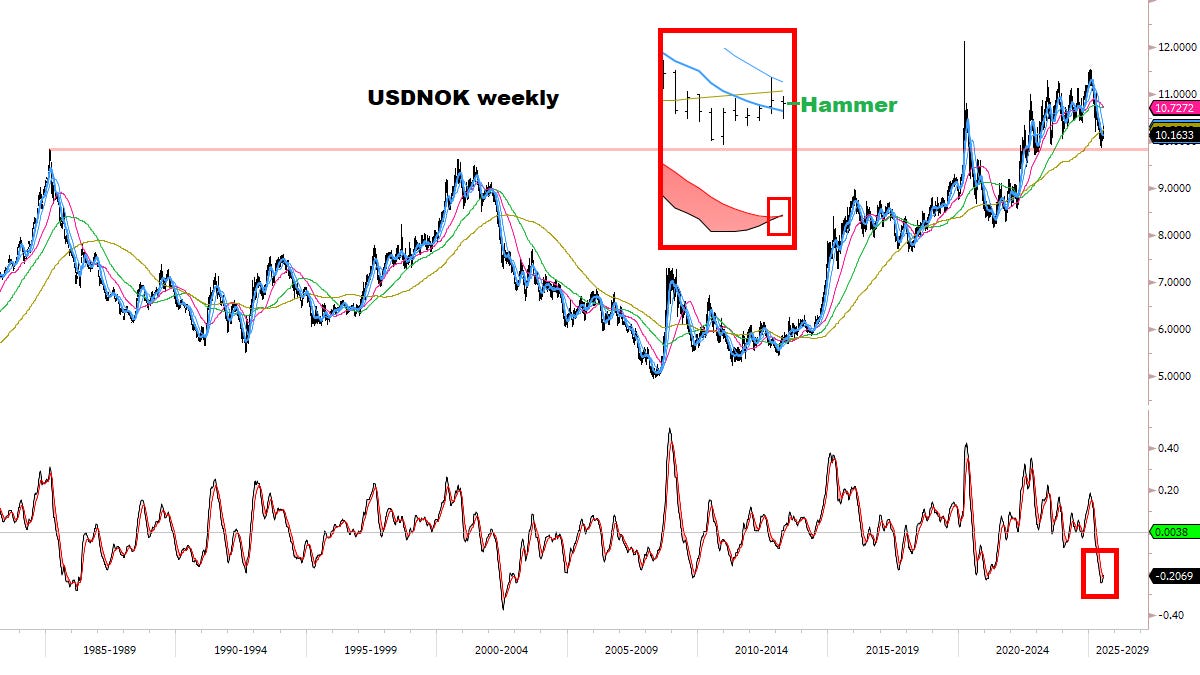
Dollar buy signals are accumulating.
CTA Dollar Trend positioning continues to build:
Dollar Sentiment is still just beginning to recover:
Dollar Net Short Positioning remains tied with the July 2023 bottom *and is still just beginning to recover:
Dollar momentum has room to push much higher:
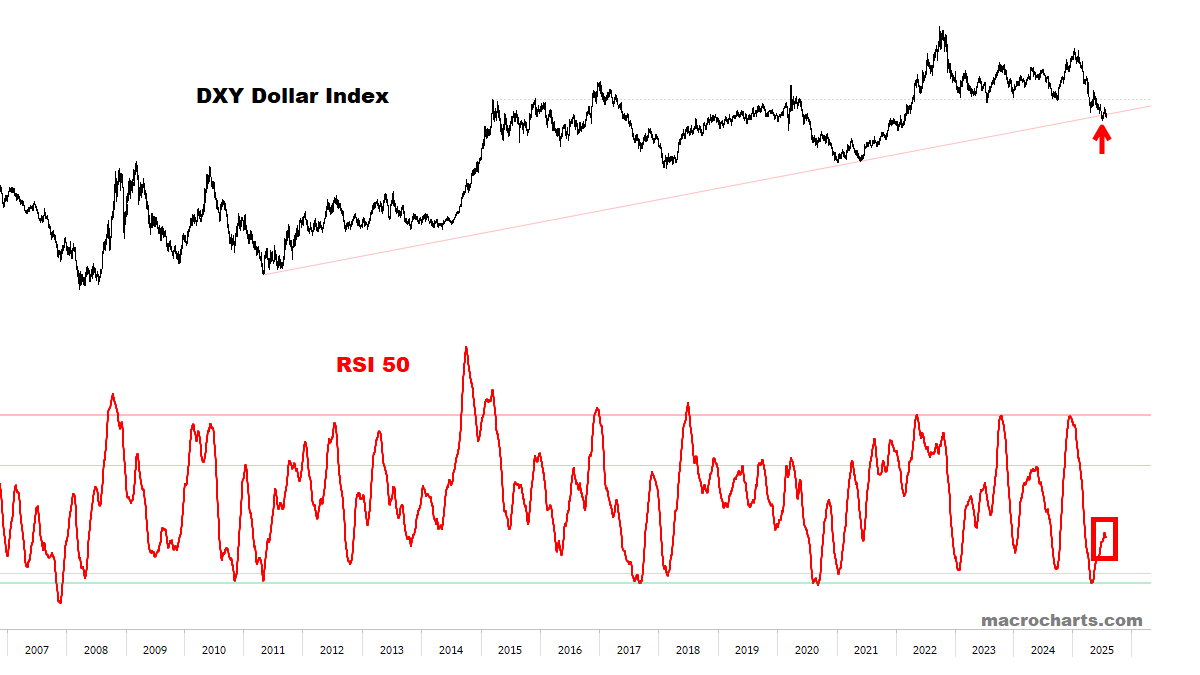
The chart continues to develop a potential perfect bottom:
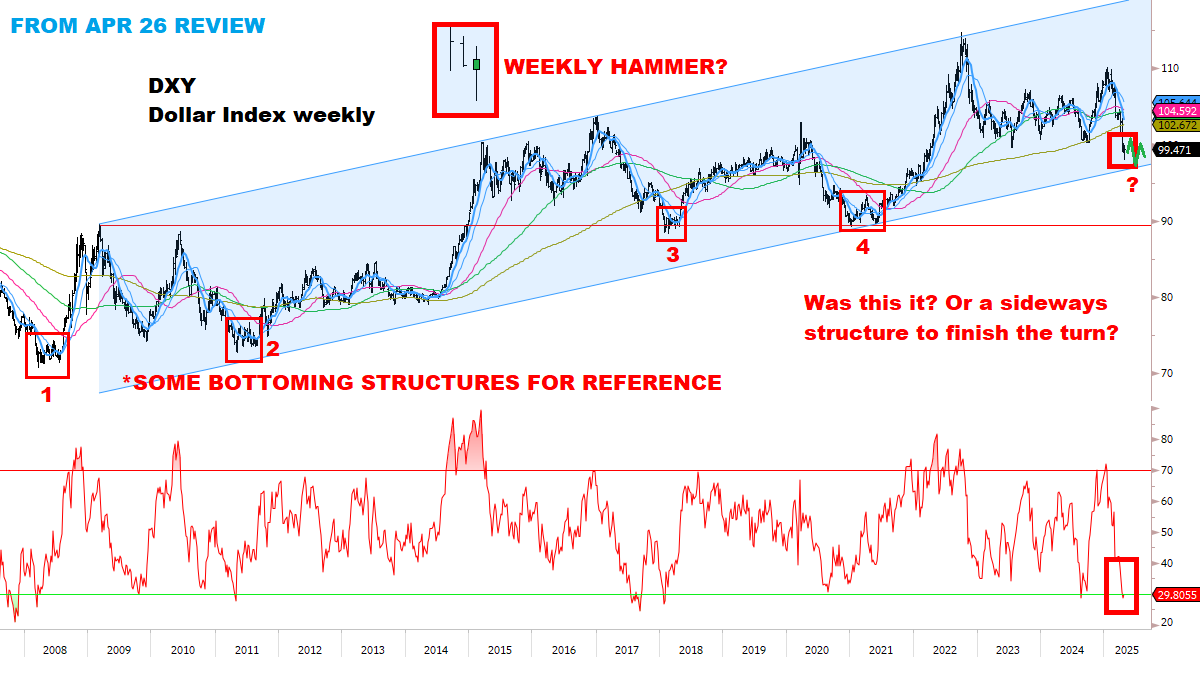
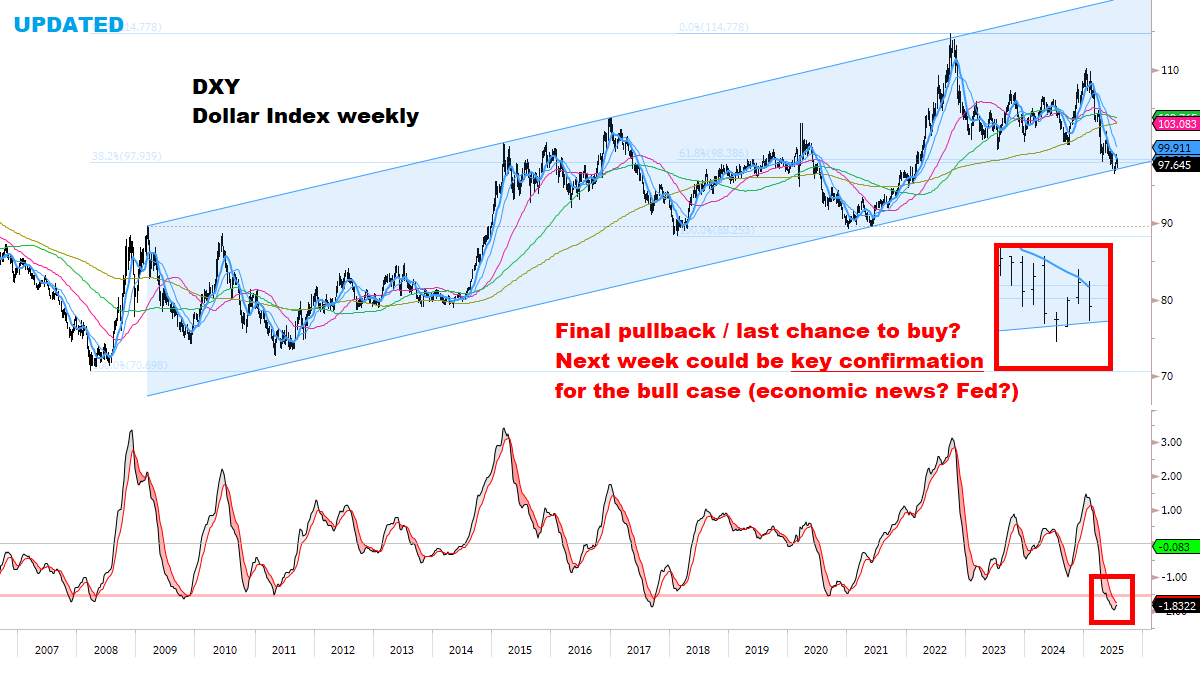
BATTLE PLAN (CONTINUED)
The Dollar may be finishing its base *right here right now*.
This is a critical moment — EVERYTHING converging for a decision next week.
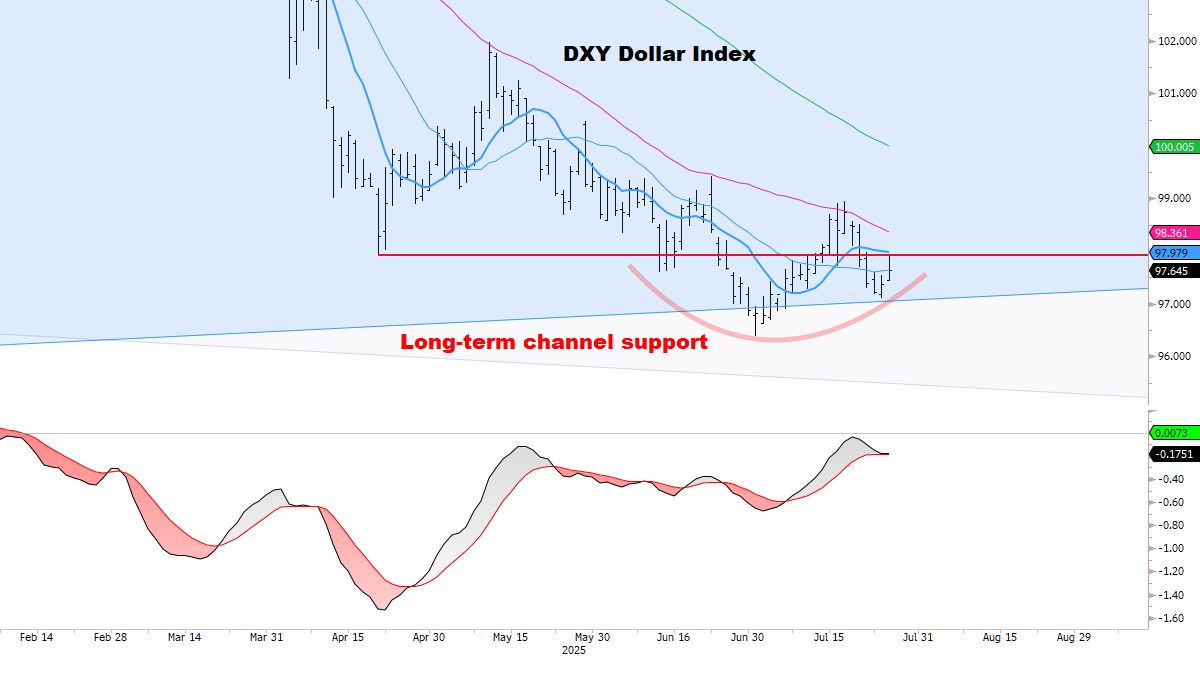
Below, the Dollar is coiled in an *extremely tight* range between long-term support and downtrend resistance.
ANY push above ~98.30 next week would break through key resistance. If the Dollar can push through the 50dma it would be a MAJOR inflection point. Watch these levels closely next week.
ANY push below ~96 would be a complete breakdown. Think this is the less likely outcome, as Weekly charts continue to suggest *significant* upside potential.
Time for the Dollar to make a decision — next week’s economic news / Fed meeting could be big catalysts.
If the bottom is confirmed, our minimum target is a Dollar rally back to 103 (or higher):
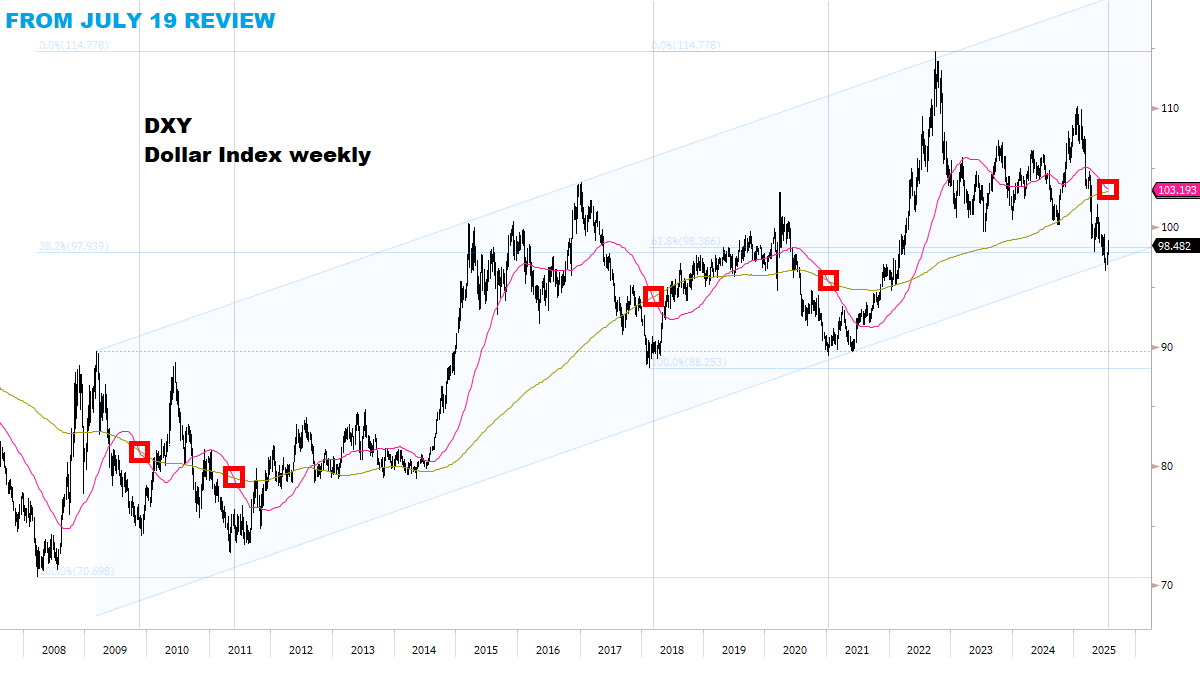
From July 19:
For more than twenty years, when the Dollar triggered a weekly Sell cross, it bottomed — and then rallied to the 200-week average (and beyond). The initial ~103 upside target may be conservative — but I’m working with this for now:
BONDS
Not the Rates you’re looking for…
CTA Rates Trend positioning continues pushing to higher Yields:

Bond Sentiment turned down last week — similar to May 2023:
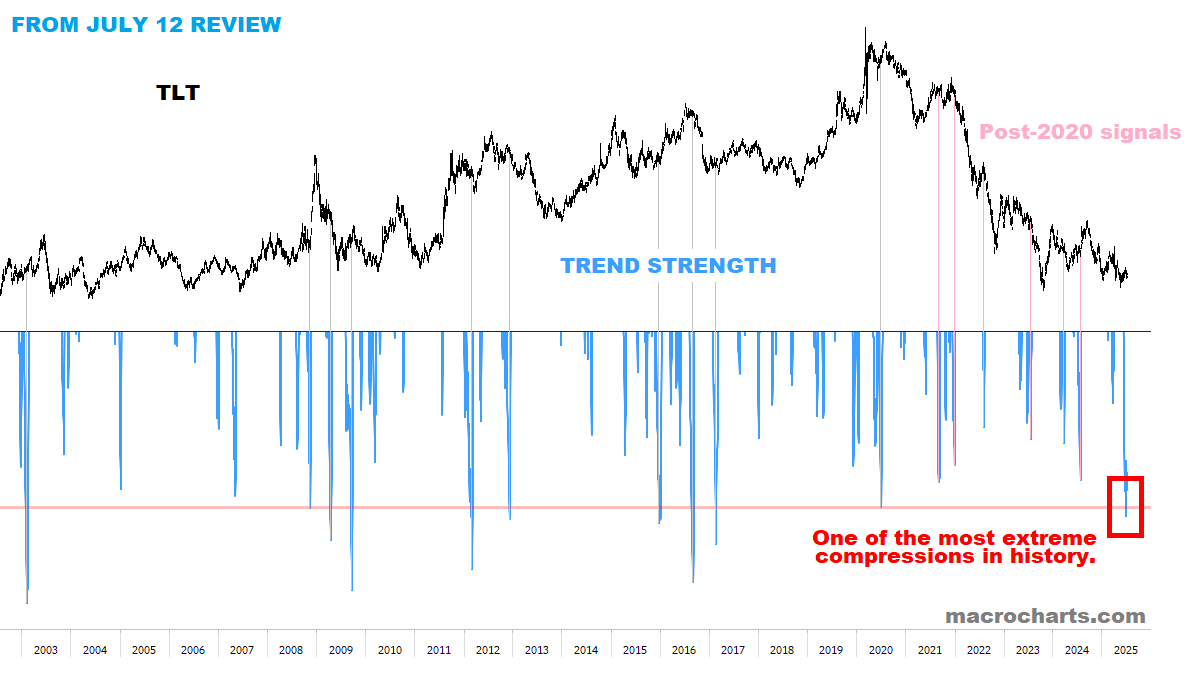
Rates remain among the most coiled in history:
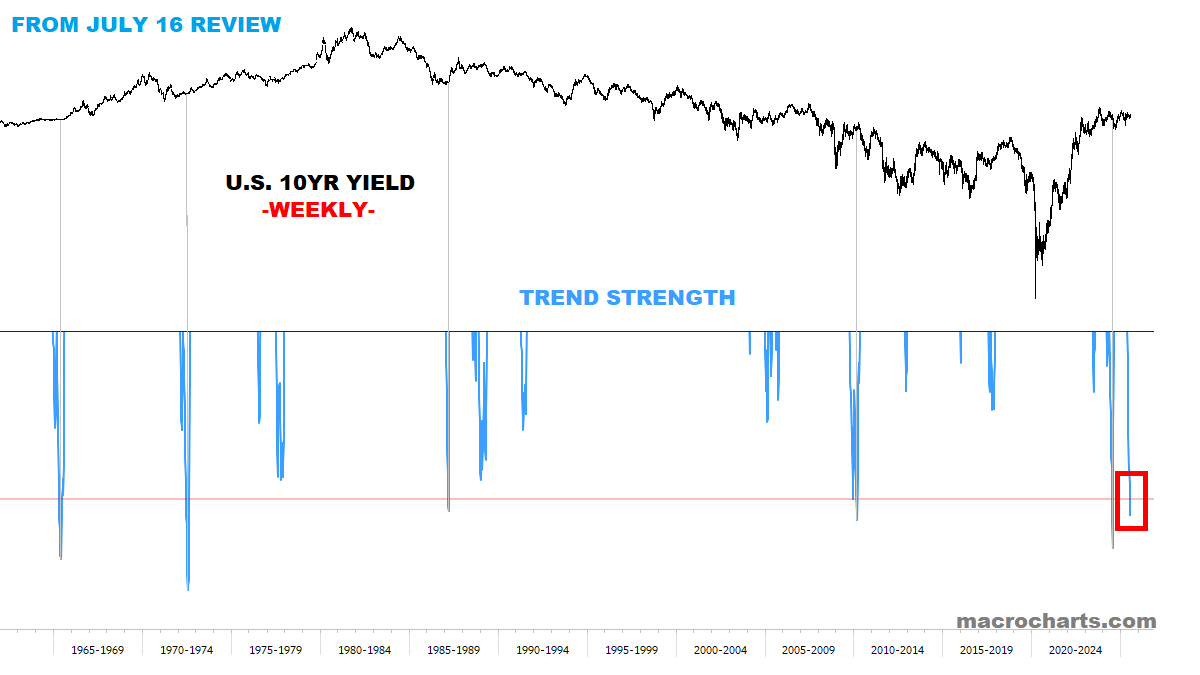

Rates ready to move, while a new “mini-Meme Bubble” begins to form in stocks…
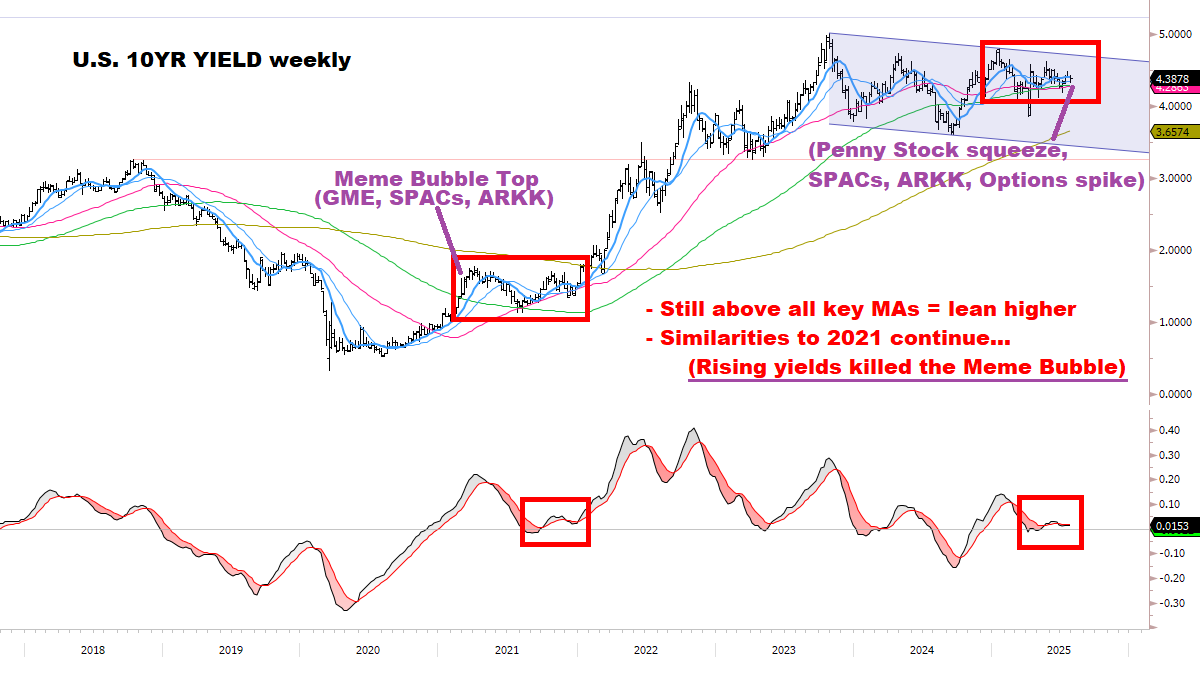
For Stocks: If Rates Volatility can remain subdued, the market should hold up. But if Rates Volatility spikes (globally) for any reason (Japan?), Stocks would suffer:
Is it tied to the Dollar turning? What happens to Bonds if the Dollar rallies?
PRECIOUS METALS
Exhaustion.
CTA Gold Trend positioning is in limbo:
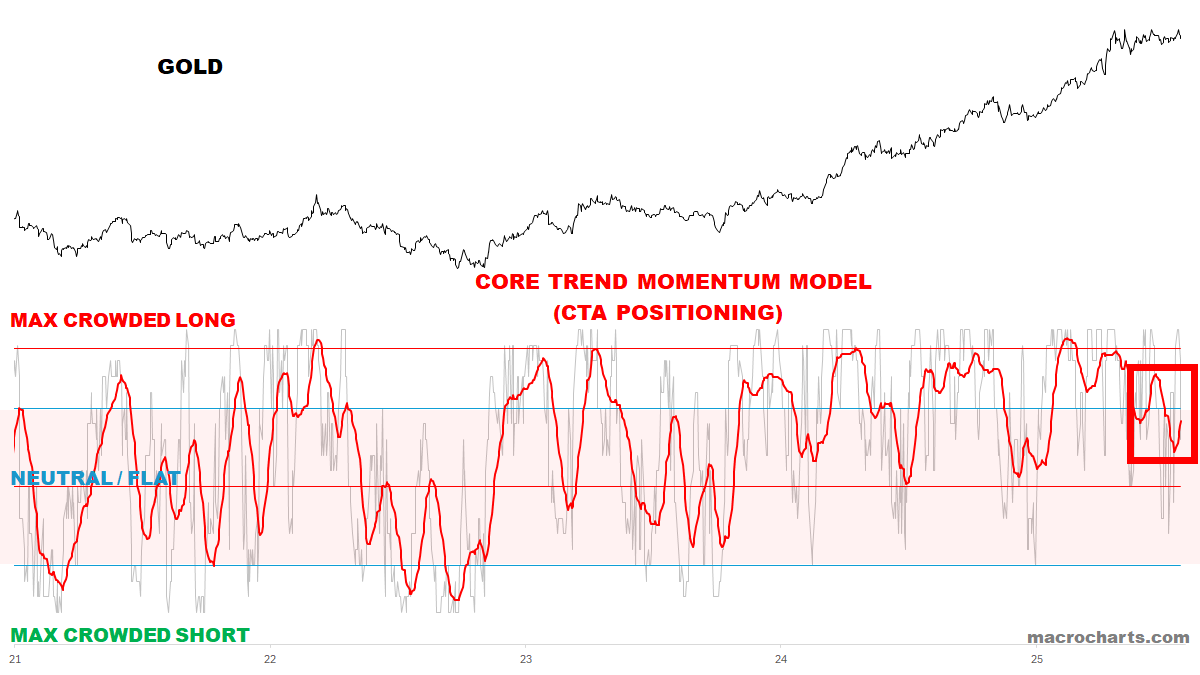
Gold remains in an extremely tight coil — *decision likely next week:

Gold and Silver sentiment remain in limbo — no big signal either way:
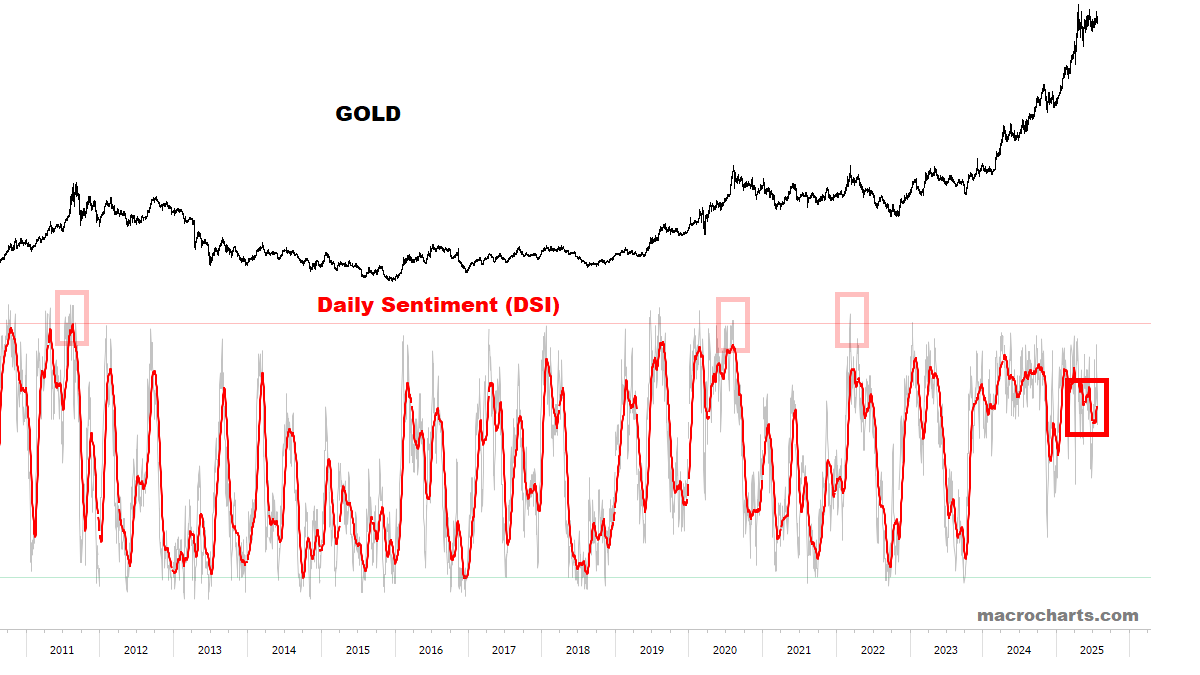
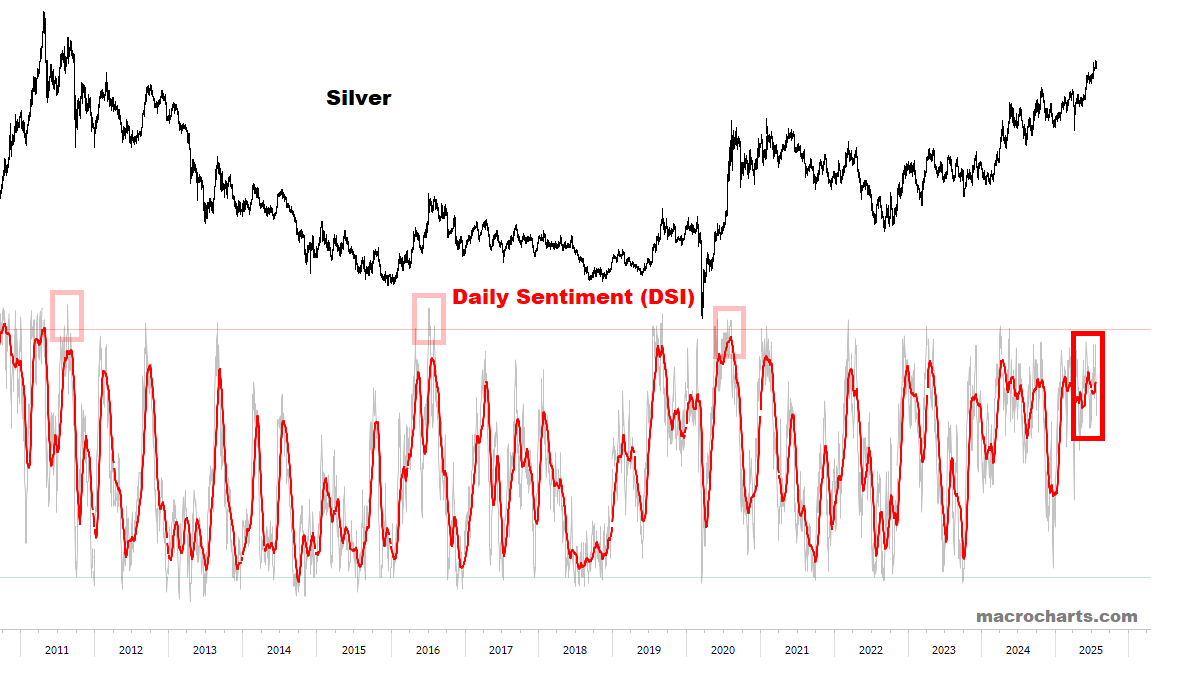
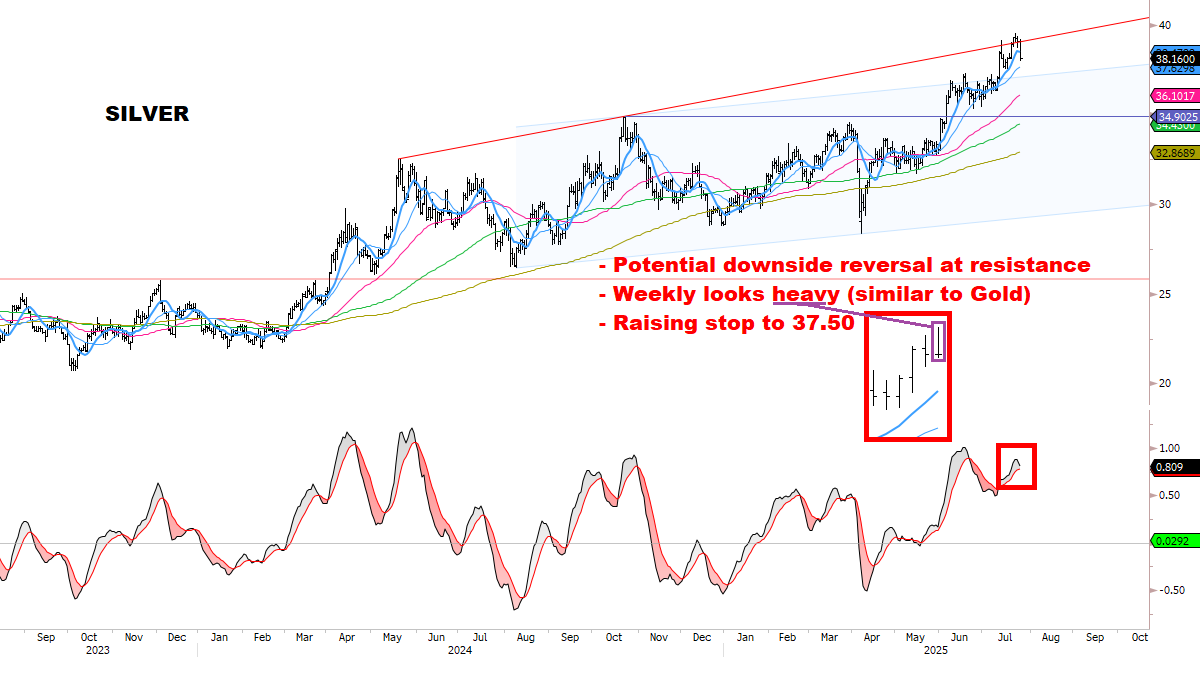
Watching next week for critical confirmation.
Are Precious Metals signaling the Dollar is “ready to go”?
*As we’ll show later, the global FX charts certainly agree…
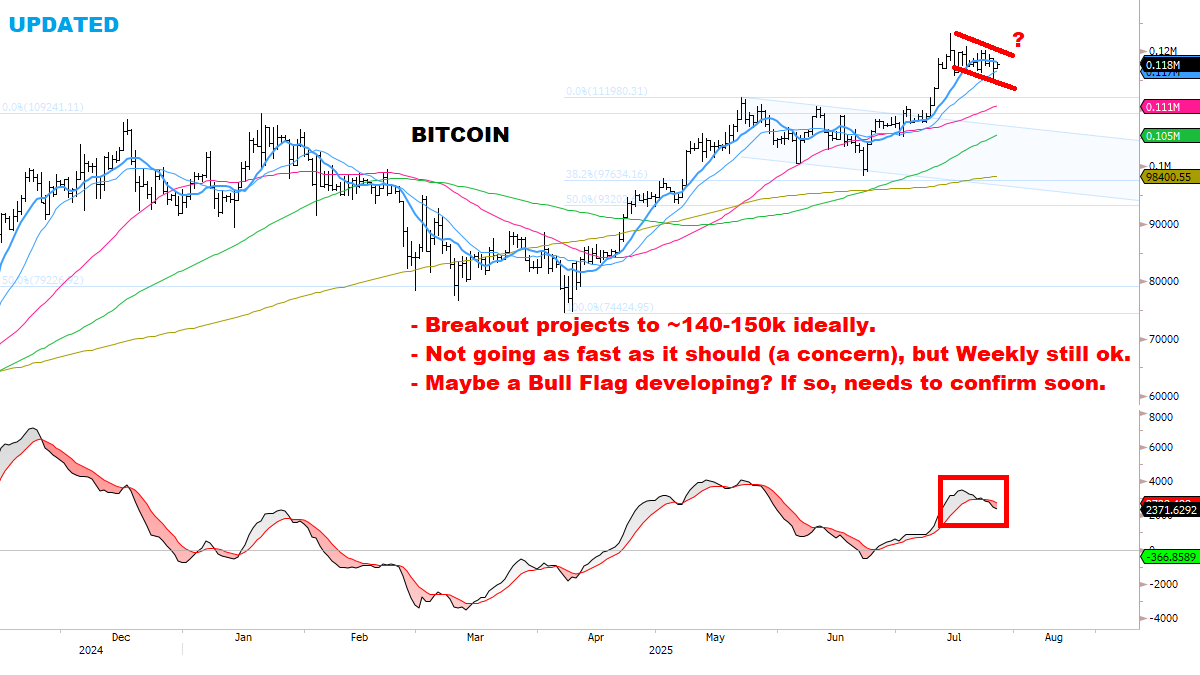
BITCOIN
Trend Power Oscillator remains constructive:
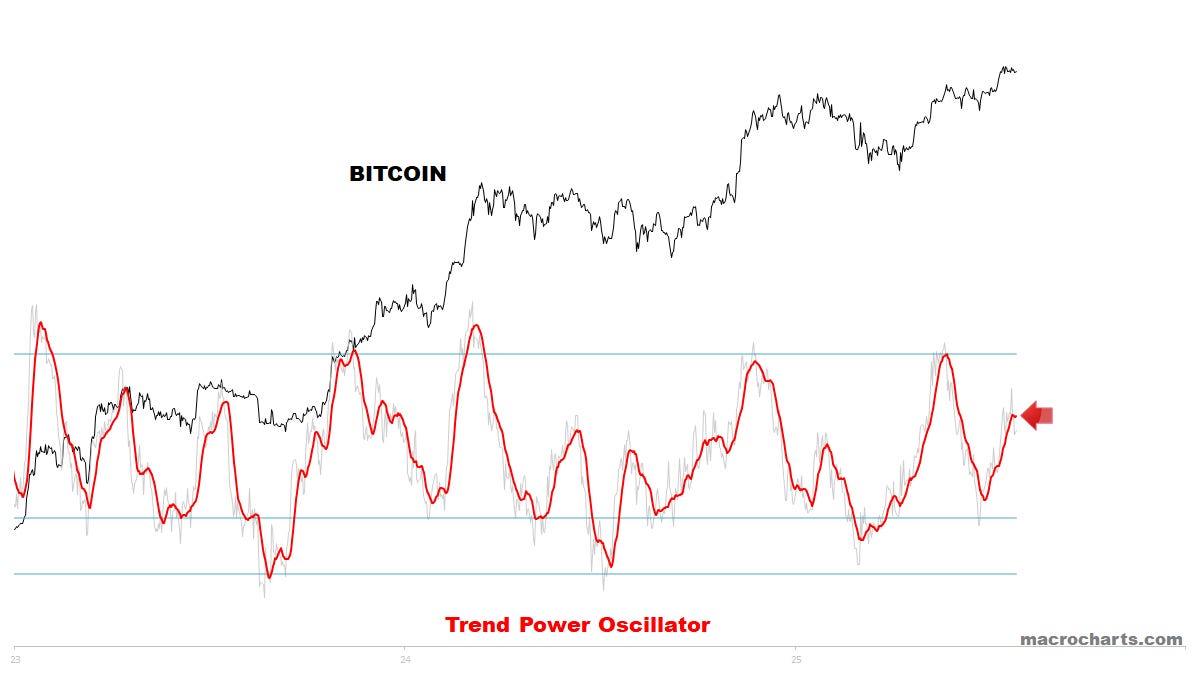
CTA Trend Positioning is turning down from overbought range — a tactical warning:
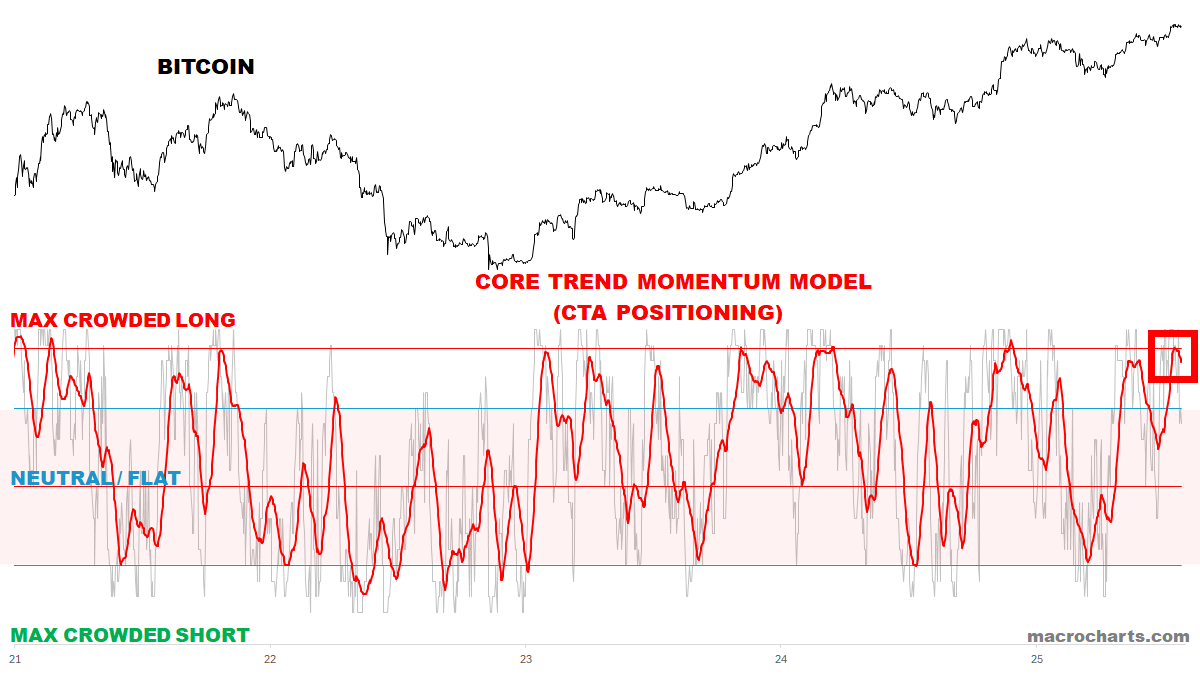
Tracking the perfect sequence:
One more push missing?
KEY TECHNICAL CHARTS
POPCORN MARKET — *watch the oven*.
There’s a time for everything — then it’s gone.
When making popcorn, there’s a brief moment it’s 99% popped & ready…
Waiting for the last 1% to pop has ruined many movie nights.
*And leaving it unattended could burn the house down.
The same is true in markets…
WHAT TOPS LOOK LIKE — A CHECKLIST:
a.k.a. “Things you don’t see at a Bottom…”
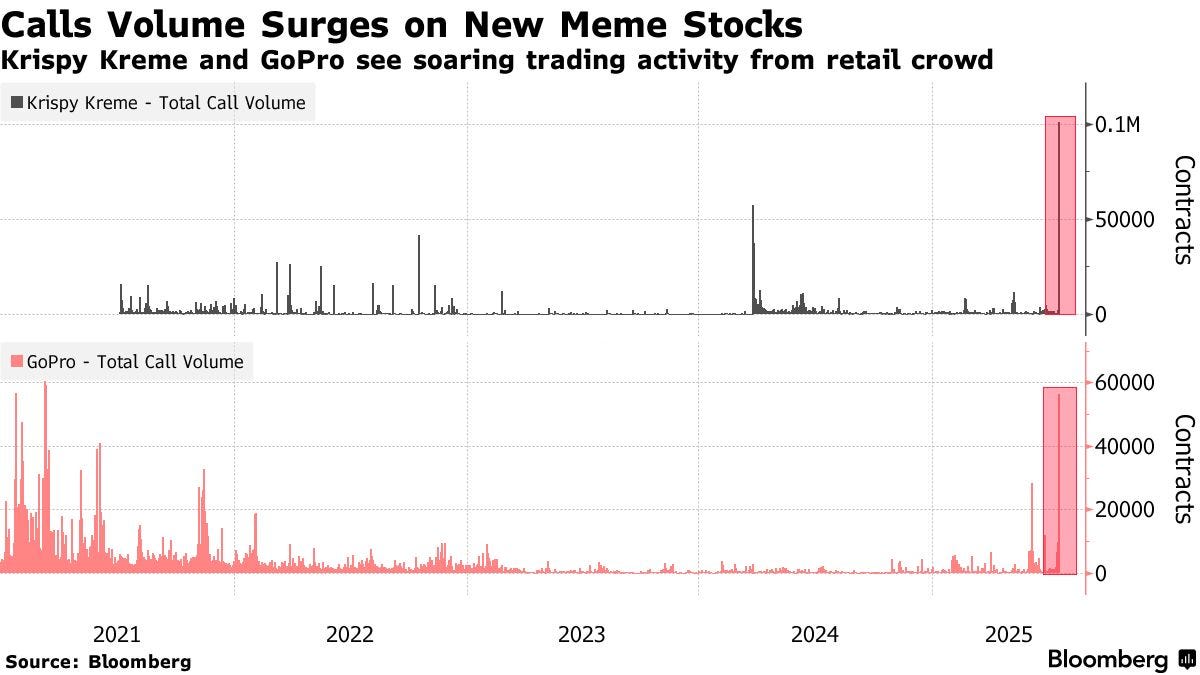
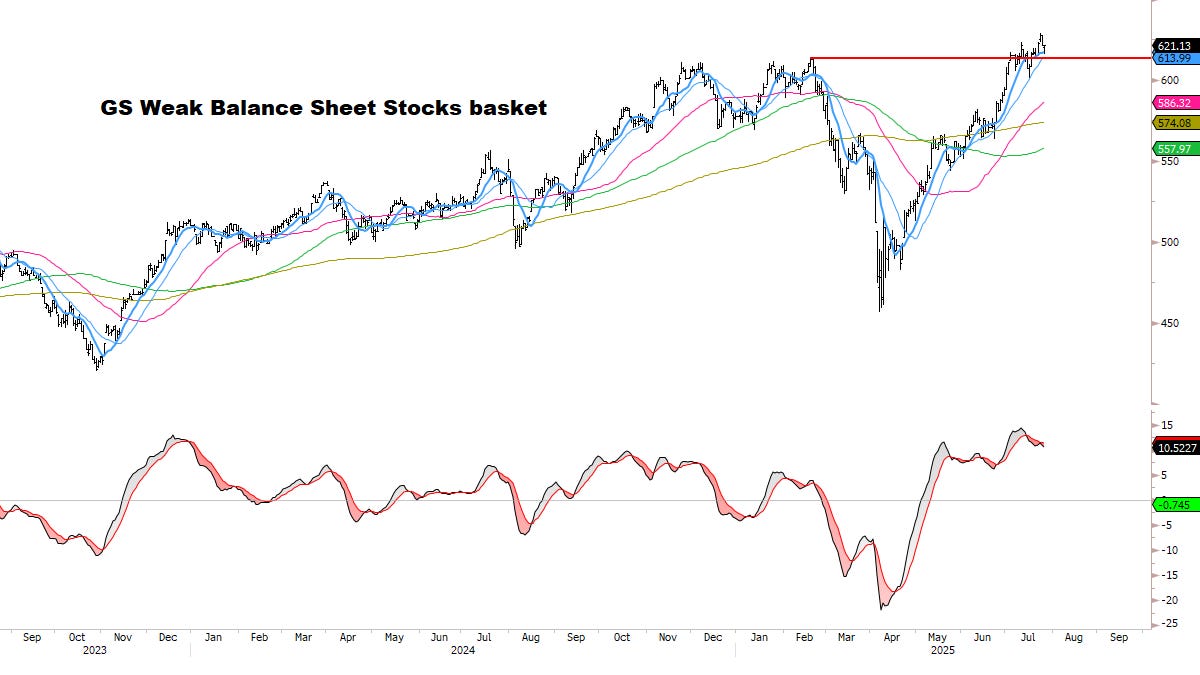
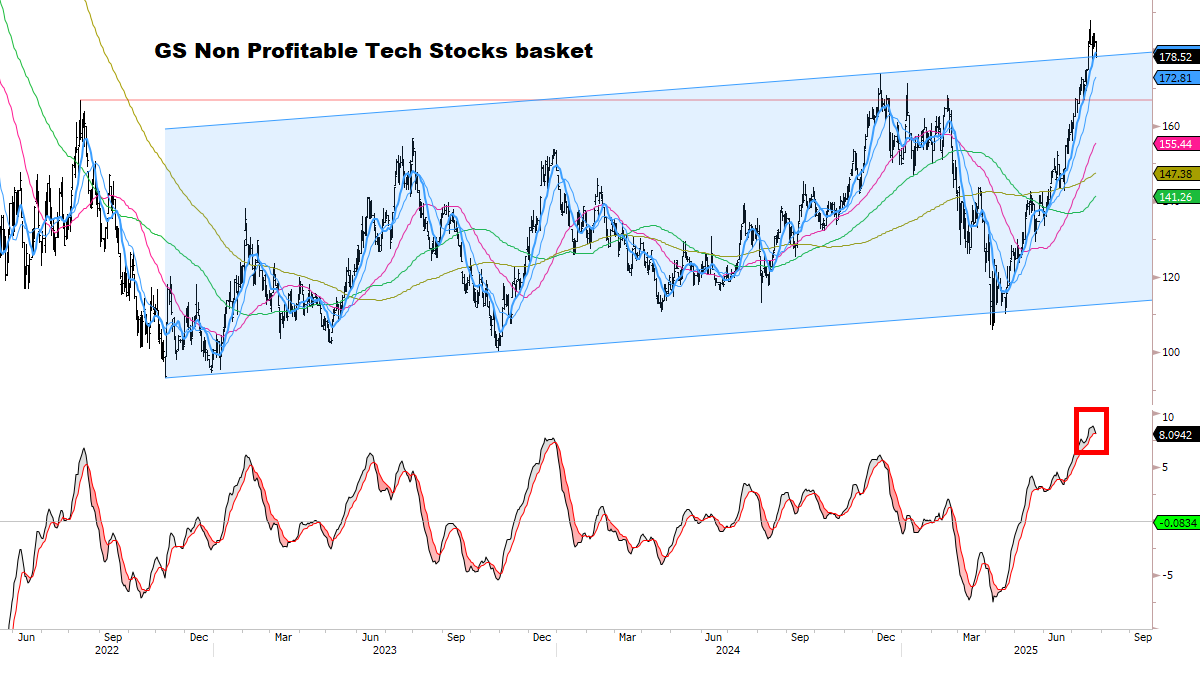
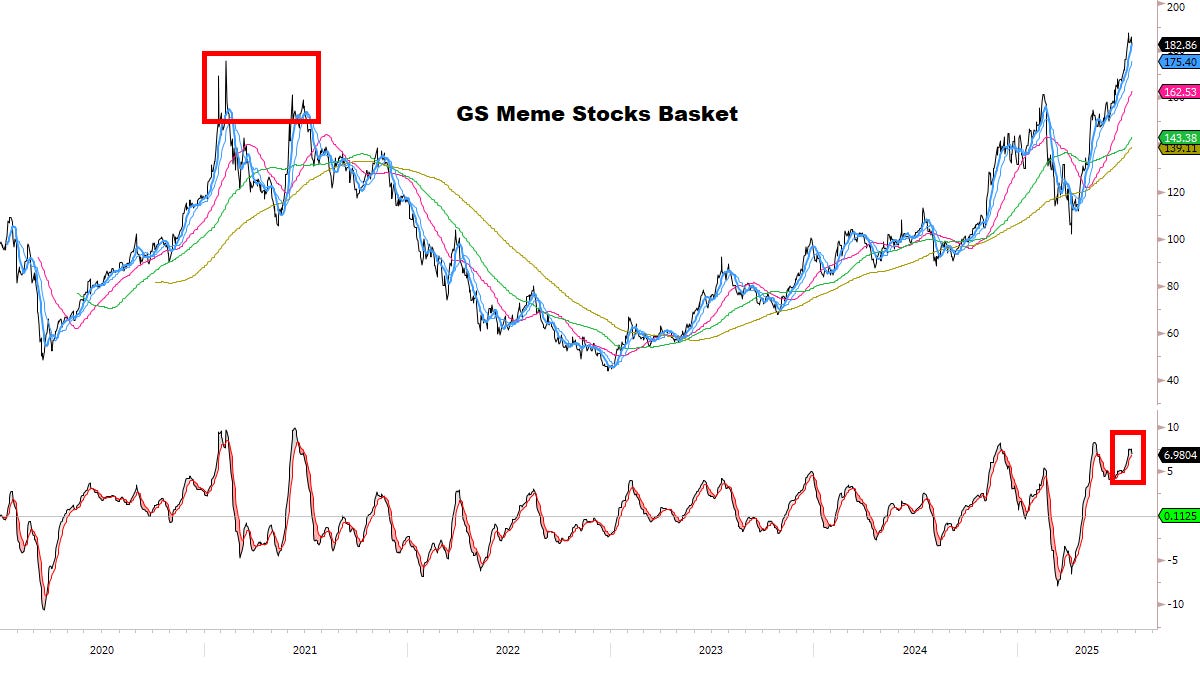
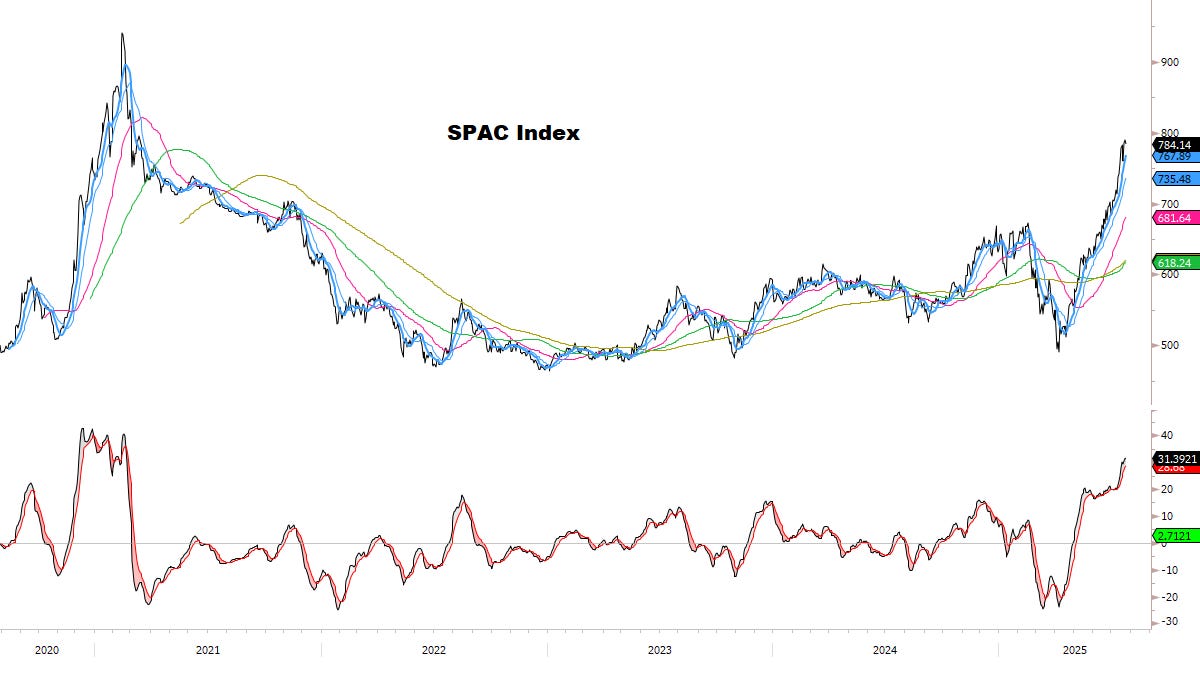
✅ JULY 23: “GoPro, Krispy Kreme Gain as Markets Abuzz About Meme Stocks” (article link)
Krispy Kreme and GoPro had record-high call volumes, with Krispy Kreme's call volume spiking on Tuesday and continuing to rise on Wednesday, and GoPro having its highest call volume since 2015.
Other stocks rallying included 1-800-FLOWERS.COM Inc. and burger-chain operator Wendy’s Co, which both posted double-digits gains early in the day but closed just 4.4% higher.
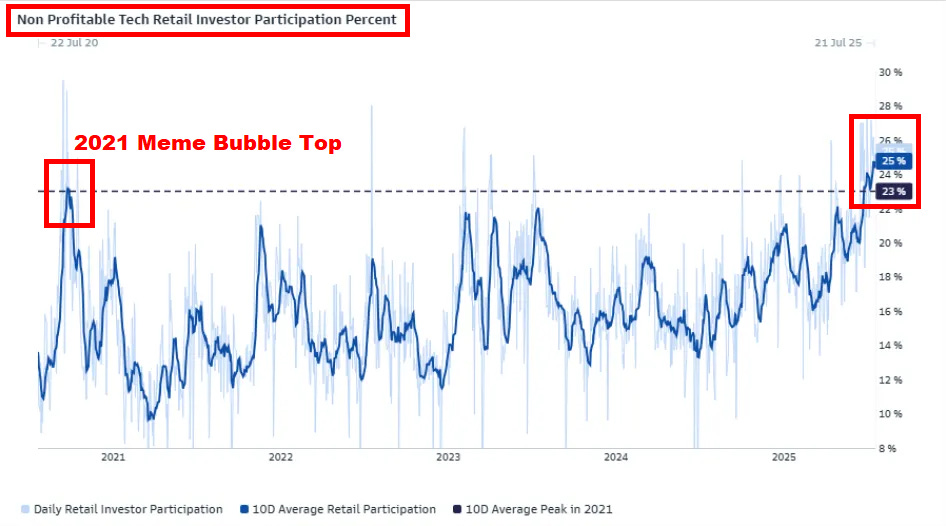
✅ JULY 23: “Meme Stock Euphoria Spreads as Retail Traders Pick New Wagers” (article link)
“According to Citadel Securities, retail traders were net buyers of cash equities for the past 19 straight trading sessions, the longest streak since the frenzied days of the 2021 meme stock craze.”
“The 10-day average of retail participation in non-profitable technology companies reached 23% — the highest level since Goldman Sachs began tracking it — and rose to 25% this week.”
Related:


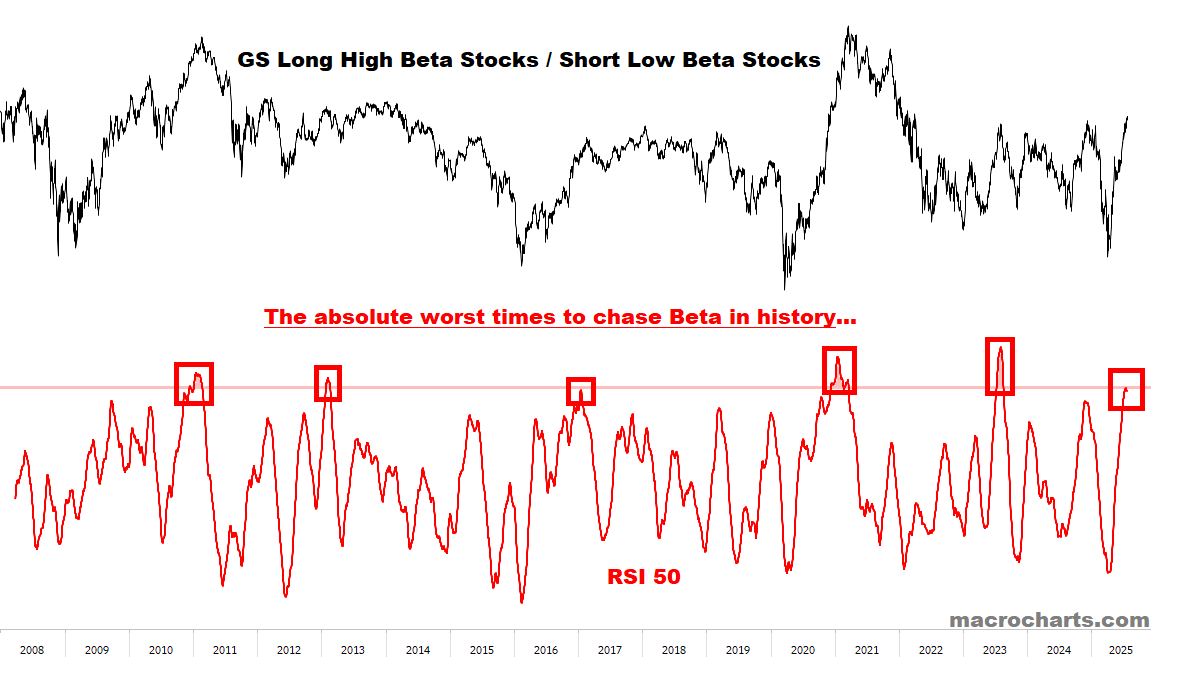
Earlier this week I mentioned JPM published a report showing “Long High Beta Stocks is now the most crowded trade it has ever been in history”.
Below, a related chart — showing historic overbought conditions:
*High Beta Stocks had major multi-year drawdowns after prior cases.
*Previously, the longest they held up before topping was 2 months (2011 and 2021) — both periods featured loose monetary policy. Now it’s (arguably) replaced by loose fiscal policy — or until the Bond market says “enough”?

Big picture:
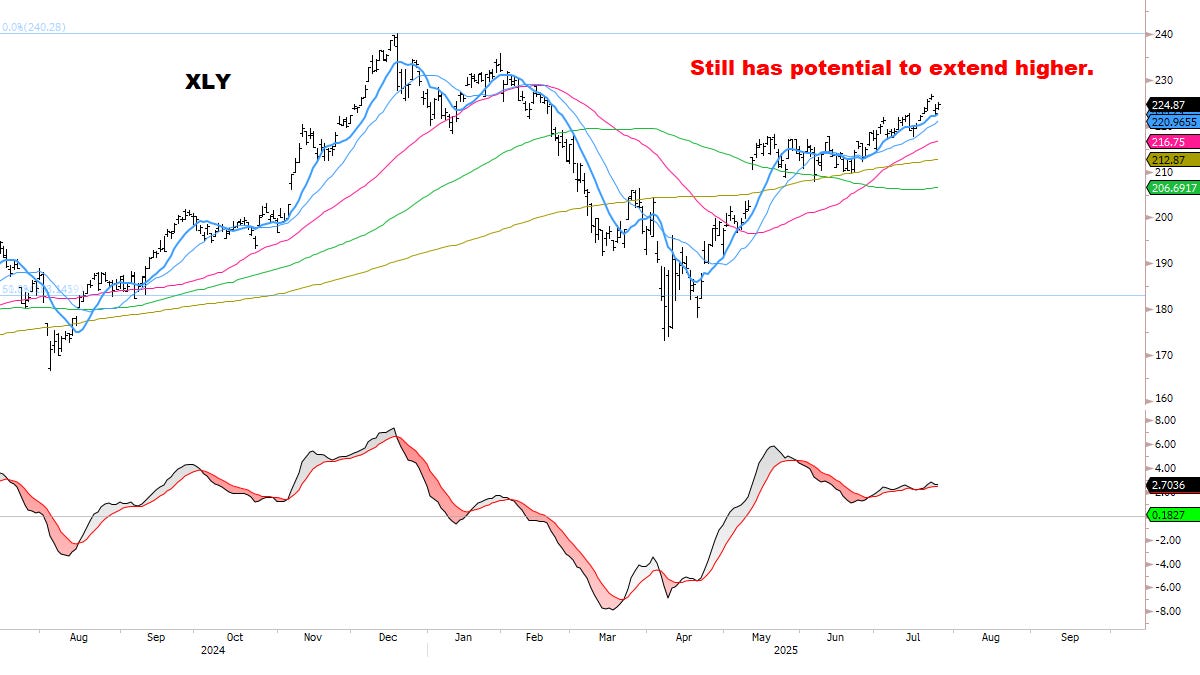
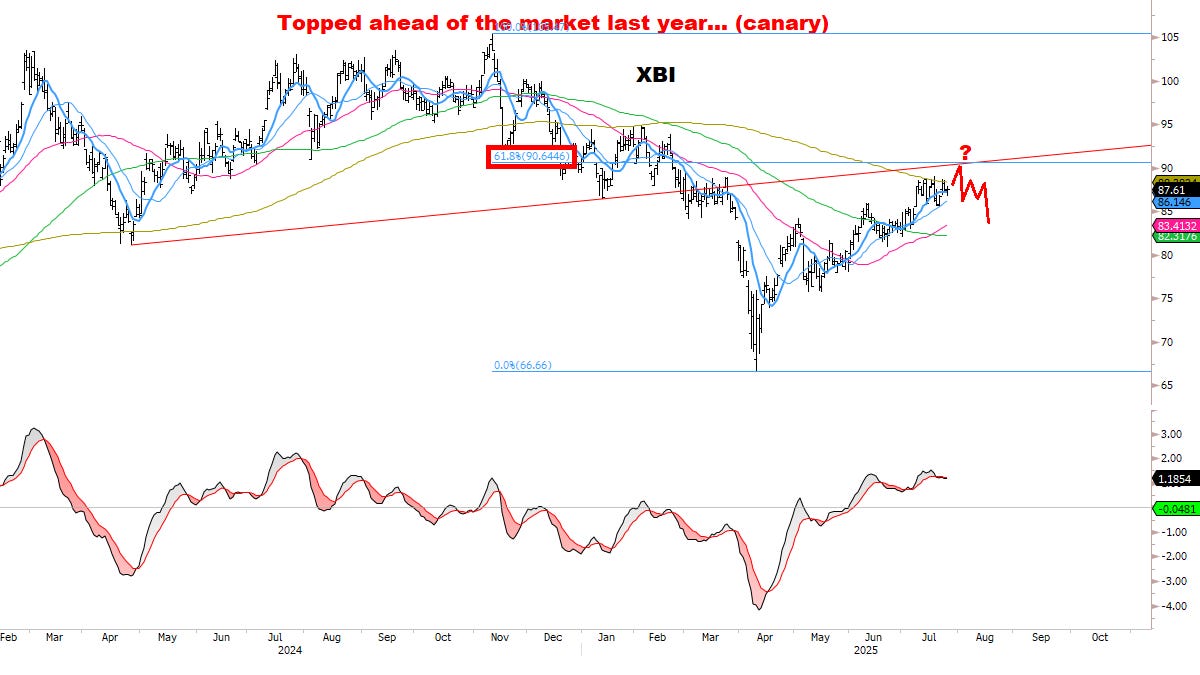
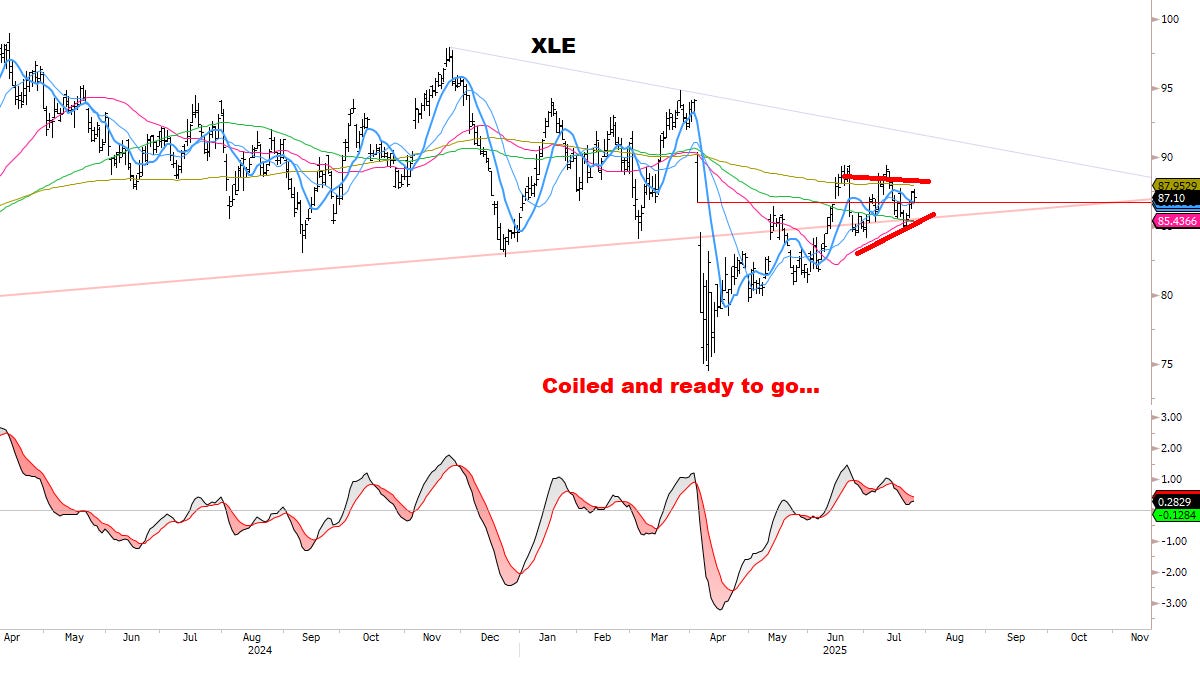
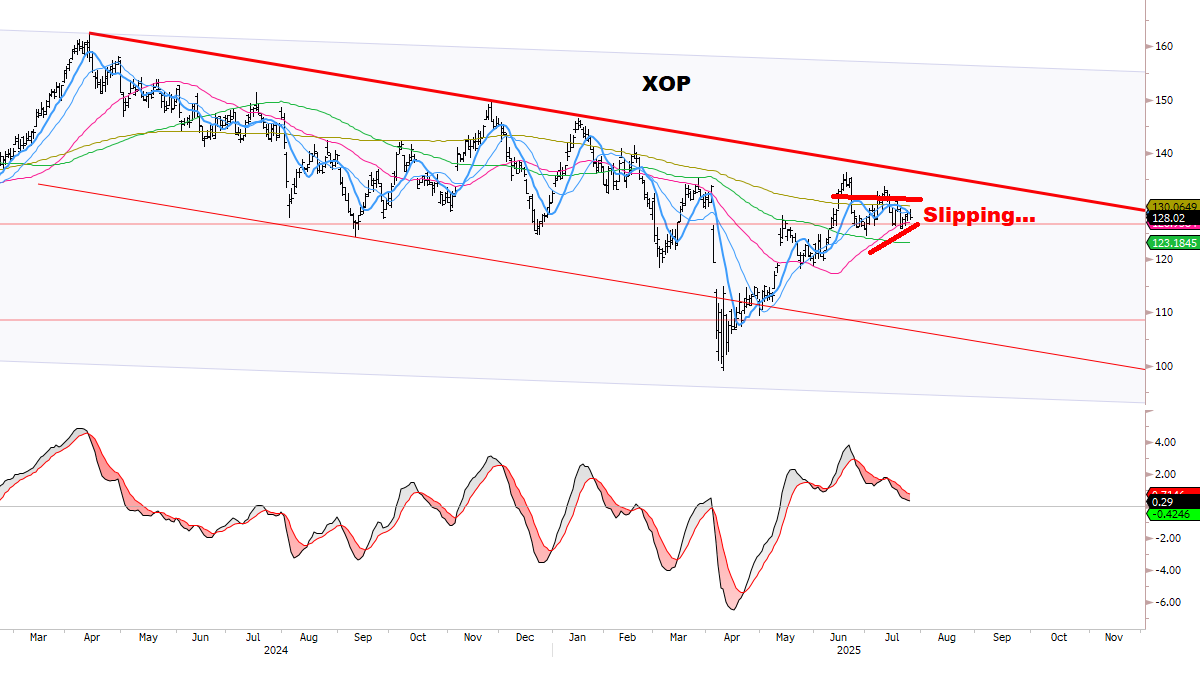
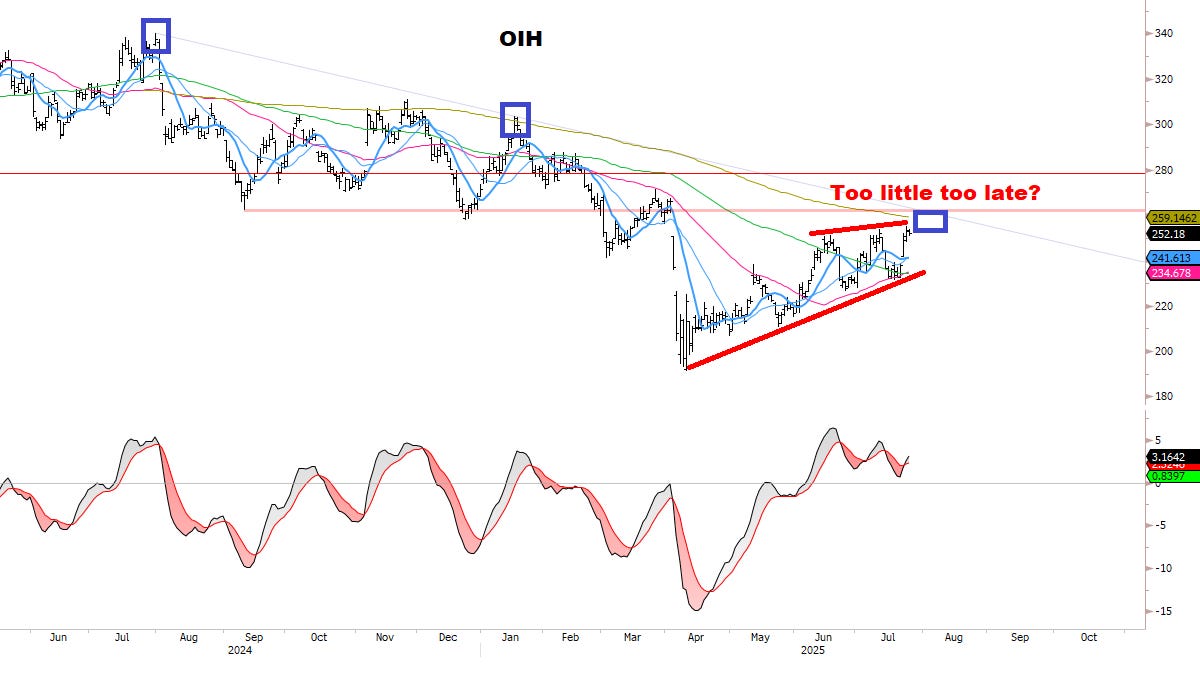
Core Sectors are still ok for now — difficult to build a top while leaders carry the market / move in synch.
Uptrends remain intact, no bearish reversals in core groups yet.
VIX and Credit Spreads continue trending down.
UPDATED STOCKS SCAN:
Through the end of June 2025, the average stock in our Core Watchlist was up +45%, with several names near/over 2x — a strong outperformance relative to the market.
As before, focused on: Stocks meeting strict criteria for (1) relative strength, (2) improving momentum, (3) defined risk. Building on this list as signals develop.
✅ “Have a plan and follow it” — getting more selective: reducing individual names for the first time in this rally.
✅ Gradually raising cash from (keyword:) High-Beta names rolling over / triggering trailing stops / extended. Case-by-case, and making incremental decisions — always.
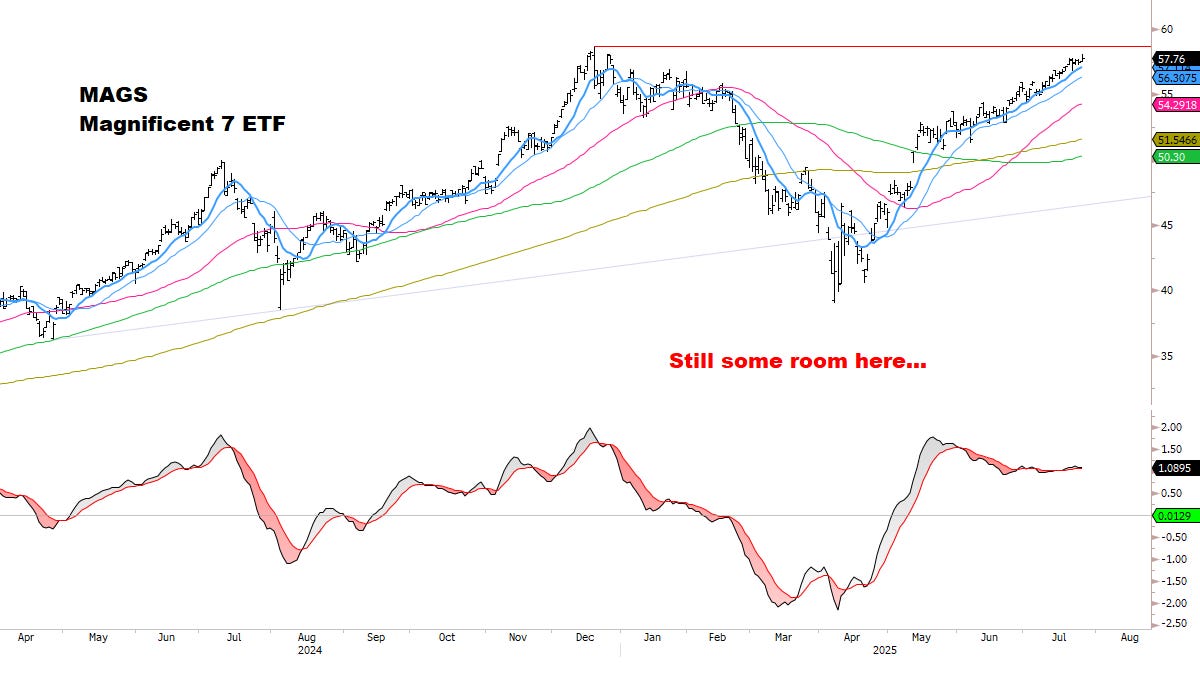
Leaders still trading well:
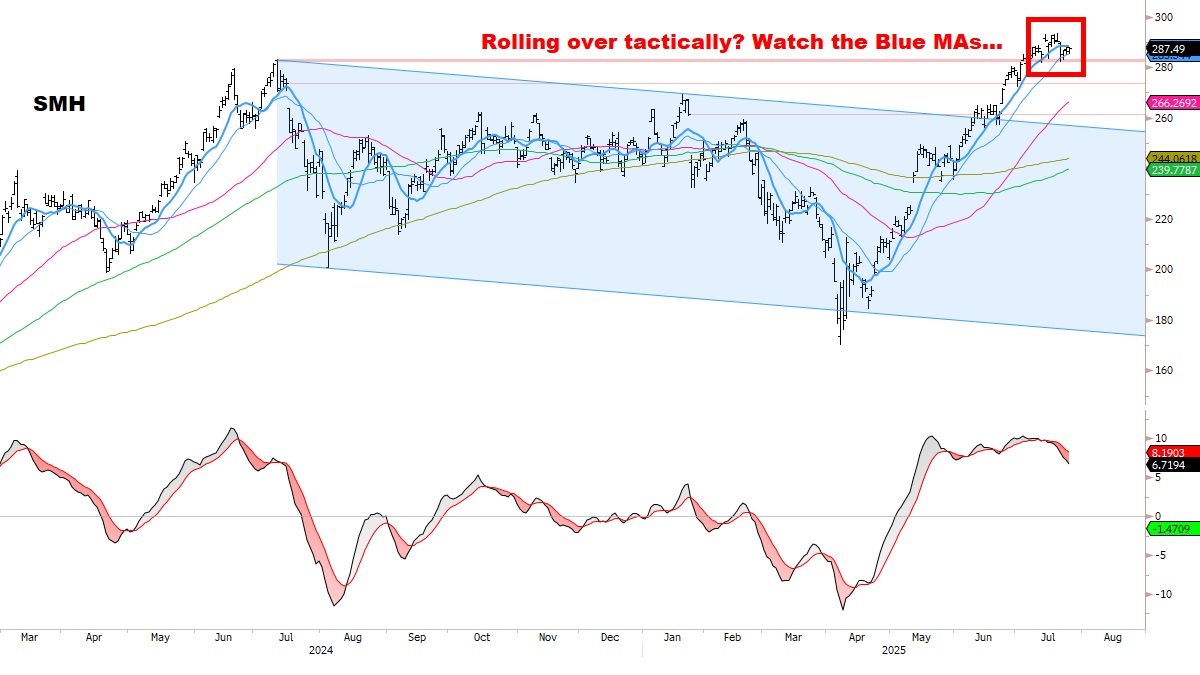
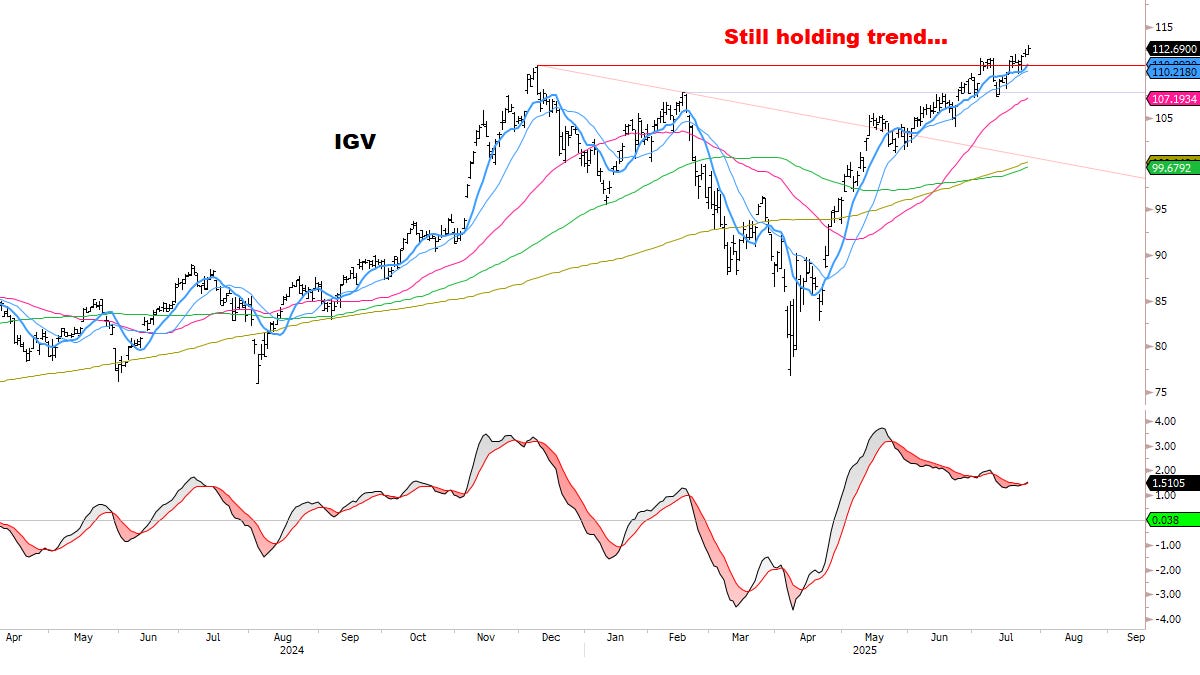
AAPL (progressing to ~220 ideal target), AMD (extended but no sell yet), AMZN (potential to new high — another big week, almost there), ANET (slow and steady continues, potential to ~130), APP (extremely tight and trying to roll-up, needs to go right here or raising stop to 340), ARM (continues to trade well, room for ~180), AVGO (still leading the way), CDNS (breaking through big 2-year resistance, could ultimately target ~400, *but* earnings Monday will be the final arbiter), CEG (~350+ remains on the table but looking to reduce further if reached), CSCO (still holding), DASH (moving well towards breakout objective of ~260 old high), DDOG (still on track to ~160-170 after rolling up last week), EBAY (got the new high this week on schedule, time to consolidate?), EXPE (still working, still looking for 200+ ideally), FTNT (still in the coil, has a chance to ~115+ but running out of time), GEV (monster move post-earnings, extended beyond all measure and may never pull back again in our lifetime… but reduced another 1/3 anyway — down to initial size only), GOOGL (solid post-earnings, still on track to 200+, have been saying this since May at ~160 when the world thought it was over for “legacy search”), GS (glued to the highs), JPM (still grinding away), MSFT (monster run, relentless), NVDA (still strong), ORCL (monster run, extended but still strong), PLTR (still working with new high Friday, impressive), RGTI (holding trend but if it breaks <15 directly below would be a warning for the whole group), SHOP (still working, on track to new high and potentially beyond), SMCI (more progress this week, with potential to accelerate)
Pullback / Shakeout developing, at or near support range:
ASML (200dma + 100dma — if no immediate recovery is seen next week, will be a cut), AXON (reacting at ~700 as flagged last week), CRWD (still at 50dma and just above ~455 breakout with roll-up potential and medium-term ~600 breakout target), META (forming a handle with 50dma directly below), MPWR (too many tests of 50dma now looking vulnerable — consider cutting), MSTR (watch how it reacts to 50dma directly lower — was expecting more from this rally, seems tepid), MU (testing big support ~110 and 50dma, watching for roll-up), NRG (shakeout at 50dma last week was quickly recaptured, “looking good for roll-up here but needs to go immediately” — nice confirmation this week but ultimately still sideways for two months now… time to “go big or go home”), SPOT (tagged 50dma, watch for roll-up potential just above ~650 breakout zone), TSLA (still can’t get going either way — tight against all moving averages, <300 would confirm a breakdown, weekly MACD losing energy), UBER (almost tagged 50dma again, watch for roll-up potential), ZS (in ideal support range for a bottom, may be rolling up already — below 280 would target a deeper retest of ~260)
Key Stocks developing potential tactical tops / rolling down:
AMAT (lower this week again), BKNG (10/20 stop), COF (looks like a topping reversal on Wednesday), IONQ (10/20 fading into a Sell cross, time may have run out for this name and the group — leading indicator for risk appetite?), JBL (monster run, spent July losing momentum however and this week’s new high was quickly reversed), LRCX (10/20 Sell cross imminent, may retest down to ~85-90?), SE (erased last week’s rally, coiling but feeling toppish), SOFI (could spike to old 2021 high ~25 as part of a topping structure, but daily already on Sell), VST (as discussed in Subscriber Chat on Wednesday, setup to sell/reduce on the gap up)
New ideas:
Tactical: RKT (nice spike this week, got swept in the general short-squeeze, which makes it less interesting now, so prefer to cut). Longer-term: FSLR (nice upside follow-through building in a decimated group), SEDG (more basing around ~16-17 could set up a longer-term play — will update), ARRY (more basing around ~6 could set up a longer-term play — will update), CSIQ (more basing around ~11 could set up a longer-term play — will update)
Extremely overbought and monitoring for Sell/reversal:
COIN (top may be in?), HOOD (top may be in?), RBLX (chance to ~141 but beware)
Charts invalidated/cut this week:
IBM (“pullback to 260-270 perhaps” — didn’t think it would get there in a week, but here we are… needs time to rebuild, wouldn’t rule out bigger test of 200dma ~245), INTC (had a chance, but this week’s breakdown just shows it’s still not ready for prime time)
Risk Areas — Short/Underweight candidates:

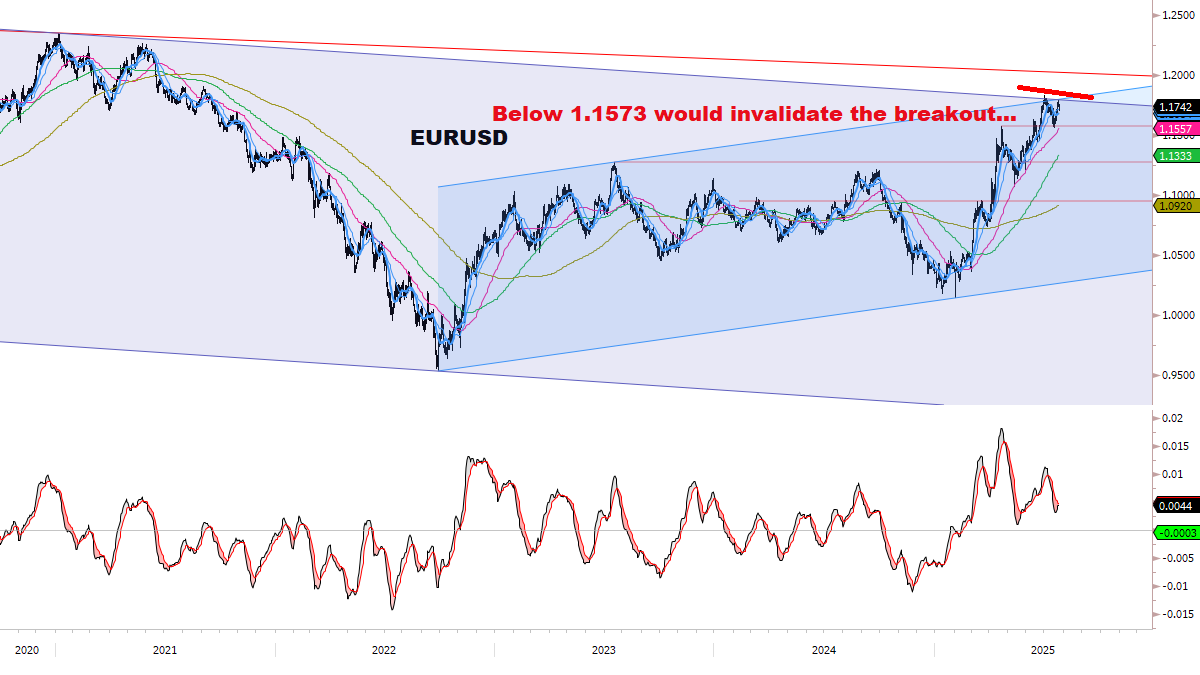
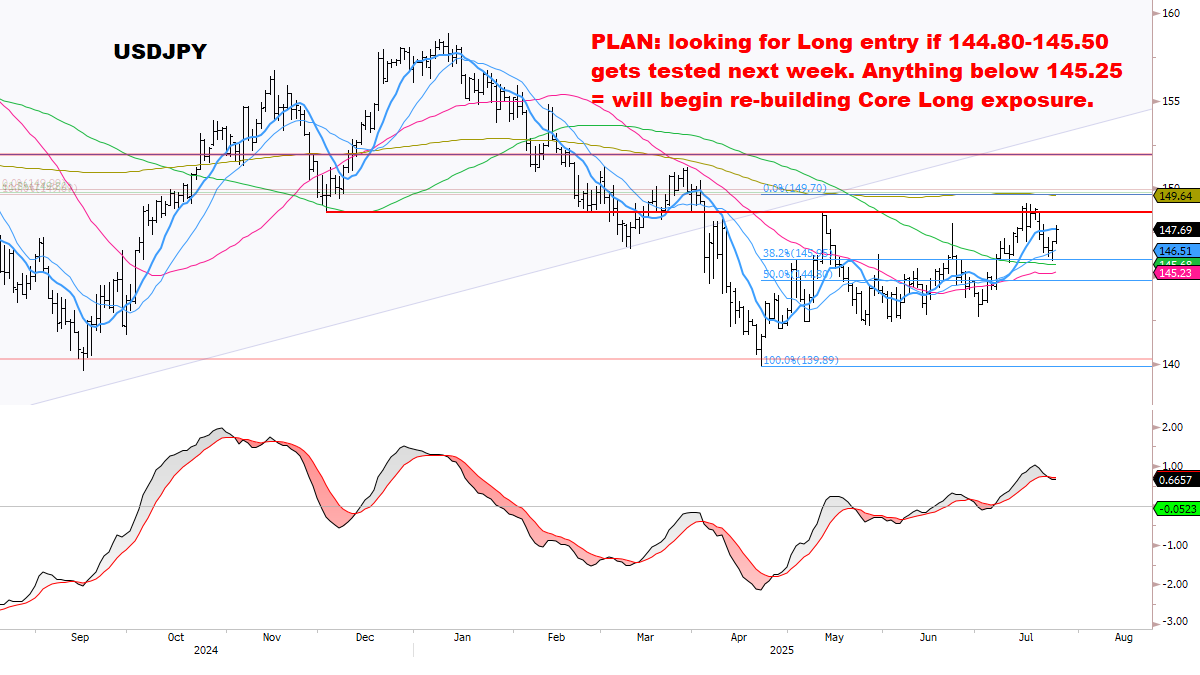
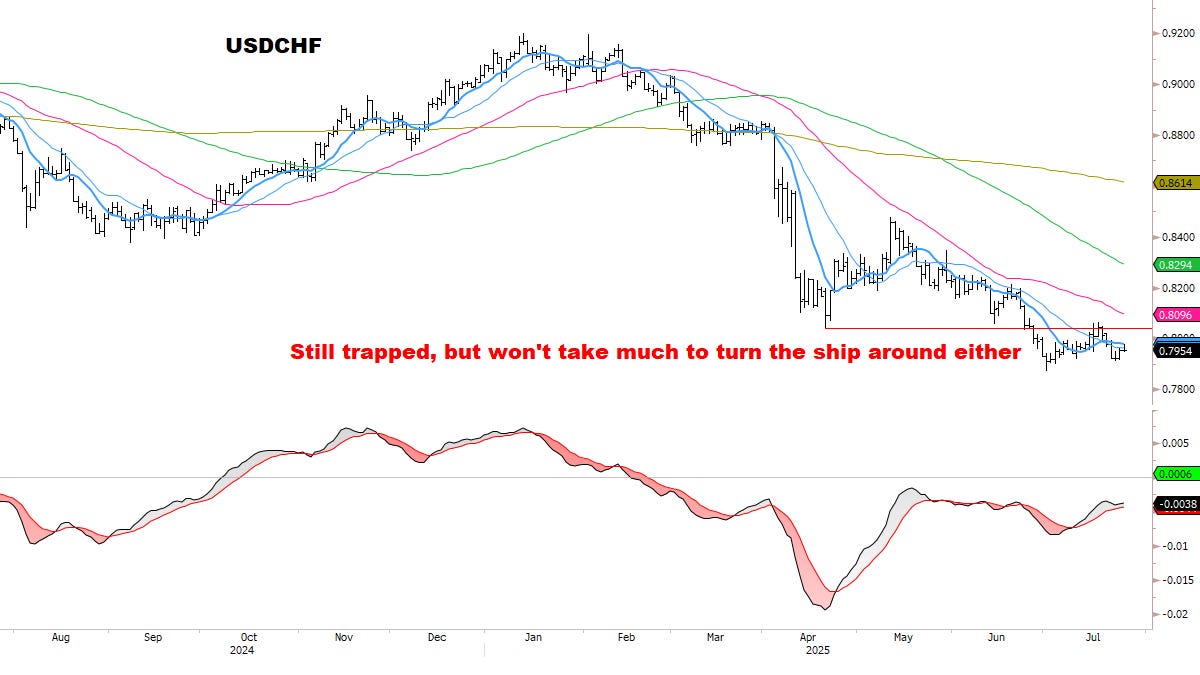
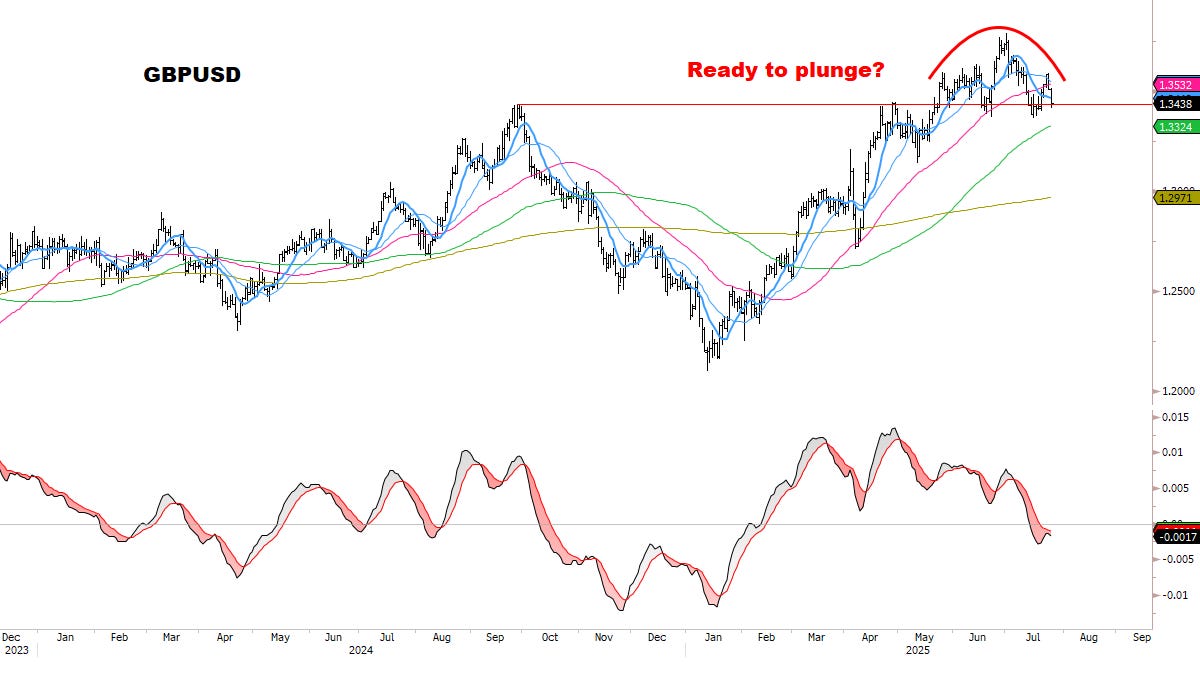
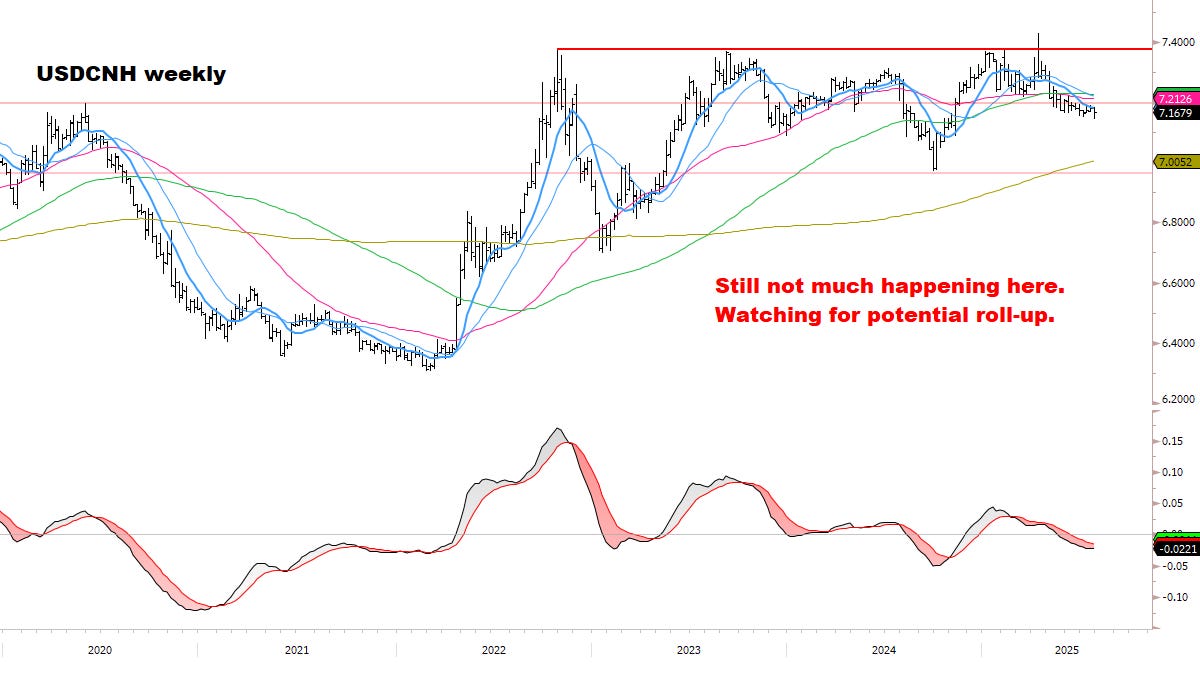
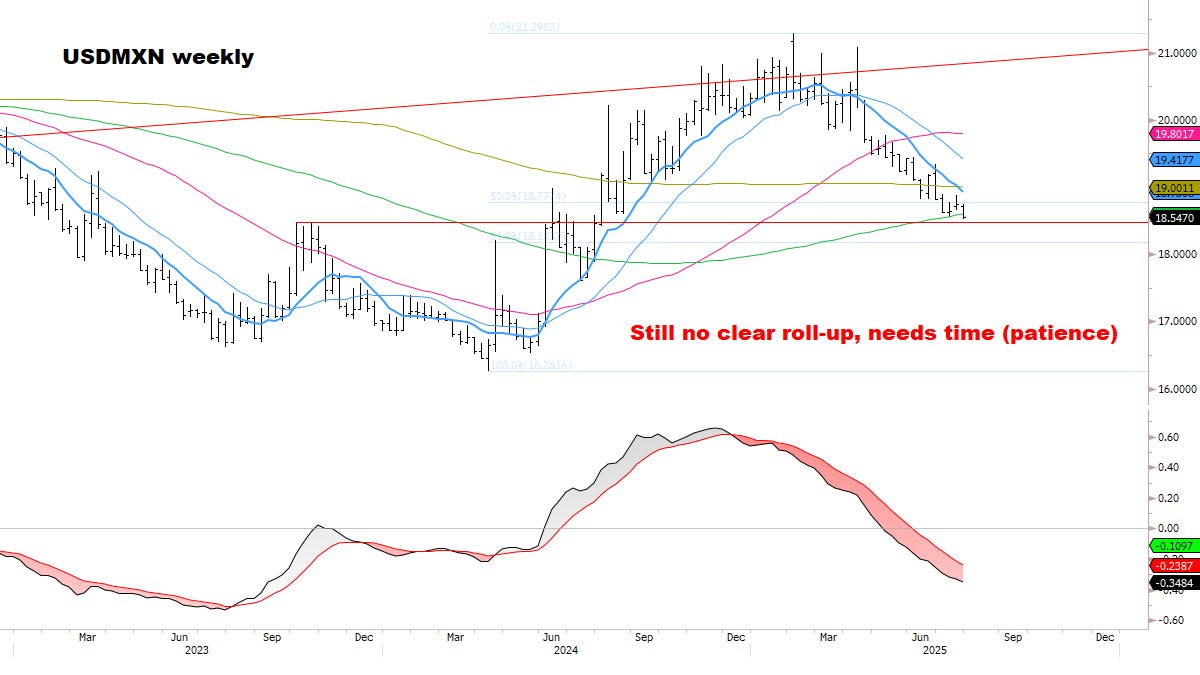
CURRENCIES
Dollar buy signals are accumulating.
Remain focused on the Big Four and looking to get involved:

See you next week — and it promises to be a big one.
Thanks for reading.
Onwards and upwards, -MC
*If you enjoyed this report, likes are much appreciated!
✅ABOUT: macrocharts.com/about.
✅Follow on X: @MacroCharts.
✅Charts viewable in High-Quality format on Web/App:


Copyright © 2025 Macro Charts Substack. All rights reserved.
This proprietary publication is protected by U.S. and International Copyright laws. All rights reserved. No license is granted, except for the subscriber’s personal use. No part of this publication or its contents may be copied, downloaded, transmitted, reproduced, stored, disseminated, transferred, or used, in any form or by any means, except with the prior written permission of Macro Charts Substack. Any further disclosure or use, distribution, dissemination or copying of this publication, message or any attachment is strictly prohibited. No reproduction, retransmission, or other use of the information or images is authorized.
This publication contains statements and statistics that have been obtained from sources believed to be reliable but are not guaranteed as to accuracy or completeness. References to any specific securities or investment advice of any kind do not constitute an offer to buy or sell securities. The past performance of an investment or investment strategy cannot guarantee its future performance. It should not be assumed that such analysis, past or future, will be profitable or will equal past performance or guarantee future performance or trends. All trading and investment decisions are the sole responsibility of the subscriber. Inclusion of information about portfolio changes and other information is not intended as any type of recommendation, nor solicitation.


