

SUMMARY 总结
Deconvolution of regulatory mechanisms that drive transcriptional programs in cancer cells is key to understanding tumor biology. Herein, we present matched transcriptome (scRNA-seq) and chromatin accessibility profiles (scATAC-seq) at single-cell resolution from human ovarian and endometrial tumors processed immediately following surgical resection. This dataset reveals the complex cellular heterogeneity of these tumors and enabled us to quantitatively link variation in chromatin accessibility to gene expression. We show that malignant cells acquire previously unannotated regulatory elements to drive hallmark cancer pathways. Moreover, malignant cells from within the same patients show substantial variation in chromatin accessibility linked to transcriptional output, highlighting the importance of intratumoral heterogeneity. Finally, we infer the malignant cell type-specific activity of transcription factors. By defining the regulatory logic of cancer cells, this work reveals an important reliance on oncogenic regulatory elements and highlights the ability of matched scRNAseq/scATACseq to uncover clinically relevant mechanisms of tumorigenesis in gynecologic cancers.
对驱动癌细胞转录程序的调控机制进行反卷积是理解肿瘤生物学的关键。在此,我们展示了手术切除后立即处理的人卵巢和子宫内膜肿瘤的单细胞分辨率的匹配转录组 (scRNA-seq) 和染色质可及性谱 (scATAC-seq)。该数据集揭示了这些肿瘤复杂的细胞异质性,并使我们能够定量地将染色质可及性的变化与基因表达联系起来。我们表明,恶性细胞获得以前未注释的调节元件来驱动标志性的癌症通路。此外,来自同一患者体内的恶性细胞显示出与转录输出相关的染色质可及性的巨大差异,突出了肿瘤内异质性的重要性。最后,我们推断转录因子的恶性细胞类型特异性活性。通过定义癌细胞的调节逻辑,这项工作揭示了对致癌调节元件的重要依赖,并强调了匹配的 scRNAseq/scATACseq 揭示妇科癌症肿瘤发生的临床相关机制的能力。
Keywords: Single-Cell Genomics, scRNA-seq, scATAC-seq, Endometrial Cancer, Ovarian Cancer, Gastro-Intestinal Stromal Tumors, Intratumoral Heterogeneity, Enhancer Elements
关键字: 单细胞基因组学, scRNA-seq, scATAC-seq, 子宫内膜癌, 卵巢癌, 胃肠道间质瘤, 瘤内异质性, 增强子元件
eTOC blurb eTOC 简介
Regner & Wisniewska et al. present an integrated analysis of single-cell transcriptomics and chromatin accessibility data to define the regulatory logic of malignant cell states in human gynecologic cancers. They identify thousands of salient cancer-specific distal regulatory elements and uncover differential transcription factor activity that drives intratumor heterogeneity.
Regner & Wisniewska 等人提出了对单细胞转录组学和染色质可及性数据的综合分析,以定义人类妇科癌症中恶性细胞状态的调节逻辑。他们确定了数千个突出的癌症特异性远端调节元件,并揭示了驱动肿瘤内异质性的差异转录因子活性。
Graphical Abstract 图形摘要
INTRODUCTION 介绍
Dynamic interactions between various types of malignant and non-malignant cells in solid tumors contributeto a range of biological phenomena, from cancer progression to therapeutic response. Single-cell genomic technologies refined our ability to interrogate the underlying cellular heterogeneity of tumors, but most efforts to date have been limited to transcriptomics via single-cell RNA-seq (scRNA-seq) (Patel et al., 2014, Lambrechts et al., 2018, Slyper et al., 2020, Davidson et al., 2020, Kim et al., 2020, Cochrane et al., 2020). While initial reports have been transformative, it is evident that non-coding regions of the genome, containing regulatory elements (e.g. cis-acting distal enhancer elements), contribute profoundly to tumor biology (Corces et al., 2018). These regulatory elements are often rewired and repurposed by cancer cells to drive oncogenic transcription (Roadmap Epigenomics et al., 2015, Mansour et al., 2014, Zhang et al., 2016, Roe et al., 2017, Corces et al., 2018). Thus, a deeper understanding of the regulatory logic of cancer cells will provide novel insights into the molecular underpinnings of tumor biology and heterogeneity.
实体瘤中各种类型的恶性和非恶性细胞之间的动态相互作用促成了从癌症进展到治疗反应的一系列生物现象。单细胞基因组技术提高了我们询问肿瘤潜在细胞异质性的能力,但迄今为止的大多数工作都仅限于通过单细胞 RNA-seq (scRNA-seq) 的转录组学 ( Patel et al., 2014 , Lambrechts et al., 2018 , Slyper et al., 2020 , Davidson et al., 2020 Cochrane et al., 2020 , Kim et al., 2020 , )。虽然最初的报告具有变革性,但很明显,基因组的非编码区包含调节元件(例如 顺式作用远端增强子元件),对肿瘤生物学做出了深远的贡献 ( Corces et al., 2018 )。这些调节元件通常被癌细胞重新连接和重新利用,以驱动致癌转录 ( Roadmap Epigenomics et al., 2015 , Mansour et al., 2014 , Zhang et al., 2016 Roe et al., 2017 Corces et al., 2018 )。因此,对癌细胞调控逻辑的更深入理解将为肿瘤生物学和异质性的分子基础提供新的见解。
Advancements in the assay for transposase-accessible chromatin at the single cell level (scATAC-seq) enable robust profiling of the chromatin accessibility landscape, unveiling layers of gene regulation including cis-regulatory elements (Buenrostro et al., 2015, Cusanovich et al., 2015). Together, scRNA-seq and scATAC-seq offer unprecedented resolution to reveal complex epigenetic events underlying tumor biology and give potential for the discovery of pathways governing tumorigenesis going beyond the standard taxonomic identification of cell types.
单细胞水平转座酶可及染色质检测 (scATAC-seq) 的进步能够对染色质可及性景观进行稳健分析,揭示基因调控层,包括顺式调节元件 ( Buenrostro et al., 2015 , Cusanovich et al., 2015 )。scRNA-seq 和 scATAC-seq 共同提供了前所未有的分辨率,以揭示肿瘤生物学背后的复杂表观遗传事件,并为发现控制肿瘤发生的途径提供了超越细胞类型标准分类学鉴定的潜力。
Few cancer datasets with matched scRNA-seq and scATAC-seq exist and none have been reported for human gynecologic tumors (Granja et al., 2019). Ovarian cancer (OC) and Endometrial cancer (EC) represent two of the deadliest cancers among women (Siegel et al., 2018). This is partly due to the aggressive nature of these cancers, lack of targeted therapies, and often late-stage of diagnosis. Of note, OC portends a poor prognosis and, although less common than breast cancer, it is three times more lethal (Siegel et al., 2018). EC is the 6th most frequently diagnosed cancer in women globally and is one of few cancers that is rising in mortality (Lortet-Tieulent et al., 2018, Society, 2016, Henley et al., 2018). The Cancer Genome Atlas (TCGA) consortium has proposed molecular subtypes for these cancers, but these stratification systems fail to account for cell type composition and malignant cell heterogeneity within tumors (Cancer Genome Atlas Research, 2011, Cancer Genome Atlas Research et al., 2013). We posit that cell populations within and between patient tumors are delineated by noncoding regulatory elements that drive oncogene expression conferring enhanced proliferation, drug resistance, and/or survival.
很少有具有匹配 scRNA-seq 和 scATAC-seq 的癌症数据集,也没有关于人类妇科肿瘤的报道 ( Granja et al., 2019 )。卵巢癌 (OC) 和子宫内膜癌 (EC) 是女性中最致命的两种癌症 ( Siegel et al., 2018 )。这部分是由于这些癌症的侵袭性、缺乏靶向治疗以及通常处于诊断晚期。值得注意的是,OC 预示着预后不良,虽然不如乳腺癌常见,但它的致命性是乳腺癌的三倍 ( Siegel et al., 2018 )。EC 是全球女性中第 6 大最常被诊断出的癌症,也是死亡率上升的少数癌症之一 ( Lortet-Tieulent et al., 2018 , Society, 2016 Henley et al., 2018 , )。癌症基因组图谱 (TCGA) 联盟提出了这些癌症的分子亚型,但这些分层系统未能解释肿瘤内的细胞类型组成和恶性细胞异质性 ( Cancer Genome Atlas Research, 2011 , Cancer Genome Atlas Research et al., 2013 )。我们假设患者肿瘤内部和之间的细胞群由驱动癌基因表达的非编码调节元件描绘,从而增强增殖、耐药性和/或存活率。
Herein, we present a catalog of matched scRNA-seq and scATAC-seq data for 11 human gynecologic tumors (Table 1, Table S1). This dataset, encompassing over 170,000 single cells, is of broad utility to the fields of single-cell genomics and cancer biology. By analyzing these tumors with matched scRNA-seq and scATAC-seq, we uncover clinically relevant non-coding mechanisms for intratumoral heterogeneity and pathogenesis of EC and OC. We also infer the activity of transcription factors (TFs) that interact with malignant cell type-specific regulatory elements and prioritize TFs based on predicted druggability (Tym et al., 2016, Mitsopoulos et al., 2020, Malladi et al., 2020).
在此,我们提出了 11 种人类妇科肿瘤的匹配 scRNA-seq 和 scATAC-seq 数据目录 ( Table 1 , Table S1 )。该数据集包含超过 170,000 个单细胞,在单细胞基因组学和癌症生物学领域具有广泛的用途。通过使用匹配的 scRNA-seq 和 scATAC-seq 分析这些肿瘤,我们揭示了 EC 和 OC 的瘤内异质性和发病机制的临床相关非编码机制。我们还推断了与恶性细胞类型特异性调节元件相互作用的转录因子 (TFs) 的活性,并根据预测的成药性 ( Tym et al., 2016 , Mitsopoulos et al., 2020 , Malladi et al., 2020 ) 确定 TFs 的优先级。
Table 1. Abbreviated clinical data and single-cell metadata for each patient tumor.
表 1.每个患者肿瘤的简化临床数据和单细胞元数据。
The last two columns reflect the number of cells obtained post QC and in parentheses the total number of cells estimated by Cell Ranger. Asterisks in the Tumor site column denote a metastatic event. Race column abbreviations: African American (AA), Caucasian (CAU), Asian (AS). Extended clinical data for each patient (de-identified) can be found in Table S1.
最后两列反映 QC 后获得的细胞数,括号中为 Cell Ranger 估计的细胞总数。Tumor site (肿瘤部位 ) 列中的星号表示转移事件。 种族列缩写:非裔美国人 (AA)、高加索人 (CAU)、亚洲人 (AS)。每位患者(去标识化)的扩展临床数据可在 中找到 Table S1 。
| Patient 病人 | Cancer type 癌症类型 | Tumor site 肿瘤部位 | Histology 组织学 | Stage 阶段 | Age 年龄 | Race 比赛 | BMI | scATAC-seq cells scATAC-seq 细胞 | scRNA-seq cells |
|---|---|---|---|---|---|---|---|---|---|
| Patient 1 患者 1 | Endometrial 子宫内膜的 | Endometrium 子宫内膜 | Endometrioid 子宫内膜样 | IA | 70 | AA | 39.89 | 6,348 (6,649) | 5,279 (5,697) |
| Patient 2 患者 2 | Endometrial 子宫内膜的 | Endometrium 子宫内膜 | Endometrioid 子宫内膜样 | IA | 70 | CAU | 30.50 | 7,248 (6,658) | 7,277 (7,963) |
| Patient 3 患者 3 | Endometrial 子宫内膜的 | Endometrium 子宫内膜 | Endometrioid 子宫内膜样 | IA | 70 | CAU | 38.55 | 4,165 (7,241) | 4,974 (6,054) |
| Patient 4 患者 4 | Endometrial 子宫内膜的 | Endometrium 子宫内膜 | Endometrioid 子宫内膜样 | IA | 49 | CAU | 55.29 | 7,597 (7,917) | 7,413 (8,110) |
| Patient 5 患者 5 | Endometrial 子宫内膜的 | Endometrium 子宫内膜 | Endometrioid 子宫内膜样 | IA | 62 | CAU | 49.44 | 6,797 (7,881) | 7,291 (8,403) |
| Patient 6 病人 6 | Endometrial 子宫内膜的 | Ovary*** 卵巢*** | Serous 浆膜 | IIIA | 74 | CAU | 29.94 | 6,643 (2,351) | 6,866 (8,009) |
| Patient 7 病人 7 | Ovarian 卵巢 | Ovary 卵巢 | Endometrioid 子宫内膜样 | IA | 76 | CAU | 34.80 | 5,924 (7,107) | 6,454 (8,295) |
| Patient 8 病人 8 | Ovarian 卵巢 | Ovary 卵巢 | HGSOC | IIB | 61 | CAU | 22.13 | 8,014 (7,898) | 7,454 (8,181) |
| Patient 9 病人 9 | Ovarian 卵巢 | Ovary 卵巢 | HGSOC | IIIC | 59 | AS | 22.37 | 9,670 (9,942) | 6,192 (6,939) |
| Patient 10 患者 10 | Ovarian 卵巢 | Ovary 卵巢 | Carcinosarcoma 肉瘤 | IVB | 69 | CAU | 23.72 | 4,439 (8,977) | 7,663 (8,984) |
| Patient 11 病人 11 | Gastric 胃的 | Ovary*** 卵巢*** | GIST | IV | 59 | CAU | 33.96 | 7,776 (11,066) | 8,660 (10,094) |
RESULTS 结果
Matched scRNA-seq and scATAC-seq of human gynecologic tumors
匹配的人妇科肿瘤的 scRNA-seq 和 scATAC-seq
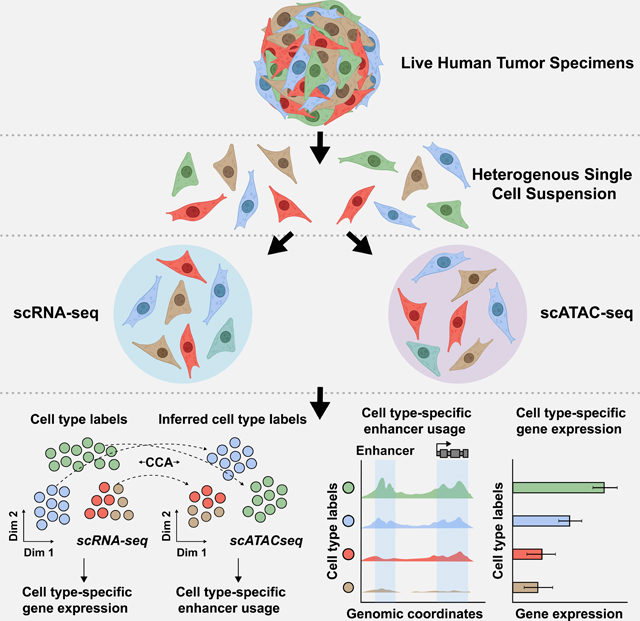
Eleven, treatment naïve, patients underwent debulking surgery with curative intent to remove tumors found either in the endometrium or ovary (Table 1, Table S1). Following surgical resection, each tumor was dissociated into a suspension of live cells and prepped for lipid droplet-based scRNA-seq and scATAC-seq (Figure 1A and STAR Methods). Tumor specimens where never frozen or fixed in any way, enabling high levels of cell viability and robust sequencing coverage in single cells. All tumors were primary tumors except for Patient 6, diagnosed as an EC that metastasized to the ovary, and Patient 11, diagnosed as a gastro-intestinal stromal tumor (GIST) that metastasized to the ovary. After quality control and doublet removal for each patient dataset (STAR Methods), we obtained 75,523 cells profiled by scRNA-seq and 74,621 cells profiled by scATAC-seq.
11 名初治患者接受了减瘤手术,目的是切除在子宫内膜或卵巢中发现的肿瘤 ( Table 1 , Table S1 )。手术切除后,将每个肿瘤解离成活细胞悬液,并准备用于基于脂滴的 scRNA-seq 和 scATAC-seq ( Figure 1A 和 STAR Methods )。肿瘤标本从未以任何方式冷冻或固定,从而在单细胞中实现高水平的细胞活力和强大的测序覆盖度。除患者 6 诊断为转移至卵巢的 EC 和患者 11 诊断为转移至卵巢的胃肠道间质瘤 (GIST) 外,所有肿瘤均为原发性肿瘤。在对每个患者数据集进行质量控制和双峰去除后 ( STAR Methods ),我们获得了 scRNA-seq 分析的 75,523 个细胞和 scATAC-seq 分析的 74,621 个细胞。
Figure 1. Overview of matched scRNA-seq and scATAC-seq workflow for patient tumors.
图 1.患者肿瘤的匹配 scRNA-seq 和 scATAC-seq 工作流程概述。

A) Cartoon showing patient tumor workflow. The female reproductive system cartoons, top, were created with BioRender.com.
A) 显示患者肿瘤工作流程的卡通片。女性生殖系统卡通片( 上图 )是用 BioRender.com 创作的。
B) UMAP plot all scRNA-seq cells color-coded by cell type across 11 patient tumors (left). UMAP plot of all scATAC-seq cells color-coded by inferred cell type across 11 patient tumors (right).Color shades denote subclusters within each cell type.
B) UMAP 绘制 11 个患者肿瘤中按细胞类型进行颜色编码的所有 scRNA-seq 细胞( 左 )。11 例患者肿瘤中按推断细胞类型进行颜色编码的所有 scATAC-seq 细胞的 UMAP 图( 右 )。颜色阴影表示每种细胞类型中的子聚类。
C) UMAP plot of scRNA-seq cells (left) and scATAC-seq cells (right) as shown in panel B but color-coded by patient of origin.
C) scRNA-seq 细胞( 左 )和 scATAC-seq 细胞( 右 )的 UMAP 图,如图 B 所示,但按原籍患者进行颜色编码。
D) Stacked bar charts showing contribution of each patient to each subcluster in scRNA-seq (left) and to each inferred cell type subcluster in scATAC-seq (right).
D) 堆叠条形图,显示每位患者对 scRNA-seq 中每个子簇( 左 )和 scATAC-seq 中每个推断细胞类型子簇( 右 )的贡献。
To analyze scRNA-seq cells from the entire cohort, we performed principal component analysis (PCA) using the top 2,000 most variably expressed genes across all 75,523 cells. Cells were classified into transcriptionally-distinct clusters with graph-based clustering using the top 50 principal components (PCs) and visualized using a Uniform Manifold Approximation and Projection (UMAP) plot. This revealed that clusters could be annotated to known cell types (Aran et al., 2019) (Figure 1B [left],
Figure S1A, Table S2, and STAR Methods) and batch effects were not a major confounder (Figure 1C, left). To identify malignant clusters across the entire cohort, we used clinical biomarker gene expression and inferred copy number amplification/deletion events (Figures S2-S4). We used expression of FDA approved biomarkers, MUC16/CA125 and WFDC2/HE4, to identify EC and OC cancer clusters (Duffy et al., 2005, Sturgeon et al., 2008, Hellström et al., 2003, Li et al., 2009, Dong et al., 2017). Expression of KIT/CD117 was used to identify GIST cancer clusters (Sarlomo-Rikala et al., 1998). Inferred copy number variation was used to help identify OC and GIST, but not EC since the disease rarely exhibits copy number variation (Berger et al., 2018).
为了分析来自整个队列的 scRNA-seq 细胞,我们使用所有 75,523 个细胞中表达最多的 2,000 个基因进行了主成分分析 (PCA)。使用前 50 个主成分 (PC) 通过基于图形的聚类将细胞分类为转录不同的簇,并使用统一流形近似和投影 (UMAP) 图进行可视化。这表明簇可以注释到已知的细胞类型 ( Aran et al., 2019 ) ( Figure 1B [ 左], Figure S1A , Table S2 和 STAR Methods ),并且批次效应不是主要的混杂因素 ( Figure 1C , 左 )。为了识别整个队列中的恶性集群,我们使用了临床生物标志物基因表达和推断的拷贝数扩增/缺失事件 ( Figures S2 - S4 )。我们使用 FDA 批准的生物标志物 MUC16/CA125 和 WFDC2/HE4 的表达来识别 EC 和 OC 癌症集群 ( Duffy et al., 2005 , Sturgeon et al., 2008 , Hellström et al., 2003 , Li et al., 2009 Dong et al., 2017 , )。KIT/CD117 的表达用于识别 GIST 癌簇 ( Sarlomo-Rikala et al., 1998 )。推断的拷贝数变异用于帮助识别 OC 和 GIST,但不是 EC,因为该疾病很少表现出拷贝数变异 ( Berger et al., 2018 )。
To analyze scATAC-seq cells from the entire cohort, we created a matrix of contiguous genomic tiles, across the genome, in which we quantified fragment counts. We performed iterative latent semantic indexing on the top 25,000 most variable genomic tiles (Cusanovich et al., 2015, Satpathy et al., 2019, Granja et al., 2021). To assign cell type cluster labels from matching scRNA-seq data to scATAC-seq cells, we used the Seurat v3 cross-modality integration approach (constrained to cells of the same patient tumor) (Figure 1B [right],
Figure S1, Table S3, and STAR Methods) (Stuart et al., 2019). This revealed scATAC-seq cells that clustered mainly by cell type and not by patient, highlighting the quality of the dataset (Figure 1C, right).
为了分析来自整个队列的 scATAC-seq 细胞,我们创建了一个跨基因组的连续基因组切片矩阵,其中我们量化了片段计数。我们对前 25,000 个最可变的基因组切片 ( Cusanovich et al., 2015 , Satpathy et al., 2019 , Granja et al., 2021 ) 进行了迭代潜在语义索引。为了将来自匹配 scRNA-seq 数据的细胞类型簇标签分配给 scATAC-seq 细胞,我们使用了 Seurat v3 跨模态整合方法(仅限于同一患者肿瘤的细胞)( Figure 1B [ 右 ] Figure S1 、 Table S3 和 STAR Methods )( Stuart et al., 2019 )。这揭示了主要按细胞类型而不是患者聚集的 scATAC-seq 细胞,突出了数据集的质量( Figure 1C , 右 )。
Overall, we found ten general cell types in the entire cohort with 36 subclusters present in both modalities. Although these subclusters vary in size, immune subclusters contain roughly equal proportions of cells across all patients, while malignant and fibroblast subclusters remain highly patient-specific (Figure 1D, Figures S5-S6). This is partly reflected by the uniqueness of each inferred CNV profile from each tumor (Figures S2-S3). Our observations are consistent with previous scRNA-seq reports in OC (Izar et al., 2020), lung cancer (Lambrechts et al., 2018), and nasopharyngeal cancer (Chen et al., 2020). These patterns likely reflect biological overlap of non-malignant cells across all patients and highlight the unique, and possibly tractable, biological features of malignant cells within each tumor.
总体而言,我们在整个队列中发现了 10 种一般细胞类型,两种模式都存在 36 个亚簇。尽管这些亚簇的大小各不相同,但免疫亚簇在所有患者中包含大致相等比例的细胞,而恶性和成纤维细胞亚簇仍然具有高度的患者特异性 ( Figure 1D , Figures S5 - S6 )。这部分反映在从每个肿瘤推断的每个 CNV 谱 ( Figures S2 - S3 ) 的唯一性上。我们的观察结果与之前在 OC ( Izar et al., 2020 )、肺癌 ( Lambrechts et al., 2018 ) 和鼻咽癌 ( ) 中的 scRNA-seq 报告一致 Chen et al., 2020 。这些模式可能反映了所有患者非恶性细胞的生物学重叠,并突出了每个肿瘤内恶性细胞的独特且可能易于处理的生物学特征。
Systematic discovery of cancer-specific distal regulatory elements (dREs) in human gynecologic cancers
在人类妇科癌症中系统发现癌症特异性远端调节元件 (dRE)
We next explored the chromatin landscape to identify distal regulatory elements that could help explain distinct biological states of these malignant cells. To identify putative regulatory elements across all scATAC-seq cells, we first carried out peak calling within each cell type subcluster and used an iterative overlap peak merging procedure to generate a peak-by-cell matrix (Zhang et al., 2008, Granja et al., 2021, Liu, 2014, Corces et al., 2018). In order to link variation in chromatin accessibility to differences in gene expression, we executed a large-scale peak-to-gene linkage analysis and developed a robust empirical false discovery rate (eFDR) procedure for determining statistically significant peak-to-gene associations in single-cell data (STAR Methods) (Granja et al., 2021, Storey and Tibshirani, 2003).
接下来,我们探索了染色质景观,以确定有助于解释这些恶性细胞的不同生物状态的远端调节元件。为了确定所有 scATAC-seq 细胞中推定的调节元件,我们首先在每个细胞类型子簇内进行峰调用,并使用迭代重叠峰合并程序生成逐个细胞的峰矩阵 ( Zhang et al., 2008 , Granja et al., 2021 , Liu, 2014 Corces et al., 2018 , )。为了将染色质可及性的变化与基因表达的差异联系起来,我们进行了大规模的峰到基因连锁分析,并开发了一种稳健的经验错误发现率 (eFDR) 程序,用于确定单细胞数据中具有统计学意义的峰与基因关联 ( STAR Methods ) ( Granja et al., 2021 , Storey and Tibshirani, 2003 )。
Briefly, we aggregated the sparse peak counts within groups of similar scATAC-seq cells, identified via k-nearest neighbors, to generate more informative metacell observations for our peak-to-gene correlation analysis. We then used the scATAC-seq metacells (i.e. aggregates of similar cells) to compute the correlation between accessibility of every peak and expression of every gene in cis, imputed for each scATAC-seq cell (STAR Methods). This peak-to-gene correlation analysis resulted in 2,748,906 peak-to-gene combinations in cis (Figure 2A [top], Figure S7A [top]). To estimate the eFDR, we selected a raw p-value threshold of 1e-12 and recorded the number of observed peak-to-gene associations with a raw p-value ≤ 1e-12 (see STAR Methods). The peak-to-gene correlation analysis was repeated 100 times under the permuted null condition where, for each permutation, we shuffled scATAC-seq metacell labels to break the link between peak accessibility and gene expression (Figure 2A [bottom], Figure S7A [bottom]). For every permutation, there was less correlation between peak-to-gene pairs compared to observed data and the raw p-value distribution was near uniform. The eFDR was then calculated by dividing the median number of null peak-to-gene associations with a raw pvalue ≤ 1e-12 by the number of observed associations with a raw p-value ≤ 1e-12. These data highlight the genuine biological relationships between peak accessibility and gene expression in the observed data (Figure 2A, Figure S7, and STAR Methods).
简而言之,我们汇总了通过 k 最近邻鉴定的相似 scATAC-seq 细胞组内的稀疏峰值计数,以便为我们的峰与基因相关性分析生成更多信息丰富的元细胞观察结果。然后,我们使用 scATAC-seq 元细胞(即相似细胞的聚集体)来计算每个峰的可及性与顺式中每个基因的表达之间的相关性,为每个 scATAC-seq 细胞估算 ( STAR Methods )。该峰-基因相关性分析得出 2,748,906 个顺式峰-基因组合 ( Figure 2A [top], Figure S7A [top])。为了估计 eFDR,我们选择了 1e-12 的原始 p 值阈值,并记录了观察到的与原始 p 值≤ 1e-12 的峰与基因关联的数量(参见 STAR Methods )。在置换零条件下重复峰-基因相关性分析 100 次,其中,对于每个排列,我们洗牌 scATAC-seq 元细胞标签以打破峰可及性和基因表达之间的联系 ( Figure 2A [ 底部 ], Figure S7A [ 底部 ])。对于每种排列,与观察到的数据相比,峰-基因对之间的相关性较低,原始 p 值分布几乎均匀。然后通过将原始 p 值≤ 1e-12 的零峰-基因关联的中位数除以观察到的原始 p 值≤ 1e-12 的关联数来计算 eFDR。这些数据突出了观察到的数据中峰可及性和基因表达之间的真实生物学关系( Figure 2A 、 和 Figure S7 STAR Methods )。
Figure 2. Systematic in silico identification of cancer-specific distal regulatory elements.
图 2.系统地进行癌症特异性远端调节元件的计算机识别。

A) Cartoon showing peak-to-gene correlation analysis with an eFDR (top).Histograms of correlation values and raw p-values for n=2,748,906 peak-to-gene link tests (middle) and peak-to-gene link tests under the null condition (bottom). Dashed red lines represent the alpha threshold or raw p-value cutoff of 1e-12 for calling statistically significant peak-to-gene links.
A) 漫画显示了使用 eFDR( 上图 )进行峰-基因相关性分析。n=2,748,906 个峰-基因连接测试( 中间 )和零条件下的峰-基因连接测试( 底部 )的相关值和原始 p 值的直方图。红色虚线表示 1e-12 的 alpha 阈值或原始 p 值截止值,用于调用具有统计学意义的峰到基因连接。
B) Row-scaled heatmaps of statistically significant distal peak-to-gene links. Each row represents expression of a gene (left) correlated to accessibility of a distal peak (right). Cancer-enriched k-means clusters are marked in red. Distal peaks participating in cancer-enriched k-means groups are used in the overlap analysis presented in panel C.
B) 具有统计学意义的远端峰到基因链接的行刻度热图。每行代表一个基因的表达( 左图),与远端峰的可及性( 右图)相关。富含癌症的 k-means 簇标记为红色。参与癌症富集 k-means 组的远端峰用于图 C 中呈现的重叠分析。
C) Venn diagram showing the number of cancer-specific distal peaks (orange) after overlapping the genomic coordinates of cancer-enriched distal peaks with the genomic coordinates of normal ovarian surface epithelium enhancer elements, normal fallopian tube enhancer elements, and all ENCODE regulatory element annotations (gray).
C) 维恩图显示癌症富集远端峰的基因组坐标与正常卵巢表面上皮增强子元件、正常输卵管增强子元件和所有 ENCODE 调节元件注释( 灰色 )重叠后癌症特异性远端峰的数量( 橙色 )。
D) Bar charts comparing proportion of distal peaks per number of linked genes between cancer-specific (orange) and normal (gray) distal peak groups (left).Bar chart comparing mean number of linked genes per distal peak between cancer-specific (orange) and normal (gray) distal peak groups (right). Asterisks denote a statistically significant difference (Wilcoxon Rank Sum test). Error bars represent ±1 S.E.M.
D) 比较癌症特异性( 橙色 )和正常( 灰色 )远端峰组( 左 )之间每数连锁基因的远端峰比例的条形图。比较癌症特异性( 橙色 )和正常( 灰色 )远端峰组( 右) 之间每个远端峰的平均连锁基因数的条形图。星号表示统计上显著的差异(Wilcoxon Rank Sum 检验)。误差线表示 ±1 S.E.M.
E) Browser track showing the accessibility profile at the RHEB locus across all malignant subclusters (orange) and select non-malignant subclusters (gray) (left). Putative cancer-specific dREs for RHEB are highlighted by light blue shadows. Matching scRNA-seq expression of RHEB is shown for each subcluster (middle). Asterisks denote a statistically significant difference in gene expression between cells in the 3-Ovarian cancer subcluster and all remaining subclusters (average logFC > 1.0 & Bonferroni-corrected p-value <0.01, Wilcoxon Rank Sum test). Relative expression of mTOR pathway members is shown in the box plot (right). Asterisks denote statistically significant differences in mTOR pathway expression across all subclusters (Kruskal-Wallis test, p-value <0.01). Known regulatory element annotations, as used in panel C, are shown below the browser track. Peak-to-gene loops show the correlation value between peak accessibility and RHEB expression (bottom).
E) 浏览器轨迹显示所有恶性亚簇( 橙色 )和选择非恶性亚簇( 灰色 )( 左 )的 RHEB 基因座的可及性概况。RHEB 的推定癌症特异性 dRE 以浅蓝色阴影突出显示。显示了每个子簇 ( 中间 ) 的 RHEB 的匹配 scRNA-seq 表达。星号表示在 3-卵巢癌子集群和所有剩余子集群(平均 logFC > 1.0 & Bonferroni 校正的 p 值<0.01,Wilcoxon 秩和检验)中细胞表达的统计学显著差异。mTOR 通路成员的相对表达如箱线图( 右) 所示。星号表示所有亚簇中 mTOR 通路表达的统计学显着差异(Kruskal-Wallis 检验,p 值 <0.01)。面板 C 中使用的已知调节元件注释显示在浏览器轨道下方。峰到基因环显示了峰可及性与 RHEB 表达之间的相关性值( 底部 )。
F) Kaplan-Meier survival curve based on progression-free survival for 614 OC patients stratified by high and low RHEBexpression.
F) Kaplan-Meier 生存曲线基于 614 名 OC 患者的无进展生存期,按高 RHEB 表达和低表达分层。
The peak-to-gene correlation analysis revealed 345,791 statistically significant peak-togene links (p-value ≤ 1e-12 with eFDR=0.00014) (Data S1). To identify positive regulatory effects (i.e. positive correlation between peak accessibility and gene expression), we focused on peak-to-gene links with a correlation ≥ 0.45 (n=133,811). Most of these peak-to-gene links involved intronic peaks (50.2%) and distal peaks (28.3%). Promoter and exonic peak-to-gene links were lowest among this set (11.3% and 10.2%, respectively) (Figure S7D). To unveil distal regulatory mechanisms active within these gynecologic tumors, we proceeded with the 37,833 distal peak-to-gene links in our downstream analyses (Data S1). We further categorized peak-to-gene links into 36 k-means clusters and observed highly consistent patterns between inferred gene expression and linked peak accessibility (Figure 2B). We refer to these linked distal peaks as putative distal regulatory elements (dREs). The majority of identified dREs are annotated by the Encyclopedia of DNA Elements Consortium (ENCODE), providing support for our computational approach and suggesting they are bona fide regulatory elements (Consortium, 2012, Consortium et al., 2020).
峰-基因相关性分析显示 345,791 个具有统计学意义的峰-基因链接 (p 值≤ 1e-12,eFDR=0.00014) ( Data S1 )。为了确定正调节作用 (即峰可及性与基因表达之间的正相关),我们专注于相关性≥ 0.45 (n=133,811) 的峰与基因联系。这些峰到基因的联系大多涉及内含子峰 (50.2%) 和远端峰 (28.3%)。启动子和外显子峰-基因连接在这组中最低(分别为 11.3% 和 10.2%)( Figure S7D )。为了揭示在这些妇科肿瘤中活跃的远端调节机制,我们在下游分析中进行了 37,833 个远端峰到基因链接 ( Data S1 )。我们进一步将峰与基因的联系分类为 36 个 k-means 簇,并观察到推断的基因表达和连接的峰可及性之间高度一致的模式 ( Figure 2B )。我们将这些连接的远端峰称为推定的远端调节元件 (dRE)。大多数已鉴定的 dRE 都由 DNA 元素百科全书联盟 (ENCODE) 注释,为我们的计算方法提供支持,并表明它们是真正的调节元件 ( Consortium, 2012 , Consortium et al., 2020 )。
To identify dREs specific to cancer cells across all patients, we extracted distal peaks from cancer-enriched k-means groups and carried out a genomic interval overlap analysis with epigenomic profiles from non-cancer tissues (Figure 2C, Figure S8A-E). We overlapped the genomic coordinates of our 14,043 cancer-enriched distal peaks with putative enhancer elements (defined by H3K27ac) active in cell lines derived from normal ovarian surface epithelium and normal fallopian tube secretory epithelium tissue (Coetzee et al., 2015). We also screened against all existing ENCODE regulatory elements (Consortium et al., 2020). The overlap analysis revealed 3,688 distal peaks that are not present in normal ovarian surface epithelium, normal fallopian tube secretory epithelium, nor the ENCODE database. Thus, these 3,688 distal peaks, participating in 5,827 peak-to-gene links, represent cancer-specific dREs (Data S1). The remaining distal peaks (n=22,166) represent regulatory elements that are active in normal tissue.
为了确定所有患者对癌细胞具有特异性的 dRE,我们从富含癌症的 k-means 组中提取远端峰,并与来自非癌组织的表观基因组图谱进行了基因组间隔重叠分析 ( Figure 2C , Figure S8A - E )。我们将 14,043 个富含癌症的远端峰的基因组坐标与源自正常卵巢表面上皮和正常输卵管分泌上皮组织的细胞系中活跃的推定增强子元件(由 H3K27ac 定义)重叠 ( Coetzee et al., 2015 )。我们还筛选了所有现有的 ENCODE 监管元件 ( Consortium et al., 2020 )。重叠分析揭示了 3,688 个远端峰,这些峰不存在于正常卵巢表面上皮、正常输卵管分泌上皮和 ENCODE 数据库中。因此,这 3,688 个远端峰参与 5,827 个峰到基因的联系,代表癌症特异性 dRE ( Data S1 )。其余远端峰 (n=22,166) 代表在正常组织中活跃的调节元件。
To further characterize cancer-specific dREs, we quantified the linked target genes per distal peak in both cancer-specific and normal peak groups. Strikingly, the cancer-specific peaks link to more genes (mean=1.58) compared to the non-malignant peaks (mean=1.44) (Wilcoxon Rank Sum test, p-value=1.6e-05) (Figure 2D, Figure S8F-I). Previous studies have proposed similar estimates of the number of putative target genes per dRE and we anticipate this difference to be magnified in a larger group of patients (Mills et al., 2020, Moore et al., 2020, Corces et al., 2018).
为了进一步表征癌症特异性 dREs,我们量化了癌症特异性峰组和正常峰组中每个远端峰的连锁靶基因。引人注目的是,与非恶性峰 (平均值 = 1.44) 相比,癌症特异性峰与更多的基因 (平均值 = 1.58) 相关联 ( Figure 2D , - ) ( , )。 I Figure S8F 以前的研究已经对每个 dRE 的推定靶基因数量提出了类似的估计,我们预计这种差异会在更大的患者群体中被放大 ( Mills et al., 2020 , Moore et al., 2020 , Corces et al., 2018 )。
We found many salient instances of cancer-specific dREs linked to upregulated genes in malignant cell populations measured by scRNA-seq (Data S1). For example, the hallmark mTOR pathway regulator RHEB is significantly upregulated in the subcluster labeled as 3-Ovarian cancer, that comes from Patient 7 diagnosed with endometrioid OC (Figure 2E, Table 1, Table S1) (Yang et al., 2017). This subcluster of malignant cells also shows positive enrichment for the mTOR pathway gene signature (Liberzon et al., 2015) (see STAR Methods) (Kruskal-Wallis test, p-value <0.01). We found strong chromatin accessibility signal at the RHEB promoter across all malignant populations, but we highlight the marked increases in accessibility of four cancer-specific dREs enriched in the 3-Ovarian cancer subcluster (Figure 2E). Together, this offers a possible mechanism for mTOR pathway dysregulation through oncogenic dREs enriched in malignant cells of endometrioid OC. Indeed, high RHEB expression is prognostic of worse outcome in OC patients (Figure 2F and Table S4) (Gyorffy et al., 2012).
我们发现了许多癌症特异性 dRE 的显着实例,这些 dRE 与通过 scRNA-seq 测量的恶性细胞群中的上调基因有关 ( Data S1 )。例如,标志性的 mTOR 通路调节因子 RHEB 在标记为 3-卵巢癌的亚簇中显著上调,该亚簇来自诊断为子宫内膜样 OC 的患者 7 ( Figure 2E , Table 1 , Table S1 ) ( Yang et al., 2017 )。该恶性细胞亚簇也显示 mTOR 通路基因特征 ( Liberzon et al., 2015 ) 的阳性富集 ( ) (参见 ) (Kruskal-Wallis STAR Methods 检验,p 值 <0.01)。我们在所有恶性人群的 RHEB 启动子处发现了强烈的染色质可及性信号,但我们强调了在 3-卵巢癌亚簇中富集的四种癌症特异性 dRE 的可及性显着增加 ( Figure 2E )。总之,这提供了一种可能的机制,通过子宫内膜样 OC 恶性细胞中富集的致癌 dRE 导致 mTOR 通路失调。事实上,高 RHEB 表达预示着 OC 患者预后较差 ( Figure 2F 和 Table S4 ) ( Gyorffy et al., 2012 )。
Our eFDR peak-to-gene linkage and genomic interval overlap analyses revealed additional putative cancer-specific dREs for clinical biomarkers CA125 andCD117 in EC/OC and GIST, respectively (Data S1). These genes are also predictive of poor survival in OC and gastric cancer, respectively (Table S4). Together with our findings for RHEB, this suggests that molecular rewiring of dREs play critical roles in the pathogenesis of gynecologic malignancies and have important clinical implications (Gyorffy et al., 2012, Szasz et al., 2016).
我们的 eFDR 峰-基因连锁和基因组间隔重叠分析揭示了 EC/OC 和 GIST 中临床生物标志物 CA125 和 CD117 的额外推定癌症特异性 dREs ( Data S1 )。这些基因也分别预测 OC 和胃癌的生存率差 ( Table S4 )。结合我们对 RHEB 的研究结果,这表明 dRE 的分子重新布线在妇科恶性肿瘤的发病机制中起关键作用,具有重要的临床意义 ( Gyorffy et al., 2012 , Szasz et al., 2016 )。
To transition from the full cohort analysis into cancer-type specific analyses, and identify even finer transcriptomic and epigenomic differences, we performed pseudo-bulk clustering analysis (Kimes et al., 2017) (STAR Methods). This analysis revealed two groups of patient tumors that were conserved across data types: Patients 1–5 (endometrioid endometrial cancer (EEC)) and Patients 8 & 9 (high-grade serous ovarian cancer (HGSOC)). These groupings reflect the original histological classifications in Table 1. Interestingly, tumors from Patient 6 and Patient 10 are more similar to the HGSOC tumors in terms of pseudo-bulk RNA-seq, but are more similar to EEC tumors in terms of pseudo-bulk ATAC-seq (Figure S9).
为了从完整的队列分析过渡到癌症类型特异性分析,并确定更精细的转录组学和表观基因组学差异,我们进行了伪批量聚类分析 ( Kimes et al., 2017 ) ( STAR Methods )。该分析揭示了两组跨数据类型保守的患者肿瘤:患者 1-5 (子宫内膜样子宫内膜癌 (EEC)) 和患者 8 & 9 (高级别浆液性卵巢癌 (HGSOC))。这些分组反映了 中的 Table 1 原始组织学分类。有趣的是,患者 6 和患者 10 的肿瘤在假大体 RNA-seq 方面与 HGSOC 肿瘤更相似,但在假大量 ATAC-seq 方面更类似于 EEC 肿瘤 ( Figure S9 )。
Cancer-specific regulatory mechanisms in Endometrioid Endometrial Cancer
子宫内膜样子宫内膜癌的癌症特异性调节机制
EC is the most common gynecologic malignancy in the United States and the endometrioid histologic type accounts for a majority of cases (Siegel et al., 2021, Ritterhouse and Howitt, 2016). To analyze the EEC patient cohort, we merged all cells from Patients 1–5, resulting in 32,234 cells profiled by scRNA-seq and 32,155 cells profiled by scATAC-seq (STAR Methods). We found that cells clustered mainly by cell type and not by patient, suggesting batch effects were not a major confounder (Figure 3A-B, Figure S10). Overall, we observed eight general cell types across Patients 1–5 with 29 subclusters in scRNA-seq and 28 subclusters in scATAC-seq. In scATAC-seq, the 20-Fibroblast subcluster had only 10 cells and was therefore removed from downstream analysis. We next screened for malignant subclusters using the EC biomarkers MUC16/CA125 and WFDC2/HE4 (Figure S11) (Dong et al., 2017, Li et al., 2009). Again, we observed that fibroblast/stromal and EC subclusters were highly patient-specific (Figure 3C, Figure S10). We also highlight that four subclusters are almost entirely formed by cells coming from Patient 3 (6-,14-,15- and 21-Endometrial cancer), suggesting a high degree of intratumoral heterogeneity within this tumor.
EC 是美国最常见的妇科恶性肿瘤,子宫内膜样组织学类型占大多数病例 ( Siegel et al., 2021 , Ritterhouse and Howitt, 2016 )。为了分析 EEC 患者队列,我们合并了患者 1-5 的所有细胞,得到 32,234 个细胞通过 scRNA-seq 分析,32,155 个细胞由 scATAC-seq 分析 ( STAR Methods )。我们发现细胞主要按细胞类型聚集,而不是按患者聚集,这表明批次效应不是主要的混杂因素 ( Figure 3A - B , Figure S10 )。总体而言,我们在患者 1-5 中观察到 8 种一般细胞类型,其中 scRNA-seq 中有 29 个子簇,scATAC-seq 中有 28 个子簇。在 scATAC-seq 中,20-成纤维细胞亚簇只有 10 个细胞,因此从下游分析中删除。接下来,我们使用 EC 生物标志物 MUC16/CA125 和 WFDC2/HE4 ( Figure S11 ) ( Dong et al., 2017 , Li et al., 2009 ) 筛选恶性亚群。同样,我们观察到成纤维细胞/基质和 EC 亚簇具有高度的患者特异性 ( Figure 3C , Figure S10 )。我们还强调,四个亚簇几乎完全由来自患者 3 (6-、14-、15- 和 21-子宫内膜癌)的细胞形成,这表明该肿瘤内存在高度的瘤内异质性。
Figure 3. A cancer-specific distal regulatory element helps drive IMPA2 expression within the Endometroid Endometrial Cancer patient cohort.
图 3.癌症特异性远端调节元件有助于驱动子宫内膜癌患者队列中的 IMPA2 表达。

A) UMAP plot of scRNA-seq cells color-coded by cell types found in Patients 1–5 (left). UMAP plot of scATAC-seq cells color-coded by inferred cell type across Patients 1–5 (right).
A) 按患者 1-5 中发现的细胞类型进行颜色编码的 scRNA-seq 细胞的 UMAP 图( 左)。 患者 1-5 中按推断细胞类型进行颜色编码的 scATAC-seq 细胞的 UMAP 图( 右 )。
B) UMAP plot of scRNA-seq cells as shown in panel A but color-coded by patient of origin (left). UMAP plot of scATAC-seq cells as shown in panel A but color-coded by patient of origin (right).
B) scRNA-seq 细胞的 UMAP 图,如图 A 所示,但按原始患者( 左 )进行颜色编码。scATAC-seq 细胞的 UMAP 图如图 A 所示,但按原始患者进行颜色编码( 右 )。
C) Stacked bar charts showing contribution of each patient to each subcluster.
C) 显示每个患者对每个子集群的贡献的堆叠条形图。
D) Row-scaled heatmaps of statistically significant distal peak-to-gene links where each row represents expression of a gene (left) correlated to accessibility of a distal peak (right). Select k-means clusters containing IMPA2 are marked in red text.
D) 具有统计学意义的远端峰到基因链接的行刻度热图,其中每行代表一个基因的表达( 左 )与远端峰的可及性( 右 )相关。包含 IMPA2 的选定 k 均值群集以红色文本标记。
E) Browser track showing the accessibility profile at the IMPA2 locus across all cell type subclusters (left). Subclusters are color-coded either malignant (orange) or non-malignant (gray). Putative cancer-specific dRE of IMPA2 is highlighted by the light blue shadow. Matching scRNA-seq expression of IMPA2 is shown for all subclusters (right). Asterisks denote a statistically significant difference in gene expression between cells in marked subclusters when aggregated (average logFC = 0.23 & Bonferroni-corrected p-value <0.01, Wilcoxon Rank Sum test). Known regulatory element annotations for normal ovarian surface epithelium, normal fallopian tube, and ENCODE, are shown below the browser track. Peak-to-gene loops show the correlation value between peak accessibility and IMPA2 expression (bottom).
E) 浏览器轨迹显示所有细胞类型子簇中 IMPA2 基因座的可及性概况( 左 )。子聚类以颜色编码为恶性 ( 橙色 ) 或非恶性 ( 灰色 )。IMPA2 的推定癌症特异性 dRE 由浅蓝色阴影突出显示。显示了所有子簇的 IMPA2 的匹配 scRNA-seq 表达( 右图 )。星号表示在聚合时标记的子集群中细胞间基因表达的统计学显著差异(平均 logFC = 0.23 & Bonferroni 校正的 p 值 <0.01,Wilcoxon 秩和检验)。正常卵巢表面上皮、正常输卵管和 ENCODE 的已知调节元件注释显示在浏览器轨道下方。峰到基因环显示了峰可及性与 IMPA2 表达之间的相关性值( 下图 )。
F) Kaplan–Meier survival curve based on recurrence-free survival for 422 Uterine Corpus Endometrial Carcinoma (UCEC) patients stratified by high and low IMPA2 expression.
F) 基于 422 名子宫体子宫内膜癌 (UCEC) 患者的无复发生存期的 Kaplan-Meier 生存曲线,按 IMPA2 高表达和低表达分层。
Next, we wanted to better understand transcriptional differences between these EEC subclusters and if any patterns could be explained by variation in chromatin accessibility. We performed the cancer-specific peak-to-gene linkage analysis in the EEC cohort and identified 324,626 peak-to-gene links (p-value ≤ 1e-12 with eFDR = 5.5e-5), of which 34,231 were distal with a correlation ≥ 0.45 (Data S1, Figure 3D). Comparison to normal reference epigenomic profiles identified 1,943 putative cancer-specific distal peaks forming 2,950 cancer-specific peak-to-gene links (Data S1) (Consortium et al., 2020, Coetzee et al., 2015). Interestingly, we observe the same increase in number of genes linked to cancer-specific peaks relative to normal peaks for the EEC patient cohort (Wilcoxon Rank Sum test, p-value=4.23e-05).
接下来,我们想更好地了解这些 EEC 亚簇之间的转录差异,以及是否有任何模式可以用染色质可及性的变化来解释。我们在 EEC 队列中进行了癌症特异性峰-基因连锁分析,确定了 324,626 个峰-基因链接 (p 值≤ 1e-12,eFDR = 5.5e-5),其中 34,231 个是远端的,相关性≥ 0.45 ( Data S1 , Figure 3D )。与正常参考表观基因组图谱的比较确定了 1,943 个推定的癌症特异性远端峰,形成 2,950 个癌症特异性峰到基因连接 ( Data S1 ) ( Consortium et al., 2020 , Coetzee et al., 2015 )。有趣的是,我们观察到相对于 EEC 患者队列的正常峰,与癌症特异性峰相关的基因数量增加相同(Wilcoxon 秩和检验,p 值 = 4.23e-05)。
To evaluate if these dREs were shared across EEC patients, we repeated the peak-to-gene linkage analysis for each patient individually using the same set of peaks from the full EEC analysis (Figure S12A). We asked what proportion of the 34,231 dREs, or peak-gene pairs, were recoverable in each patient. The patient-specific analyses from Patients 1–5 recovered 49.68%, 52.03%, 40.91%, 62.17% and 52.32% of the original EEC dREs, respectively (Figure S12B). Moreover, we found that 17.23% of the original EEC dREs were recovered in every patient-specific analysis. Thus, multiple patients participate in these putative regulatory relationships.
为了评估这些 dRE 是否在 EEC 患者之间共享,我们使用完整 EEC 分析中的同一组峰对每位患者单独重复峰到基因连锁分析 ( Figure S12A )。我们询问了每位患者 34,231 个 dRE 或峰值基因对中可恢复的比例。来自患者 1-5 的患者特异性分析分别恢复了 49.68%、52.03%、40.91%、62.17% 和 52.32% 的原始 EEC dRE ( Figure S12B )。此外,我们发现在每次患者特异性分析中都回收了 17.23% 的原始 EEC dRE。因此,多个患者参与这些假定的调节关系。
Next, we wanted to investigate the extent to which cancer-specific dREs are rewired in malignant cell populations relative to normal cell populations of the EEC cohort. We repeated our peak-to-gene linkage analysis for malignant and non-malignant fractions of the EEC cohort independently and assessed how many cancer-specific dREs were recovered in each fraction (Figure 3C, Figure S13). We identified 27,738 dREs in the malignant-specific analysis and 34,172 dREs in the non-malignant analysis (Figure S13B
top). The malignant-specific analysis recovered more of the 2,950 cancer-specific dREs than the non-malignant analysis (47.5% versus 6.3%, respectively) (Figure S13B, bottom). These data suggest that the distal regulatory landscape is rewired in malignancy relative to normal cell states.
接下来,我们想研究相对于 EEC 队列的正常细胞群,癌症特异性 dRE 在恶性细胞群中重新连接的程度。我们独立地重复了 EEC 队列的恶性和非恶性部分的峰-基因连锁分析,并评估了每个部分中回收了多少癌症特异性 dRE ( Figure 3C , Figure S13 )。我们在恶性特异性分析中确定了 27,738 个 dREs,在非恶性分析中确定了 34,172 个 dREs ( Figure S13B 上图)。恶性特异性分析比非恶性分析回收了 2,950 例癌症特异性 dRE 中的更多 (分别为 47.5% 和 6.3%)( Figure S13B , 底部 )。这些数据表明,相对于正常细胞状态,恶性肿瘤中的远端调节景观被重新连接。
We then identified three clear examples of cancer-specific dREs that explain upregulated gene expression in malignant populations relative to normal cell populations in the EEC cohort. For example, there is increased IMPA2 expression in the malignant fraction of the EEC cohort and increased chromatin accessibility of a cancer-specific dRE within the IMAP2 locus (Figure 3E). IMPA2 encodes the inositol monophosphatase 2 protein involved in phosphatidylinositol signaling. While few works have reported a role for IMPA2 in cancer, high IMPA2 expression is predictive of poor survival in Uterine Corpus Endometrioid Carcinoma (UCEC) patients (Figure 3F, Table S4) (Zhang et al., 2020, Nagy et al., 2021, Ohnishi et al., 2007). We also found three clear cancer-specific dREs linked to increased SOX9 expression in the malignant fraction of the EEC cohort (Data S1). Since high SOX9 expression portends a worse outcome for UCEC patients and SOX9 has been implicated in formation of endometrial hyperplastic lesions in EC, these data may offer insights into non-coding mechanisms behind carcinogenesis of the endometrium (Table S4) (Saegusa et al., 2012, Gonzalez et al., 2016, Nagy et al., 2021). Finally, we note that CD24 is highly expressed in the malignant fraction of the EEC cohort, and we highlight three cancer-specific dREs linked to CD24 expression (Data S1). CD24 is reported to be an effective differentiator between endometrial hyperplastic lesions and EC (Nagy et al., 2021, Kim et al., 2009). Additionally, increased CD24 expression offers resistance to chemotherapeutic agents and facilitates immune escape from macrophage phagocytosis in endometrial carcinoma cells (Lin et al., 2021, Pandey et al., 2010). These clinically relevant oncogenic dREs are just a snapshot of the altered regulatory landscape in EEC. We have tabulated all significant cancer-specific dRE-gene interactions in Data S1.
然后,我们确定了癌症特异性 dRE 的三个明确示例,这些示例解释了相对于 EEC 队列中正常细胞群的恶性群体中基因表达上调。例如,EEC 队列恶性组分中 IMPA2 的表达增加,并且 IMAP2 基因座内癌症特异性 dRE 的染色质可及性增加 ( Figure 3E )。IMPA2 编码参与磷脂酰肌醇信号传导的肌醇单磷酸酶 2 蛋白。虽然很少有研究报道 IMPA2 在癌症中的作用,但 IMPA2 的高表达可预测子宫体子宫内膜样癌 (UCEC) 患者的生存率差 ( Figure 3F , Table S4 ) ( Zhang et al., 2020 , Nagy et al., 2021 , Ohnishi et al., 2007 )。我们还发现了 3 个明显的癌症特异性 dRE 与 EEC 队列恶性部分的 SOX9 表达增加有关 ( Data S1 )。由于 SOX9 高表达预示着 UCEC 患者预后更差,并且 SOX9 与 EC 中子宫内膜增生病变的形成有关,因此这些数据可能有助于了解子宫内膜致癌背后的非编码机制 ( Table S4 ) ( Saegusa et al., 2012 , Gonzalez et al., 2016 , Nagy et al., 2021 )。最后,我们注意到 CD24 在 EEC 队列的恶性部分中高度表达,我们强调了与 CD24 表达相关的三种癌症特异性 dRE ( Data S1 )。据报道,CD24 是子宫内膜增生病变和 EC 之间的有效鉴别因子 ( Nagy et al., 2021 , Kim et al., 2009 )。此外,CD24 表达增加提供了对化疗药物的耐药性,并促进了子宫内膜癌细胞中巨噬细胞吞噬作用的免疫逃逸 ( Lin et al., 2021 、 Pandey et al., 2010 )。 这些临床相关的致癌 dRE 只是 EEC 监管格局改变的一个快照。我们已经将所有重要的癌症特异性 dRE 基因相互作用制成表格。 Data S1
Cancer cell populations of High-Grade Serous Ovarian Cancer acquire cancer-specific dREs for genes involved in drug resistance
高级别浆液性卵巢癌的癌细胞群获得参与耐药性基因的癌症特异性 dRE
HGSOC is the most common histologic type of OC and is characterized by high copy number alterations and few driver mutations, which is thought to account for the clinical aggressiveness of this disease (Coward et al., 2015, Macintyre et al., 2018). To analyze the HGSOC patient cohort, we merged all cells from Patients 8 & 9, resulting in 13,646 cells profiled by scRNA-seq and 17,677 cells profiled by scATAC-seq (STAR Methods). Overall, we observed six general cell types across Patients 8 & 9 with 24 subclusters in scRNA-seq and 19 subclusters in scATAC-seq. In scATAC-seq, five cell type subclusters had less than 30 cells and were therefore removed from downstream analysis. (Figure 4A-B, Figure S14). We identified malignant subclusters using inferred CNV events and expression of the OC biomarkers MUC16/CA125 and WFDC2/HE4 (Figure S15) (Li et al., 2009, Duffy et al., 2005, Hellström et al., 2003, Sturgeon et al., 2008). Again, we observed that the fibroblast/stromal and OC subclusters are highly patient-specific, reflecting the biological uniqueness of malignant and fibroblast populations from each patient tumor as partly supported by their distinct inferred CNV profiles (Figure S3 and Figure S14). Of note, Patient 9 has four malignant subclusters suggesting a high degree of intratumoral heterogeneity within this tumor (Figure S14).
HGSOC 是 OC 最常见的组织学类型,其特征是高拷贝数改变和很少的驱动突变,这被认为是该疾病临床侵袭性的原因 ( Coward et al., 2015 , Macintyre et al., 2018 )。为了分析 HGSOC 患者队列,我们合并了患者 8 和 9 的所有细胞,得到 13,646 个细胞被 scRNA-seq 分析,17,677 个细胞被 scATAC-seq 分析 ( STAR Methods )。总体而言,我们在患者 8 和 9 中观察到了 6 种一般细胞类型,其中 scRNA-seq 中有 24 个子簇,scATAC-seq 中有 19 个子簇。在 scATAC-seq 中,5 个细胞类型亚簇的细胞数少于 30 个,因此从下游分析中删除。( Figure 4A - B , Figure S14 )。我们使用推断的 CNV 事件和 OC 生物标志物 MUC16/CA125 和 WFDC2/HE4 的表达 ( Figure S15 ) ( Li et al., 2009 ) ( , Duffy et al., 2005 , Hellström et al., 2003 , Sturgeon et al., 2008 ) 鉴定了恶性亚群。同样,我们观察到成纤维细胞/基质和 OC 亚簇具有高度的患者特异性,反映了来自每个患者肿瘤的恶性和成纤维细胞群的生物学独特性,部分由它们不同的推断 CNV 谱 ( Figure S3 和 Figure S14 )支持。值得注意的是,患者 9 有 4 个恶性亚簇,表明该肿瘤内部存在高度的瘤内异质性 ( Figure S14 )。
Figure 4. Malignant populations of the High-Grade Serous Ovarian Cancer patient cohort acquire novel enhancer-like elements that drive LAPTM4B expression.
图 4.高级别浆液性卵巢癌患者队列的恶性群体获得驱动 LAPTM4B 表达的新型增强子样元件。

A) UMAP plot of scRNA-seq cells color-coded by cell types found in Patients 8 and 9 (left). UMAP plot of scATAC-seq cells color-coded by inferred cell type across Patients 8 and 9 (right).
A) 在患者 8 和 9 中发现的按细胞类型进行颜色编码的 scRNA-seq 细胞的 UMAP 图( 左 )。患者 8 和 9 中按推断的细胞类型进行颜色编码的 scATAC-seq 细胞的 UMAP 图( 右 )。
B) UMAP plot of scRNA-seq cells as seen in panel A but color-coded by patient of origin (left). UMAP plot of scATAC-seq cells as seen in panel A but color-coded by patient of origin (right).
B) scRNA-seq 细胞的 UMAP 图,如图 A 所示,但按原籍患者( 左 )进行颜色编码。scATAC-seq 细胞的 UMAP 图如图 A 所示,但按原籍患者进行颜色编码( 右 )。
C) Row-scaled heatmaps of statistically significant distal peak-to-gene links where each row represents expression of a gene (left) correlated to accessibility of a distal peak (right). Select k-means clusters containing LAPTM4B are marked in red text.
C) 具有统计学意义的远端峰到基因链接的行缩放热图,其中每行代表一个基因的表达( 左 )与远端峰的可及性( 右 )相关。选择包含 LAPTM4B 的 k 均值群集,这些群集以红色文本标记。
D) Browser track showing the accessibility profile at the LAPTM4B locus across all subclusters (left). Subclusters are color-coded either malignant (orange) or non-malignant (gray). Putative dREs of LAPTM4B are highlighted by light blue shadows. Matching scRNA-seq expression of LAPTM4B is shown in the box plot (right) for all subclusters. Asterisks denote a statistically significant difference in gene expression between cells in marked subclusters when aggregated (average logFC = 1.77 & Bonferroni-corrected p-value <0.01, Wilcoxon Rank Sum test). Known regulatory element annotations for normal ovarian surface epithelium, normal fallopian tube, and ENCODE, are shown below the browser track. Peak-to-gene loops show the correlation value between peak accessibility and LAPTM4B expression (bottom).
D) 浏览器轨迹,显示所有子集群中 LAPTM4B 位点的可访问性概况( 左 )。子聚类以颜色编码为恶性 ( 橙色 ) 或非恶性 ( 灰色 )。推定的 LAPTM4B dRE 由浅蓝色阴影突出显示。所有子簇的匹配 scRNA-seq 表达 LAPTM4B 显示在箱形图( 右 )中。星号表示在标记的子集群中,当聚合时(平均 logFC = 1.77 & Bonferroni 校正的 p 值<0.01,Wilcoxon 秩和检验)在统计学上显著的差异。正常卵巢表面上皮、正常输卵管和 ENCODE 的已知调节元件注释显示在浏览器轨道下方。峰到基因环显示了峰可及性与 LAPTM4B 表达之间的相关性值( 下图 )。
E) Kaplan-Meier survival curve based on overall survival for 1,656 OC patients stratified by high and low LAPTM4B expression.
E) 基于 1,656 名 OC 患者的总生存期的 Kaplan-Meier 生存曲线,按高表达和低 LAPTM4B 表达分层。
F) Summary cartoon and table of Find Individual Motif Occurrences (FIMO) predictions within Enhancer 2, Enhancer 4 and LAPTM4B promoter (top, middle, bottom, respectively). Matching scRNA-seq TF expression in the malignant fraction of Patient 9 is shown in the box plots (right).
F) Enhancer 2、Enhancer 4 和 LAPTM4B 启动子( 分别为顶部、中间、底部 )中的查找单个基序出现 (FIMO) 预测摘要卡通和表格。患者 9 恶性组分中匹配的 scRNA-seq TF 表达如箱线图所示( 右 )。
To understand the regulatory landscape of these subclusters, we carried out the peak-to-gene linkage analysis to identify putative cancer-specific dREs driving the transcriptional profiles of malignant populations. This analysis identified 486,293 statistically significant (p-value ≤ 1e-12 with eFDR = 2.1e-06) peak-to-gene links, of which 62,087 were distal with a correlation ≥ 0.45 (Data S1, Figure 4C). The genomic interval overlap analysis identified 5,202 putative cancer-specific distal peaks forming 11,134 cancer-specific peak-to-gene links (Data S1) (Consortium et al., 2020, Coetzee et al., 2015). Overall, cancer-specific peaks linked to more genes on average relative to the normal peaks for the HGSOC cohort (Wilcoxon Rank Sum test, p-value=6.6e-12). We again investigated the extent to which the cancer-specific dREs are rewired in malignant cell populations of the HGSOC cohort and found that a malignant-specific analysis recovered more of the 11,134 cancer-specific dREs than the non-malignant analysis (63.6% versus 3.9%, respectively) (Figure S16).
为了了解这些亚集群的调控格局,我们进行了峰-基因连锁分析,以确定驱动恶性群体转录谱的假定癌症特异性 dRE。该分析确定了 486,293 个具有统计学意义的 (p 值≤ 1e-12,eFDR = 2.1e-06) 峰到基因链接,其中 62,087 个是远端的,相关性≥ 0.45 ( Data S1 , Figure 4C )。基因组间隔重叠分析确定了 5,202 个推定的癌症特异性远端峰,形成 11,134 个癌症特异性峰到基因链接 ( Data S1 ) ( Consortium et al., 2020 , Coetzee et al., 2015 )。总体而言,相对于 HGSOC 队列的正常峰,癌症特异性峰平均与更多基因相关 (Wilcoxon 秩和检验,p 值 = 6.6e-12)。我们再次调查了癌症特异性 dRE 在 HGSOC 队列的恶性细胞群中重新连接的程度,发现恶性特异性分析比非恶性分析回收了 11,134 个癌症特异性 dRE 中的更多(分别为 63.6% 和 3.9%)( Figure S16 )。
Of the 11,134 cancer-specific dREs in the HGSOC cohort, we highlight two examples of cancer-specific gene regulation in the malignant fraction. PI3, encoding peptidase inhibitor 3 (Elafin protein), is highly expressed in the malignant fraction and its upregulation can be explained by four cancer-specific dREs (Data S1). Not only is PI3 predictive of poor survival in serous ovarian cancer patients, it is implicated in OC chemoresistance and confers OC cells a proliferative advantage through activation of MEK-ERK signaling (Table S4) (Gyorffy et al., 2012, Labidi-Galy et al., 2015, Clauss et al., 2010, Wei et al., 2012, Williams et al., 2005).
在 HGSOC 队列的 11,134 个癌症特异性 dRE 中,我们重点介绍了恶性部分中癌症特异性基因调控的两个例子。编码肽酶抑制剂 3(Elafin 蛋白)的 PI3 在恶性组分中高度表达,其上调可以用四种癌症特异性 dRE 来解释 ( Data S1 )。PI3 不仅预测浆液性卵巢癌患者的生存率差,还与 OC 化疗耐药有关,并通过激活 MEK-ERK 信号转导赋予 OC 细胞增殖优势 ( Table S4 ) ( Gyorffy et al., 2012 , Labidi-Galy et al., 2015 , Clauss et al., 2010 Wei et al., 2012 Williams et al., 2005 , )。
We also highlight two cancer-specific dREs that were strongly associated with increased LAPTM4B expression in the malignant fraction of the HGSOC patient cohort (Figure 4D). LAPTM4B is predictive of poor survival in OC patients and has been reported as a potent facilitator of chemotherapeutic drug efflux as well as PI3K/AKT signaling (Figure 4E, Table S4) (Li et al., 2010, Tan et al., 2015, Gyorffy et al., 2012). We labeled LAPTM4B cancer-specific dREs as Enhancer 2 (Enh2) and Enhancer 4 (Enh4), and we note that there are three additional dREs annotated within this locus (Enhancer 1, 3, and 5). To interrogate TF occupancy at these dREs, we performed Find Individual Motif Occurrences (FIMO) analysis for each putative enhancer region using the Patient 9 DNA sequence after accounting for single-nucleotide variants in the malignant fraction (subclusters 0-,7-,11-,16-Ovarian cancer) of Patient 9 (Figure 4F and STAR Methods) (Bailey et al., 2015, Grant et al., 2011, Bailey et al., 2009). Interestingly, cells from the Patient 9 malignant fraction harbor a SNP (rs10955131) within Enhancer 2, but we are unable to determine if this mutation is somatically acquired as we did not achieve sufficient read depth in normal immune cells at this particular genomic region to perform variant calling (Figure S17). We observed statistically significant TF motif matches within each putative enhancer region and further ranked them by scRNA-seq TF expression within the Patient 9 malignant fraction (Figure 4F and Table S5). Of note, we found YY1 motifs within Enhancer 2, Enhancer 4 and the LAPTM4B promoter region, suggesting these cancer-specific enhancers participate in active enhancer-promoter connections within malignant cells of Patient 9 (Weintraub et al., 2017).
我们还强调了两种癌症特异性 dREs,它们与 HGSOC 患者队列恶性部分的 LAPTM4B 表达增加密切相关 ( Figure 4D )。LAPTM4B 可预测 OC 患者生存率低,并已被报道为化疗药物外排以及 PI3K/AKT 信号转导的有效促进剂 ( Figure 4E , Table S4 ) ( Li et al., 2010 , Tan et al., 2015 , Gyorffy et al., 2012 )。我们将 LAPTM4B 癌症特异性 dRE 标记为增强子 2 (Enh2) 和增强子 4 (Enh4),我们注意到该基因座内还有三个额外的 dRE 注释 (增强子 1 、 3 和 5)。为了询问这些 dRE 的 TF 占有率,我们在考虑了患者 9 ( Figure 4F 和) Bailey et al., 2015 Grant et al., 2011 Bailey et al., 2009 ( , STAR Methods , ) 的恶性部分(亚簇 0-,7-,11-,16-卵巢癌)中的单核苷酸变异后,使用患者 9 DNA 序列对每个假定的增强子区域进行了查找单个基序出现 (FIMO) 分析).有趣的是,来自患者 9 恶性组分的细胞在增强子 2 中携带 SNP (rs10955131),但我们无法确定这种突变是否是体细胞获得性的,因为我们在这个特定基因组区域的正常免疫细胞中没有达到足够的读取深度来执行变体调用( Figure S17 )。我们在每个推定的增强子区域内观察到具有统计学意义的 TF 基序匹配,并根据患者 9 恶性组分内的 scRNA-seq TF 表达进一步对它们进行排名( Figure 4F 值得注意的是 Table S5). ,我们在增强子 2、增强子 4 和 LAPTM4B 启动子区域中发现了 YY1 基序,表明这些癌症特异性增强子参与患者 9 恶性细胞内的活性增强子-启动子连接 ( Weintraub et al., 2017 )。
Functional validation of LAPTM4B enhancers and predicted TF regulators
LAPTM4B 增强子和预测的 TF 调节因子的功能验证
To further validate our dRE identification pipeline, we conducted experiments to confirm these dREs and TFs as bona fide enhancers of LAPTM4B expression. First, we used dCas9-KRAB-mediated CRISPR interference assays, in the HGSOC cell line OVCAR3, to inhibit the most highly active cancer-specific dRE (Enhancer 2) and lineage-specific dRE (Enhancer 3) in the LAPTM4B locus (Figure 5A-C and STAR Methods) (Fulco et al., 2016, Larson et al., 2013, Gilbert et al., 2013, Qi et al., 2013). OVCAR3 cells stably expressing dCas9-KRAB were transfected with single guide RNAs (sgRNAs) targeting Enhancer 2 and Enhancer 3 to induce local chromatin repression (Figure 5B and STAR Methods). We then measured the consequences on gene expression and found that LAPTM4B was significantly reduced when targeting Enhancer 2 and Enhancer 3 (Figure 5D). Thus, we conclude that Enhancer 2 and Enhancer 3 are bona-fide enhancers of LAPTM4B, providing support for the remaining dREs identified throughout this study.
为了进一步验证我们的 dRE 鉴定管道,我们进行了实验以确认这些 dREs 和 TFs 是 LAPTM4B 表达的真正增强子。首先,我们在 HGSOC 细胞系 OVCAR3 中使用 dCas9-KRAB 介导的 CRISPR 干扰测定,以抑制 LAPTM4B 位点( Figure 5A - 和 STAR Methods ) ( Fulco et al., 2016 、 C 、 Larson et al., 2013 Gilbert et al., 2013 、 ) Qi et al., 2013 中最活跃的癌症特异性 dRE (Enhancer 2) 和谱系特异性 dRE (Enhancer 3)。用靶向增强子 2 和增强子 3 的单向导 RNA (sgRNA) 转染稳定表达 dCas9-KRAB 的 OVCAR3 细胞,以诱导局部染色质抑制 ( Figure 5B 和 STAR Methods )。然后,我们测量了对基因表达的影响,发现当靶向增强子 2 和增强子 3 时 ,LAPTM4B 显著降低 ( Figure 5D )。因此,我们得出结论,Enhancer 2 和 Enhancer 3 是真正的 LAPTM4B 增强子 , 为本研究中确定的其余 dRE 提供支持。
Figure 5. Functional validation of cancer-specific LAPTM4B regulatory model in high-grade serous ovarian cancer cells.
图 5.高级别浆液性卵巢癌细胞中癌症特异性 LAPTM4B 调节模型的功能验证。

A) Browser track showing the accessibility profile at the LAPTM4B locus, as in Fig. 4D, but between malignant (orange) and non-malignant (gray) fractions of the HGSOC patient cohort. Coverage is normalized by sequencing depth as well as reads in TSS regions. Known regulatory element annotations for normal ovarian surface epithelium, normal fallopian tube, and ENCODE, are shown below the browser track.
A) 浏览器轨迹显示 LAPTM4B 位点的可访问性概况,如 Fig. 4D ,但在 HGSOC 患者队列的恶性( 橙色 )和非恶性( 灰色 )部分之间。通过测序深度以及 TSS 区域的读数对覆盖度进行归一化。正常卵巢表面上皮、正常输卵管和 ENCODE 的已知调节元件注释显示在浏览器轨道下方。
B) Cartoon of dCas9-KRAB mediated CRISPR interference.
B) dCas9-KRAB 介导的 CRISPR 干扰的漫画。
C) Western blot of OVCAR3 cells stably expressing dCas9-KRAB.
C) 稳定表达 dCas9-KRAB 的 OVCAR3 细胞的 Western blot。
D) RT-qPCR results showing expression of LAPTM4B after dCas9-KRAB mediated repression of Enhancer 2 and Enhancer 3. Expression is shown as fold change relative to ACTB expression.
D) RT-qPCR 结果显示 dCas9-KRAB 介导的增强子 2 和增强子 3 抑制后 LAPTM4B 表达。表达表现为相对于 ACTB 表达的倍数变化。
E) Cartoon depicting inferred TF-mediated enhancer-promoter connections.
E) 描绘推断的 TF 介导的增强子-启动子连接的卡通。
F) RT-qPCR results of LAPTM4B expression after siRNA-mediated knockdown of GAPDH and predicted TF regulators: YY1, CEBPD, and KLF6. Expression is shown as fold change relative to ACTB expression.
F) siRNA 介导的 GAPDH 敲低后 LAPTM4B 表达的 RT-qPCR 结果和预测的 TF 调节因子:YY1、CEBPD 和 KLF6。表达表现为相对于 ACTB 表达的倍数变化。
G) RT-qPCR results of expression of TF regulators after siRNA knockdown. Expression is shown as fold change relative to ACTB expression.
G) siRNA 敲低后 TF 调节因子表达的 RT-qPCR 结果。表达表现为相对于 ACTB 表达的倍数变化。
H) RT-qPCR results of expression of GAPDH after siRNA-mediated knockdown of GAPDH and TF regulators. Expression is shown as fold change relative to ACTB expression. Data in D, F, G, and H shown as mean ± S.E.M.; *p< 0.05, **p< 0.01, ***p< 0.001, one-tailed Welch’s t-test.
H) siRNA 介导的 GAPDH 和 TF 调节因子敲低后 GAPDH 表达的 RT-qPCR 结果。表达表现为相对于 ACTB 表达的倍数变化。D、F、G 和 H 中的数据显示为 S.E.M. ±平均值;*p< 0.05, **p< 0.01, ***p< 0.001, 单尾韦尔奇 t 检验。
We next validated predicted TF regulators of LAPTM4B via RNAi-mediated knockdown in OVCAR3 cells (Figure 5E). We measured the expression of LAPTM4B after knockdown of each predicted TF regulator: YY1, CEBPD, and KLF6. Indeed, we observed a statistically significant decrease in LAPTM4B expression when targeting YY1, CEBPD, and KLF6, but not when targeting the negative control, GAPDH (Figure 5E-H). Thus, YY1, CEBPD, and KLF6 are bona-fide TF regulators of LAPTM4B and provide confidence for our TF predictions (Figure 5E).
接下来,我们通过在 OVCAR3 细胞中通过 RNAi 介导的敲低验证了 LAPTM4B 的预测 TF 调节因子 ( Figure 5E )。我们测量了每种预测的 TF 调节因子 YY1 、 CEBPD 和 KLF6 敲低后 LAPTM4B 的表达。事实上,我们观察到当靶向 YY1、CEBPD 和 KLF6 时,LAPTM4B 表达在统计学上显着降低,但在靶向阴性对照 GAPDH ( Figure 5E - H ) 时没有。因此,YY1、CEBPD 和 KLF6 是真正的 TF 调节因子 LAPTM4B 并为我们的 TF 预测提供了信心 ( Figure 5E )。
Linking dREs to transcription factor activity in human gynecologic malignancies
将 dRE 与人类妇科恶性肿瘤的转录因子活性联系起来
After identifying dREs that may play critical roles in cancer progression, we interrogated trans-acting factors present at these dREs across the entire dataset to better understand the regulatory logic of these tumors. We adapted our published method called Total Functional Score of Enhancer Elements (TFSEE) to predict which TFs are enriched at active dREs (enhancer-like elements) within malignant cell types (Figure 6A, STAR Methods) (Malladi et al., 2020, Franco et al., 2018). By adapting this method to matched scRNA-seq and scATAC-seq, TFSEE allows for concurrent assessment of TF expression, enhancer activity, enhancer location, and TFs present at enhancers. Across the full patient cohort, there were 11 malignant cell type subclusters chosen for TFSEE analysis based on patient specificity, inferred CNV events, and/or cancer biomarker expression patterns (Figure S18). We conducted the TFSEE analysis and observed that the malignant cell types tend to cluster by patient and by cancer type (Figure 6B). To further prioritize enriched TFs across active enhancer elements, we highlighted each TF by its predicted druggability status (binary) as determined by the canSAR database through structure-based and ligand-based assessments (Tym et al., 2016, Mitsopoulos et al., 2020).
在确定了可能在癌症进展中起关键作用的 dRE 后,我们询问了整个数据集中这些 dRE 中存在的反式作用因子,以更好地了解这些肿瘤的调节逻辑。我们采用了我们已发表的称为增强子元件总功能评分 (TFSEE) 的方法,以预测哪些 TF 在恶性细胞类型 ( Figure 6A , STAR Methods ) ( Malladi et al., 2020 , Franco et al., 2018 ) 中的活性 dREs(增强子样元件)处富集。通过将该方法应用于匹配的 scRNA-seq 和 scATAC-seq,TFSEE 允许同时评估 TF 表达、增强子活性、增强子位置和增强子处存在的 TF。在整个患者队列中,根据患者特异性、推断的 CNV 事件和/或癌症生物标志物表达模式选择了 11 个恶性细胞类型亚集群进行 TFSEE 分析 ( Figure S18 )。我们进行了 TFSEE 分析并观察到恶性细胞类型倾向于按患者和癌症类型 ( Figure 6B ) 聚集。为了进一步优先考虑活性增强子元件中富集的 TF,我们通过其预测的成药性状态(二进制)突出显示每个 TF,该状态由 canSAR 数据库通过基于结构和基于配体的评估确定 ( Tym et al., 2016 , Mitsopoulos et al., 2020 )。
Figure 6. Functional scoring of cell type-specific enhancer activity and their cognate transcription factors helps prioritize potential therapeutic targets across gynecologic malignancies.
图 6.细胞类型特异性增强子活性及其同源转录因子的功能评分有助于优先考虑妇科恶性肿瘤的潜在治疗靶点。

A) Cartoon of matrix operations performed in the Total Functional Score of Enhancer Elements (TFSEE) method. Only malignant cell type clusters with 100% patient specificity were chosen for TFSEE analysis.
A) 在增强子元件总功能评分 (TFSEE) 方法中执行的矩阵运算的漫画。仅选择具有 100% 患者特异性的恶性细胞类型簇进行 TFSEE 分析。
B) Unsupervised hierarchical clustering heatmap of cell type normalized TFSEE scores (n=102 TFs across active enhancers). Each row of the heatmap represents TF activity across cell type-specific enhancers enriched in each column. Predicted druggability status for each TF is marked with druggable/not druggable according to the canSAR database.
B) 细胞类型归一化 TFSEE 分数的无监督分层聚类热图(活性增强子中的 n=102 个 TF)。热图的每一行都表示每列中富集的细胞类型特异性增强子的 TF 活性。根据 canSAR 数据库,每个 TF 的预测成药性状态标记为 Druggable/Not Druggable。
C) Rank-ordered plot showing the difference in scaled TFSEE score for each TF between subclone 1 (orange) and subclone 2 (blue) of the Patient 6 tumor representing serous EC. Each point represents a TF and is colored by predicted druggability status. Notable TFs enriched in either condition (subclone 1/subclone 2) are labeled in light blue regions of the plot.
C) 排序图显示了代表浆液性 EC 的患者 6 肿瘤的亚克隆 1( 橙色 )和亚克隆 2( 蓝色 )之间每个 TF 的缩放 TFSEE 评分的差异。每个点代表一个 TF,并按预测的成药性状态着色。在任一条件(亚克隆 1/亚克隆 2)中富集的显着 TF 都标记在图的浅蓝色区域中。
D) Rank-ordered plot showing the difference in scaled TFSEE score for each TF between carcinoma (pink) and sarcoma (green) fractions of the Patient 10 tumor representing carcinosarcoma OC. Each point represents a TF and is colored by predicted druggability status. Notable TFs enriched in either condition (sarcoma/carcinoma) are labeled in light blue regions of the plot.
D) 排序图显示了代表癌肉瘤 OC 的患者 10 肿瘤的癌( 粉红色 )和肉瘤( 绿色 )部分之间每个 TF 的缩放 TFSEE 评分的差异。每个点代表一个 TF,并按预测的成药性状态着色。在任一情况 (肉瘤/癌) 中富集的显着 TF 都标记在图的浅蓝色区域。
To exemplify the utility of TFSEE with single-cell data, we investigated intratumoral heterogeneity of two patients with rare histological subtypes. For Patient 6, diagnosed as EC of serous histology that metastasized to the ovary, there were two distinct tumor subclones (19- and 34-Endometrial cancer) highlighted by their distinct CNV profiles (Figure 6C, Figure S2, Table 1, Table S1). We visualized the differences in TF activity between these two subclones and observed several notable TFs enriched in each subclone (Figure 6C). Of note, we found MAFB to be enriched in the 19-Endometrial cancer subclone of the Patient 6 tumor relative to the 34-Endometrial cancer subclone. Moreover, MAFB is predicted to be druggable by ligand-based assessment according to the canSAR database (Mitsopoulos et al., 2020, Tym et al., 2016). We also observed STAT1 is enriched in the 34-Endometrial cancer subclone of the Patient 6 tumor (Mitsopoulos et al., 2020, Tym et al., 2016). These differences in TF activity may provide valuable insight into intratumoral heterogeneity of serous EC.
为了用单细胞数据举例说明 TFSEE 的效用,我们调查了两名罕见组织学亚型患者的瘤内异质性。对于患者 6,诊断为转移至卵巢的浆液性组织学 EC,有两个不同的肿瘤亚克隆(19 和 34 子宫内膜癌),由其不同的 CNV 谱 ( Figure 6C 、 Figure S2 、 Table 1 、 Table S1 )突出显示。我们可视化了这两个亚克隆之间 TF 活性的差异,并观察到每个亚克隆中富集的几个显着 TF ( Figure 6C )。值得注意的是,我们发现 MAFB 相对于 34 个子宫内膜癌亚克隆,在患者 6 肿瘤的 19 个子宫内膜癌亚克隆中富集。此外,根据 canSAR 数据库 ( Mitsopoulos et al., 2020 , Tym et al., 2016 ),通过基于配体的评估预测 MAFB 是可成药的。我们还观察到 STAT1 在患者 6 肿瘤的 34 个子宫内膜癌亚克隆中富集 ( Mitsopoulos et al., 2020 , Tym et al., 2016 )。TF 活性的这些差异可能为浆液性 EC 的瘤内异质性提供有价值的见解。
We also chose to investigate the two histopathological fractions (16- and 17-Ovarian cancer) of the Patient 10 tumor diagnosed as an ovarian carcinosarcoma (Table 1, Table S1). While these two histopathological fractions have similar inferred CNV profiles, a pseudo-bulk gene-set variation analysis (GSVA) across all malignant cell types revealed a higher enrichment of epithelial-to-mesenchymal transition (EMT) and Invasion gene signatures within the 16-Ovarian cancer subcluster (Figures S3 and S18). This suggests the 16-Ovarian cancer subcluster represents the sarcoma fraction while the 17-Ovarian cancer subcluster represents the carcinoma fraction. These fraction identity assignments are also supported by clustering of 16-Ovarian cancer with the GIST subclusters, 0-/27-GIST, and clustering of 17-Ovarian cancer with the HGSOC subclusters, 9-/10-Ovarian cancer (Figure 6B). To uncover differences in TF activity between the carcinoma fraction (17-Ovarian cancer) and sarcoma fraction (16-Ovarian cancer) of the Patient 10 tumor, we visualized the differences in scaled TFSEE score and identified a number of TFs enriched in each fraction. ZEB1 was enriched in the sarcoma fraction relative to carcinoma fraction (Figure 6D) (Mitsopoulos et al., 2020, Tym et al., 2016). This result is in line with ZEB1’s role in EMT and repression of epithelial-specific genes (Sánchez-Tilló et al., 2011, Watanabe et al., 2019). We also observed the epithelial-specific transcription factor ELF3 enriched in the carcinoma fraction relative to the sarcoma fraction (Figure 6D) (Sengez et al., 2019, Brembeck et al., 2000). These distinct TF activity profiles, along with the shared inferred CNV events between the histopathological fractions of the ovarian carcinosarcoma, may help researchers and clinicians better understand the etiologyof gynecologic carcinosarcomas (Barker and Scott, 2020, Kostov et al., 2020).
我们还选择调查诊断为卵巢癌肉瘤 ( Table 1 , Table S1 ) 的患者 10 肿瘤的两个组织病理学部分(16 和 17 卵巢癌)。虽然这两个组织病理学部分具有相似的推断 CNV 谱,但所有恶性细胞类型的伪大量基因集变异分析 (GSVA) 显示,在 16 个卵巢癌亚簇内, 上皮-间质转化 (EMT) 和侵袭基因特征的富集程度更高( Figures S3 和 S18 ).这表明 16 个卵巢癌子簇代表肉瘤分数,而 17 个卵巢癌子簇代表癌分数。16 卵巢癌与 GIST 子簇 0-/27-GIST 的聚类以及 17 卵巢癌与 HGSOC 亚簇 9-/10-卵巢癌的聚类也支持这些分数同一性分配 ( Figure 6B )。为了揭示患者 10 肿瘤的癌分数 (17-卵巢癌) 和肉瘤分数 (16-卵巢癌) 之间 TF 活性的差异,我们可视化了缩放 TFSEE 评分的差异,并确定了每个分数中富集的许多 TF。ZEB1 在肉瘤组分中富集,相对于癌组分 ( Figure 6D ) ( Mitsopoulos et al., 2020 , Tym et al., 2016 )。该结果与 ZEB1 在 EMT 和抑制上皮特异性基因中的作用一致 ( Sánchez-Tilló et al., 2011 , Watanabe et al., 2019 )。我们还观察到相对于肉瘤分数 ( Figure 6D ) ( Sengez et al., 2019 , Brembeck et al., 2000 ) 的癌症分数中富集的上皮特异性转录因子 ELF3 。 这些不同的 TF 活动概况,以及卵巢癌肉瘤组织病理学部分之间共享的推断 CNV 事件,可能有助于研究人员和临床医生更好地了解妇科癌肉瘤的病因 ( Barker and Scott, 2020 , Kostov et al., 2020 )。
Our TFSEE analysis allowed us to make additional comparisons of serous versus endometrioid OC, serous versus endometrioid EC, and GIST versus serous OC (Figure S19). In each case, we identify important TF regulators enriched in either histologic type. Of note, we observed RARG enriched in serous OC relative to endometrioid OC, MAFB enriched in serous EC relative to endometrioid EC, and ZEB1 enriched in GIST relative to serous OC (Figure S19B-D). Overall, our TFSEE analysis is a novel framework in single-cell genomics that reveals robust inferences of TF activity coupled to TF expression. This strategy attempts to lower the false positive rate of motif-based TF predictions by enriching for TFs with non-zero expression and giving lower weight to TFs with zero or negligible expression. In some instances, some TFs can still be functional without being actively transcribed. Therefore, we chose to explore an alternate version of the TFSEE analysis that is agnostic to TF expression by omitting the last element-wise multiplication with the TF expression matrix and found similar results (Figure S20).
我们的 TFSEE 分析使我们能够对浆液性与子宫内膜样 OC、浆液性与子宫内膜样 EC 以及 GIST 与浆液性 OC 进行额外的比较 ( Figure S19 )。在每种情况下,我们都会确定在任一组织学类型中富集的重要 TF 调节因子。值得注意的是,我们观察到相对于子宫内膜样 OC 富含浆液性 OC 的 RARG,相对于子宫内膜样 EC 富含浆液性 EC 的 MAFB,以及相对于浆液性 OC 富含 GIST 的 ZEB1 ( Figure S19B - D )。总体而言,我们的 TFSEE 分析是单细胞基因组学中的一个新框架,它揭示了 TF 活性与 TF 表达偶联的稳健推断。该策略试图通过富集非零表达的 TF 并降低表达为零或可忽略不计的 TF 的权重来降低基于基序的 TF 预测的假阳性率。在某些情况下,某些 TF 仍然可以正常工作,而无需主动转录。因此,我们选择通过省略与 TF 表达式矩阵的最后一个元素乘法来探索与 TF 表达式无关的 TFSEE 分析的替代版本,并发现了类似的结果 ( Figure S20 )。
DISCUSSION 讨论
To date, the standard of care for OC and EC is a combination of surgery, chemotherapy, and radiation. Despite these aggressive treatments, most women with advanced stage EC and OC will succumb to their disease, highlighting the need to develop better targeted therapies. Our work represents a valuable multi-omic resource that charts the transcriptional and regulatory landscape of gynecologic tumors at single-cell resolution. Deconvolution of this dataset identified novel mechanisms that facilitate tumorigenesis and prioritized potential avenues for therapeutic intervention that were hidden using bulk genomic approaches. We also shed light on non-coding regulatory mechanisms for a number of clinically relevant biomarkers and major playersinvolved in cancer pathogenesis (Yang et al., 2017, Duffy et al., 2005, Dong et al., 2017, Sturgeon et al., 2008, Sarlomo-Rikala et al., 1998). Moreover, we anticipate that this dataset will help inspire novel therapeutic treatment strategies in EC and/or OC by serving as a reference for 1) clinicians in understanding intratumoral heterogeneity, 2) hypothesis generation in cancer biology, 3) cell type annotation in future single-cell datasets, and 4) the development of novel bioinformatic methods.
迄今为止,OC 和 EC 的标准护理是手术、化疗和放疗相结合。尽管接受了这些积极的治疗,但大多数患有晚期 EC 和 OC 的女性会死于疾病,这凸显了开发更好的靶向疗法的必要性。我们的工作代表了一种有价值的多组学资源,它以单细胞分辨率绘制了妇科肿瘤的转录和调节景观。该数据集的反卷积确定了促进肿瘤发生的新机制,并优先考虑了使用批量基因组方法隐藏的治疗干预的潜在途径。我们还阐明了许多临床相关生物标志物和参与癌症发病机制的主要参与者的非编码调节机制 ( Yang et al., 2017 、 、 Duffy et al., 2005 Dong et al., 2017 、 Sturgeon et al., 2008 Sarlomo-Rikala et al., 1998 、 )。此外,我们预计该数据集将作为 1) 临床医生了解肿瘤内异质性的参考,2) 癌症生物学中的假设生成,3) 未来单细胞数据集中的细胞类型注释,以及 4) 新型生物信息学方法的开发。
We reiterate four important findings from analyzing this single-cell dataset. First, we demonstrated that cancer cells acquire de novo non-coding dREs that modulate hallmark cancer pathways, including mTOR signaling, in a cancer-specific manner (Figures 2–5, Data S1). This is consistent with recent clinical trials testing mTOR inhibitors in combination therapy for ovarian cancer patients (Das et al., 2017, Westin, 2014, Banerji, 2014). From this, we speculate that the mTOR-enriched Patient 7 may benefit from an mTOR inhibitor treatment, although further investigation is needed. Nonetheless, these data demonstrate important non-coding mechanisms for how cancer cells may acquire aggressive phenotypes due to changes in chromatin accessibility and TF occupancy.
我们重申了分析该单细胞数据集的四个重要发现。首先,我们证明癌细胞以癌症特异性方式获得从头非编码 dRE,这些 dRE 调节标志性癌症通路,包括 mTOR 信号传导 ( Figures 2 – 5 , Data S1 )。这与最近在卵巢癌患者联合治疗中测试 mTOR 抑制剂的临床试验一致 ( Das et al., 2017 , Westin, 2014 , Banerji, 2014 )。由此,我们推测富含 mTOR 的患者 7 可能受益于 mTOR 抑制剂治疗,尽管需要进一步研究。尽管如此,这些数据证明了癌细胞如何由于染色质可及性和 TF 占有率的变化而获得侵袭性表型的重要非编码机制。
Moreover, cancer-specific dREs identified in each analysis cohort linked to more target genes on average compared to the lineage-specific dREs (Figure 2D). Based on our data, we anticipate this trend to be even greater across a larger group of patient tumors and posit that salient cancer-specific dREs carry a higher ‘regulatory load’ relative to dREs active in normal tissues. This could be explained by alterations in topologically associating domain boundaries and higher order chromatin structure, but this warrants further investigation (Akdemir et al., 2020).
此外,与谱系特异性 dRE 相比,每个分析队列中鉴定的癌症特异性 dRE 平均与更多的靶基因相关 ( Figure 2D )。根据我们的数据,我们预计这种趋势在更大的患者肿瘤群体中会更大,并假设相对于在正常组织中活跃的 dRE,显着的癌症特异性 dRE 具有更高的“调节负荷”。这可以通过拓扑关联结构域边界和高阶染色质结构的改变来解释,但这值得进一步研究 ( Akdemir et al., 2020 )。
Next, malignant populations within and between patient tumors show substantial heterogeneity in chromatin accessibility linked to transcriptional output (Figures 1–6). This poses a challenging obstacle in EC and OC treatment, and highlights the importance of intratumoral heterogeneity and the growing need for more single-cell datasets of solid tumors, especially in response to chemotherapy. The extent to which malignant cell populations can be described as distinct ‘cell types’ or ‘cell states’ remains elusive and inspires further study into temporally regulated oncogenic regulatory elements and lineage tracing of malignant cell populations (Clevers et al., 2017).
接下来,患者肿瘤内和患者肿瘤之间的恶性群体在与转录输出相关的染色质可及性方面显示出很大的异质性 ( Figures 1 – 6 )。这给 EC 和 OC 治疗带来了具有挑战性的障碍,并凸显了瘤内异质性的重要性以及对更多实体瘤单细胞数据集的需求不断增长,尤其是在对化疗的反应方面。恶性细胞群在多大程度上可以被描述为不同的“细胞类型”或“细胞状态”仍然难以捉摸,并激发了对时间调节的致癌调节元件和恶性细胞群的谱系追踪的进一步研究 ( Clevers et al., 2017 )。
Lastly, our methodology to infer differential TF activity between populations of malignant cells reveals another complex layer of gene regulation that is repurposed in cancer cells (Figure 6 and Figures S19-S20). Our TFSEE analysis is a powerful tool that facilitates integration of scRNA-seq and scATAC-seq datasets to interrogate complex mechanisms of gene regulation. This helps prioritize TFs for follow up investigation and could help inspire novel therapeutic avenues in gynecologic malignancies. As a whole, this resource showcases important principles of gene regulation and tumor biology determined through single-cell multi-omic data.
最后,我们推断恶性细胞群之间差异 TF 活性的方法揭示了另一个复杂的基因调控层,该层在癌细胞中被重新利用 ( Figure 6 和 Figures S19 - S20 )。我们的 TFSEE 分析是一个强大的工具,可促进 scRNA-seq 和 scATAC-seq 数据集的集成,以询问基因调控的复杂机制。这有助于确定 TF 的优先级以进行后续调查,并可能有助于激发妇科恶性肿瘤的新治疗途径。总体而言,该资源展示了通过单细胞多组学数据确定的基因调控和肿瘤生物学的重要原理。
Limitations of study 研究的局限性
We recognize the true richness of the dataset cannot be exemplified here in full, and that there are some limitations associated with our approach. First, scRNA-seq and scATAC-seq libraries were prepared for each tumor by independent sampling of the cell suspension generated for each tumor. While Seurat v3 allows for robust alignment of cell types across datasets, there are methods for profiling the transcriptome and chromatin landscape within the same cell (Cao et al., 2018, Chen et al., 2019, Ma et al., 2020). However, these methods have yet to become widely accessible and come with their own set of technical nuances. Secondly, the number of cell type subclusters identified in the scRNA-seq data is dependent on user-defined parameters such as number of PCs and clustering resolution (Xu and Su, 2015, Stuart et al., 2019). While we did not explore all possible parameter sets, we note that characterizing cell type composition of each tumor was not the main focus of our study. Therefore, there may be even more complexity in these single-cell data. Thirdly, we realize that our Kaplan-Meier survival analyses were derived from bulk measurements in contrast to our single-cell data. Finally, we acknowledge that our study was limited by a small number of patients with a mix of histotypes which could affect the generalizability of our resource. However, we note that our requirement for treatment-naïve tumors prevented us from being more selective in regard to tumor histology. All patient specimens presented are treatment-naïve tumors, which are difficult to procure since the standard of care for HGSOC is shifting towards neo-adjuvant treatment. Nonetheless, these data and the analyses described herein represent a true baseline for these cancers, serving as a foundation for defining the regulatory logic of malignant cells at single-cell resolution.
我们认识到数据集的真正丰富性无法在这里完整地举例说明,而且我们的方法存在一些局限性。首先,通过对每个肿瘤生成的细胞悬液进行独立采样,为每个肿瘤制备 scRNA-seq 和 scATAC-seq 文库。虽然 Seurat v3 允许跨数据集的细胞类型稳健对齐,但有一些方法可以分析同一细胞内的转录组和染色质景观 ( Cao et al., 2018 , Chen et al., 2019 Ma et al., 2020 , )。然而,这些方法尚未得到广泛使用,并且具有自己的一系列技术细微差别。其次,在 scRNA-seq 数据中鉴定的细胞类型子簇的数量取决于用户定义的参数,例如 PC 数量和聚类分辨率 ( Xu and Su, 2015 , Stuart et al., 2019 )。虽然我们没有探索所有可能的参数集,但我们注意到表征每种肿瘤的细胞类型组成并不是我们研究的主要重点。因此,这些单单元数据可能会更加复杂。第三,我们意识到我们的 Kaplan-Meier 生存分析是从批量测量中得出的,与我们的单细胞数据相比。最后,我们承认我们的研究受到少数具有混合组织型的患者的限制,这可能会影响我们资源的普遍性。然而,我们注意到,我们对初治肿瘤的要求使我们在肿瘤组织学方面更具选择性。提供的所有患者标本都是未接受过治疗的肿瘤,由于 HGSOC 的护理标准正在转向新辅助治疗,因此很难获得。 尽管如此,这些数据和本文描述的分析代表了这些癌症的真实基线,是定义单细胞分辨率下恶性细胞的调节逻辑的基础。
STAR METHODS STAR 方法
RESOURCE AVAILABILITY 资源可用性
Lead Contact 牵头联系人
Further information and requests for resources and reagents should be directed to and will be fulfilled by the lead contact, Hector L. Franco (hfranco@med.unc.edu).
更多信息以及资源和试剂请求应直接发送至牵头联系人 Hector L. Franco (hfranco@med.unc.edu) 并由其完成。
Materials availability 材料可用性
Plasmids generated in this study are available upon request.
本研究中生成的质粒可应要求提供。
Data and code availability
数据和代码可用性
Processed single-cell RNA-seq data and single-cell ATAC-seq have been deposited at GEO(https://www.ncbi.nlm.nih.gov/geo/) under the accession number GSE173682 and are publicly available as of the date of publication. Raw data (10x FASTQs) will be available with controlled access via dbGAP under the accession number phs002340.v1.p1 (https://www.ncbi.nlm.nih.gov/gap/).
处理后的单细胞 RNA-seq 数据和单细胞 ATAC-seq 已存放在 GEO( https://www.ncbi.nlm.nih.gov/geo/ ) 的登录号 GSE173682 下,并在发布之日公开可用。原始数据 (10x FASTQ) 将通过 dbGAP 在登录号 phs002340.v1.p1 ( ) 下通过受控访问提供 https://www.ncbi.nlm.nih.gov/gap/ 。All original code has been deposited on the Zenodo platform (DOI: 10.5281/zenodo.5546110) and is publicly available at the Github repository scENDO_scOVAR_2020 (https://github.com/RegnerM2015/scENDO_scOVAR_2020).
所有原始代码均已存放在 Zenodo 平台上 (DOI: 10.5281/zenodo.5546110),并在 Github 存储库 scENDO_scOVAR_2020 ( https://github.com/RegnerM2015/scENDO_scOVAR_2020 ) 中公开提供。Any additional information required to reanalyze the data reported in this paper is available from the lead contact (hfranco@med.unc.edu).
重新分析本文中报告的数据所需的任何其他信息均可从潜在客户联系人 (hfranco@med.unc.edu) 处获得。
EXPERIMENTAL MODEL AND SUBJECT DETAILS
实验模型和主题详细信息
Human Patient Samples and Tumor Dissociation
人类患者样本和肿瘤解离
Eleven, treatment naïve, Ovarian and Endometrial cancer patients were enrolled in the ‘Genomics of Ovarian and Endometrial Cancers’ study at the UNC Cancer Hospital (IRB Protocol 18–3198) and underwent debulking surgery with curative intent to remove their tumors (Table 1, Table S1). Tumor specimens were sectioned for pathology review and the remaining tissues were de-identified and collected for this study through UNC’s Tissue Procurement Facility. To minimize the time elapsed between the surgical removal of tumor tissue and processing for single-cell genomics, we established an efficient pipeline between the medical professionals (surgeon/clinical research coordinator/clinical pathologist), the coordinating team (project managers/pathology technician) and our labs’ research technicians before procedure day. The tumor specimens were never frozen or fixed in any way, and transported immediately after surgical resection to the lab on ice in media containing DMEM/F12 media (Gibco) + 1% Penicillin/Streptomycin (Corning). Before dissociation, tumor samples were weighed. Tissue mass varied between 0.5 g and 4.68 g. Tumor specimens were then minced using two razor blades and digested overnight in 20–30 mL DMEM/F12 + 5% FBS, 15mM HEPES (Gibco), 1x Glutamax (Gibco), 1x Collagenase/Hyaluronidase (Stem Cell Technologies, 07912), 1% Penicillin/Streptomycin (Corning), and 0.48 μg/mL Hydrocortisone (Stem Cell Technologies, 74144) on a stir plate at 37C and 180 rpm. For ovarian tumors, Gentle Collagenase/Hyaluronidase (Stem Cell Technologies, 07919) was used instead of Collagenase/Hyaluronidase. After digestion, tumor cells were washed twice with cold PBS + 2% FBS and 10mM HEPES (PBS-HF) and centrifuged at 1200 rpm for 5 min at room temperature. To remove red blood cells, the cell pellet was treated with 4 or 8 mL cold Ammonium Chloride Solution (Stem Cell Technologies, 07850) with 1 or 2 mL PBS-HF (ratio 1:4), respectively, for 1 minute, then centrifuged at 1200 rpm for 5 min. The amount of Ammonium Chloride Solution added was based on the size of the cell pellet and visual assessment of pink or red color present in the pellet. This step was repeated a second time if the pellet still exhibited a pink or red color after initial treatment. To further dissociate the cells, pellets were resuspended in 1–2 mL 0.05% Trypsin-EDTA (Gibco) and the suspension was gently pipetted up and down for 1 min. After 1 min, trypsin was inactivated by adding 10mL PBS-HF solution. The suspension was then centrifuged at 1200rpm for 5 min. If cell suspensions were clumpy, cells were resuspended with 1–2 mL Dispase (Stem Cell Technologies, 07923) and 200 μL 1mg/mL DNase I (Stem Cell Technologies, 07900) for 1 min, then inactivated with 10 mL PBS-HF. If the Dispase step was not necessary, cells were treated with DNase I during the trypsinization step. Cells were again centrifuged at 1200 rpm for 5 min, then washed in 10 mL PBS-HF and filtered through a 100μm cell strainer. A final centrifugation step was done at 1200 rpm for 5 min. The cell pellet was resuspended in DMEM/F12 + 5% FBS using a volume based on the final pellet size and filtered using a 40μm cell strainer. Single-cell suspension concentration and cell viability was measured by adding 10 μL 0.4% Trypan Blue to 10 μL cell suspension and measuring with the Countess II Automated Cell Counter (Thermo Fisher, AMQAX1000). We aimed for cell viability above 60% for the cells to be used for single-cell sequencing. Cell viability varied between 64% and 94% across all samples, with the majority of tumor suspensions being over 70% viable.
11 名初治卵巢癌和子宫内膜癌患者被纳入 UNC 癌症医院的“卵巢癌和子宫内膜癌基因组学”研究(IRB 方案 18-3198),并接受了以治愈为目的的减瘤手术以切除他们的肿瘤 ( Table 1 , Table S1 )。对肿瘤标本进行切片以进行病理学审查,其余组织被去标识化并通过 UNC 的组织采购设施收集用于本研究。为了最大限度地减少手术切除肿瘤组织和单细胞基因组学处理之间的时间,我们在医疗专业人员(外科医生/临床研究协调员/临床病理学家)、协调团队(项目经理/病理学技术人员)和我们实验室的研究技术人员之间建立了一条高效的管道手术前手术。肿瘤标本从未以任何方式冷冻或固定,并在手术切除后立即在含有 DMEM/F12 培养基 (Gibco) + 1% 青霉素/链霉素 (Corning) 的培养基中用冰运输到实验室。解离前,称量肿瘤样本。组织质量在 0.5 g 和 4.68 g 之间变化。然后用两把剃须刀片将肿瘤标本切碎,并在 20–30 mL DMEM/F12 + 5% FBS、15 mM HEPES (Gibco)、1x 谷氨酰胺 (Gibco)、1x 胶原酶/透明质酸酶 (Stem Cell Technologies, 07912)、1% 青霉素/链霉素 (Corning) 和 0.48 μg/mL 氢化可的松 (Stem Cell Technologies, 74144) 中以 37C 和 180 rpm 的转速在搅拌板上消化过夜。对于卵巢肿瘤,使用温和的胶原酶/透明质酸酶 (Stem Cell Technologies, 07919) 代替胶原酶/透明质酸酶。消化后,用冷 PBS + 2% FBS 和 10mM HEPES (PBS-HF) 洗涤肿瘤细胞两次,并在室温下以 1200 rpm 离心 5 分钟。 为了去除红细胞,分别用 4 mL 或 8 mL 冷氯化铵溶液(Stem Cell Technologies,07850)和 1 或 2 mL PBS-HF(比例 1:4)处理细胞沉淀 1 分钟,然后以 1200 rpm 离心 5 分钟。氯化铵溶液的添加量基于细胞沉淀的大小和对沉淀中存在的粉红色或红色的目视评估。如果沉淀在初始处理后仍呈现粉红色或红色,则重复第二次此步骤。为了进一步解离细胞,将沉淀重悬于 1–2 mL 0.05% 胰蛋白酶-EDTA (Gibco) 中,并将悬浮液轻轻上下移液 1 分钟。1 分钟后,加入 10 mL PBS-HF 溶液灭活胰蛋白酶。然后将悬浮液以 1200 rpm 离心 5 分钟。如果细胞悬液结块,则用 1-2 mL 分散酶 (Stem Cell Technologies, 07923) 和 200 μL 1 mg/mL DNase I (Stem Cell Technologies, 07900) 重悬细胞 1 分钟,然后用 10 mL PBS-HF 灭活。如果不需要分散酶步骤,则在胰蛋白酶消化步骤中用 DNase I 处理细胞。再次将细胞以 1200 rpm 离心 5 分钟,然后在 10 mL PBS-HF 中洗涤并通过 100 μm 细胞过滤器过滤。最后的离心步骤以 1200 rpm 的速度进行 5 min。将细胞沉淀重悬于 DMEM/F12 + 5% FBS 中,使用基于最终沉淀大小的体积,并使用 40 μm 细胞过滤器过滤。向 10 μL 细胞悬液中加入 10 μL 0.4% 台盼蓝,并使用 Countess II 自动细胞计数仪(Thermo Fisher,AMQAX1000)测量,测量单细胞悬液浓度和细胞活力。我们的目标是将用于单细胞测序的细胞活力提高到 60% 以上。 所有样品的细胞活力在 64% 到 94% 之间变化,大多数肿瘤悬液的活力超过 70%。
Cell Culture
OVCAR3 and HEK-293T cell lines were obtained from ATCC. OVCAR3 cells were grown in RPMI media (Gibco, 11875–093) supplemented with 10% FBS (Sigma) and 1% penicillin/streptomycin (Corning). HEK-293T cells were grown in Dulbecco’s Modified Eagle’s Medium (DMEM) (Gibco, 11995065) supplemented with 10% FBS and 1% penicillin/streptomycin. OVCAR3-dCas9-KRAB-blast (OVCAR3-KRAB) cells were grown in RPMI media supplemented with 10% FBS, 1% penicillin/streptomycin and 1 μg/mL blasticidin (Corning, 30100RB) after selection. All cell cultures were incubated at 37 °C in 5% CO2. Before use, OVCAR3 cells were authenticated with Short Tandem Repeat profiling through ATCC. All cell lines were tested for mycoplasma.
METHOD DETAILS 方法详细信息
Single-cell Sequencing 单细胞测序
To continue with scRNA-seq, the cell suspension was diluted to 1200 cells/μL. 10,000 cells were used to prepare scRNA-seq libraries using the following 10x Genomics Single Cell 3’ kits: Chromium Single Cell 3’ GEM, Library & Gel Bead Kit v3 (PN-1000075), Chromium Chip B Single Cell Kit (PN-10000153), and Chromium i7 Multiplex Kit (PN-120262) following the manufacturer’s protocol.
为了继续 scRNA-seq,将细胞悬液稀释至 1200 个细胞/μL。使用以下 10x Genomics 单细胞 3'试剂盒:Chromium 单细胞 3' GEM,文库和凝胶珠试剂盒 v3(PN-1000075),Chromium 芯片 B 单细胞试剂盒(PN-10000153)和 Chromium i7 多路复用试剂盒(PN-120262)按照制造商的方案进行制备。
To continue with scATAC-seq, 500,000 cells were used in nuclei isolation following the Nuclei Isolation for Single Cell ATAC Sequencing protocol from 10x Genomics. For the lysis step, cells were lysed for 4 min. For the resuspension step, nuclei were resuspended in 50 μL 1x Nuclei Buffer. Nuclei were counted by adding 10 μL 0.4% Trypan Blue to 10 μL nuclei suspension and counted with the Countess II Automated Cell Counter. 10,000 nuclei were then used in library preparation using the following 10x Genomics Single Cell ATAC Kits: Chromium Single Cell ATAC Library & Gel Bead Kit v1 (PN-1000110), Chromium Chip E Single Cell ATAC Kit (PN-1000082), and Chromium i7 Multiplex Kit N, Set A (PN-1000084) following the manufacturer’s protocol. All libraries were sequenced using the 10X Genomics suggested sequencing parameters on an Illumina NextSeq 500 instrument.
为了继续 scATAC-seq,按照 10x Genomics 的单细胞 ATAC 测序细胞核分离方案,使用 500,000 个细胞进行细胞核分离。对于裂解步骤,将细胞裂解 4 分钟。对于重悬步骤,将细胞核重悬于 50 μL 1x 细胞核缓冲液中。向 10 μL 细胞核悬液中加入 10 μL 0.4% 台盼蓝对细胞核进行计数,并使用 Countess II 全自动细胞计数仪进行计数。然后使用以下 10x Genomics 单细胞 ATAC 试剂盒将 10,000 个细胞核用于文库制备:Chromium 单细胞 ATAC 文库和凝胶珠套件 v1(PN-1000110),Chromium 芯片 E 单细胞 ATAC 试剂盒(PN-1000082,和 Chromium i7 多路复用试剂盒 N,Set A(PN-1000084)遵循制造商的协议。在 Illumina NextSeq 500 仪器上使用 10X Genomics 建议的测序参数对所有文库进行测序。
Engineering OVCAR3-dCas9-KRAB cells
Lentivirus containing the Lenti-dCas9-KRAB-blast vector(Xie et al., 2017) (Addgene #89567) was packaged in HEK-293T cells. HEK-293T cells were seeded in a T75 flask and transfected with the following plasmids: 6.67 μg Lenti-dCas9-KRAB-blast, 5 μg psPAX2 (gift from Didier Trono, Addgene #12260), and 3.33 μg PMD2G (gift from Didier Trono, Addgene #12259) using Fugene 6 (Promega, E2691) following the manufacturer’s protocol. The lentivirus containing supernatant was harvested 48–72 hours after transfection and lentivirus was concentrated using Lenti-X Concentrator (Takara, 631231) following the manufacturer’s protocol. OVCAR3 cells were seeded in a six-well plate at 50,000 cells/well and transduced with the harvested lentivirus in RPMI media with 10% FBS and 10 μg/mL polybrene (Millipore, TR1003G). Transduced cells were incubated with lentivirus for 72 hours, then placed in RPMI selection media with 3 μg/mL blasticidin for 7 days. Batch selected OVCAR3-KRAB cells were validated by western blot. For western blot analysis, cells were lysed using the following lysis buffer: 50 mM Tris HCl (pH 8), 0.5 M NaCl, 1% NP-40, 0.5% sodium deoxycholate, 0.1% SDS and 1x protease inhibitor. The primary antibodies used for Western blotting were as follows: Anti-beta Tubulin Loading Control (Abcam, ab6046), Anti-Cas9 Antibody (7A9–3A3) (Santa Cruz Biotechnology, sc-517386). The β-tubulin antibody was used at a 1:1500 dilution in 5% BSA in TBST with overnight incubation at 4°C. The Cas9 antibody was used at a 1:1500 dilution in 5% BSA in TBST with overnight incubation at 4°C. The secondary antibodies used for Western blotting were as follows: Donkey anti-rabbit IgG, Whole Ab, HRP-conjugated (GE Healthcare, NA934) and Donkey anti-Mouse IgG (H+L), HRP-conjugated (Thermo Fisher Scientific, PA1–28748). Secondary antibodies were used at a 1:5000 dilution in 5% BSA in TBST.
sgRNA Design and Vector Cloning
sgRNA 设计和载体克隆
sgRNAs targeting Enhancer 2 and Enhancer 3 were designed using the CRISPOR web tool(Concordet and Haeussler, 2018). Two sgRNAs targeting unique regions of each enhancer were designed to be transfected together. The negative control sgRNA (sgScramble) used was previously published(Lawhorn et al., 2014). The sgRNA cloning vector pX-sgRNA-eGFP-MI is a modified version of pSpCas9(BB)-2A-Puro (pX459) v2.0(Ran et al., 2013) (Addgene #62988). Cas9 was removed from pX459 and replaced with eGFP to allow for visualization of sgRNA expression. To improve sgRNA stability and optimize for assembly with dCas9, the sgRNA stem-loop was extended and modified with an A-U base pair flip(Chen et al., 2013). sgRNA vector cloning was done following the protocol from Feng Zheng’s group(Ran et al., 2013). Briefly, sgRNA oligonucleotides were ordered from Integrated DNA Technologies (IDT). Oligonucleotides were duplexed with the following reaction: 10 μM sgRNA forward oligo, 10 μM sgRNA reverse oligo, 10 U T4 polynucleotide kinase (NEB, M0201L), and 1x T4 ligation buffer under the following conditions: 37°C for 30 minutes, 95°C for 5 minutes, then ramp down to 25°C at 5°C/minute. Duplexed sgRNAs were diluted 1:100, then 2 μL of this dilution was used in a ligation reaction with 100 ng pX-sgRNA-eGFP-MI linearized with BbsI-HF (NEB, R3539S). The ligation product was transformed into Subcloning Efficiency DH5alpha Competent Cells (Invitrogen, 18265017) following the manufacturer’s protocol. Each completed sgRNA vector was verified by Sanger sequencing using the human U6 promoter sequencing primer (GGC-CTA-TTT-CCC-ATG-ATT-CC). sgRNA oligonucleotide sequences can be found in Table S6.
靶向增强子 2 和增强子 3 的 sgRNA 是使用 CRISPOR 网络工具 () 设计的 Concordet and Haeussler, 2018 。两个靶向每个增强子独特区域的 sgRNA 被设计为一起转染。使用的阴性对照 sgRNA (sgScramble) 之前已发表 ( Lawhorn et al., 2014 )。sgRNA 克隆载体 pX-sgRNA-eGFP-MI 是 pSpCas9(BB)-2A-Puro (pX459) v2.0( Ran et al., 2013 ) (Addgene #62988) 的修饰版本。从 pX459 中去除 Cas9 并用 eGFP 代替,以便观察 sgRNA 表达。为了提高 sgRNA 稳定性并优化与 dCas9 的组装,sgRNA 茎环被扩展并通过 A-U 碱基对翻转 () 修饰 Chen et al., 2013 。sgRNA 载体克隆是按照 Feng Zheng 小组 ( ) 的方案进行的 Ran et al., 2013 。简而言之,sgRNA 寡核苷酸是从 Integrated DNA Technologies (IDT) 订购的。寡核苷酸与以下反应进行双重反应:10 μM sgRNA 正向寡核苷酸、10 μM sgRNA 反向寡核苷酸、10 U T4 多核苷酸激酶(NEB,M0201L)和 1x T4 连接缓冲液,在以下条件下:37°C 30 分钟,95°C 5 分钟,然后以 5°C/min 的速度升至 25°C。将双链 sgRNA 以 1:100 的比例稀释,然后将 2 μL 该稀释液用于与 100 ng pX-sgRNA-eGFP-MI 进行连接反应,该反应由 BbsI-HF(NEB,R3539S)线性化。按照制造商的方案将连接产物转化到亚克隆效率 DH5alpha 感受态细胞 (Invitrogen, 18265017) 中。使用人 U6 启动子测序引物 (GGC-CTA-TTT-CCC-ATG-ATT-CC) 通过 Sanger 测序验证每个完成的 sgRNA 载体。sgRNA 寡核苷酸序列可以在 Table S6 中找到。
CRISPRi
OVCAR3-KRAB cells were seeded in 6-well plates at 200,000 cells/well using antibiotic-free RPMI media supplemented with 10% FBS. After 24 hours, cells were transfected with a total of 1.5 μg sgRNA vector per well using Fugene 6 (Promega, E2691) following the manufacturer’s protocol. For the negative control well (Scramble), a single sgRNA vector was transfected. For wells targeting Enhancer 2 and Enhancer 3, two unique sgRNAs were co-transfected in each well. 72 hours after transfection, cells were visualized for GFP expression to ensure good transfection efficiency. Cells were then washed with 1x PBS and RNA was extracted using the Zymo Quick-RNA Miniprep Kit (Zymo, R1055) with on-column DNaseI treatment. The experiment was conducted three times to ensure reproducibility.
使用补充有 10% FBS 的不含抗生素的 RPMI 培养基,以 200,000 个细胞/孔的 6 孔板接种 OVCAR3-KRAB 细胞。24 小时后,按照制造商的方案,使用 Fugene 6 (Promega, E2691) 每孔用总共 1.5 μg sgRNA 载体转染细胞。对于阴性对照孔 (Scramble),转染单个 sgRNA 载体。对于靶向 Enhancer 2 和 Enhancer 3 的孔,在每个孔中共转染两个独特的 sgRNA。转染后 72 小时,观察细胞的 GFP 表达,以确保良好的转染效率。然后用 1x PBS 洗涤细胞,并使用 Zymo Quick-RNA 小量制备试剂盒 (Zymo, R1055) 和柱上 DNaseI 处理提取 RNA。为确保重现性,实验进行了 3 次。
RNAi
OVCAR3 cells were seeded in 6-well plates at 150,000 cells per well in antibiotic-free RPMI media. After 24 hours, cells were transfected with 40 nM of siRNA (siGENOME SMARTpool, Dharmacon) using 3 μL RNAiMAX (Invitrogen, 13778075) following the manufacturer’s protocol. After 48 hours, wells were washed with 1x PBS and RNA was extracted using the Zymo Quick-RNA Miniprep Kit (Zymo, R1055) with on-column DNaseI treatment. The experiment was conducted three times to ensure reproducibility. The siRNA sequences can be found in Table S7.
RT-qPCR
RNA extracted from CRISPRi and RNAi experiments was treated with the Turbo DNA-free Kit (Invitrogen, AM1907) following the manufacturer’s protocol to ensure removal of all genomic DNA. Next, 2 μg of RNA was reverse-transcribed using the iScript cDNA Synthesis Kit (BioRad, 1708891) following the manufacturer’s protocol. The resulting cDNA was analyzed by qPCR with SYBR Green using the QuantStudio 6 Flex System (Applied Biosystems) and the primers listed below. mRNA expression was normalized to ACTB using the 2-ΔΔCT method. All experiments were conducted three times to ensure reproducibility. Results are shown as the mean fold change ± S.E.M. Statistical analysis was conducted with the GraphPad Prism 9.0.0 software using Welch’s one-tailed t-test. Statistical significance is indicated by *p<0.05, **p<0.01, ***p<0.001, and ****p<0.0001. Primer oligonucleotide sequences can be found in Table S8.
Single-cell RNA-seq Quantification and Quality Control (QC)
单细胞 RNA-seq 定量和质量控制 (QC)
Raw andfiltered feature-barcode matrices for each patient tumor sample were generated using 10x Genomics Cell Ranger. For each patient tumor sample, the filtered feature-barcode matrix was then converted into a Seurat object using the Seurat R package (Stuart et al., 2019, Team, 2020). To enrich for high quality cells in each patient dataset, QC and doublet removal were performed for each patient dataset individually. First, outlier cells were defined in each of the following metrics: log(UMI counts) (>2 MADs, low end), log(number of genes expressed) (>2 MADs, low end) and log(percent mitochondrial read count +1) (>2 MADs, high end)(McCarthy et al., 2017). Only non-outlier cells meeting all three criteria were kept for doublet detection. Note that for the two lowest viability samples, collected from Patients 2 & 7, we had to manually set these QC thresholds. To reduce the false positive rate in doublet calling, only cells marked as doublets by both DoubletDecon(DePasquale et al., 2019) and DoubletFinder(McGinnis et al., 2019) were removed from downstream analysis. After QC and doublet removal for each patient dataset, the individual patient datasets were combined using Seurat’s merge() to form each patient cohort presented in this study (All patients, endometrioid endometrial cancer (EEC), high-grade serous ovarian cancer (HGSOC)).
使用 10x Genomics Cell Ranger 生成每个患者肿瘤样本的原始和过滤特征条形码矩阵。对于每个患者的肿瘤样本,然后使用 Seurat R 包 ( Stuart et al., 2019 , Team, 2020 ) 将过滤后的特征条形码矩阵转换为 Seurat 对象。为了在每个患者数据集中富集高质量细胞,对每个患者数据集分别进行 QC 和双峰去除。首先,在以下每个指标中定义异常细胞:log(UMI 计数)(>2 MAD,低端)、log(表达的基因数)(>2 MAD,低端)和 log(线粒体读取计数百分比 +1)(>2 MAD,高端)( McCarthy et al., 2017 )。仅保留满足所有三个标准的非异常细胞进行双峰检测。请注意,对于从患者 2 和 7 收集的两个最低活力样本,我们必须手动设置这些 QC 阈值。为了降低双峰检出中的假阳性率,仅从下游分析中删除了被 DoubletDecon( DePasquale et al., 2019 ) 和 DoubletFinder( McGinnis et al., 2019 ) 标记为双峰的单元格。在对每个患者数据集进行 QC 和双峰去除后,使用 Seurat 的 merge() 合并单个患者数据集,以形成本研究中呈现的每个患者队列 (所有患者、子宫内膜样子宫内膜癌 (EEC)、高级别浆液性卵巢癌 (HGSOC))。
Single-cell RNA-seq normalization, feature selection and clustering
单细胞 RNA-seq 归一化、特征选择和聚类
Gene expression matrices were normalized using Seurat’s NormalizeData() with the normalization method set to “LogNormalize.” Feature selection was performed with Seurat’s FindVariableFeatures()with the selection method set to “vst” and the number of top variable features set to 2,000. Before principal component analysis (PCA), we scaled the expression for all genes in the dataset using Seurat’s ScaleData(). We opted not to regress out UMI counts per cell because either 1) PC1 was not correlated to UMI counts per cell or 2) evidence of biological variation was found in PC1 based on the number of inferred CNVs and cell type gene signature enrichment. We opted not to regress out percent mitochondrial read count per cell because it could represent meaningful biological variation as increased metabolic activity is a hallmark feature of cancer cells. The top 2,000 most variable genes were summarized by PCA into 50 principal components (PCs) and the cells were visualized in a two-dimensional UMAP embedding using Seurat’s RunUMAP() with all 50 PCs, as suggested by the results of Seurat’s JackStraw() (data not shown). To identify groups of transcriptionally distinct cells, graph-based Louvain clustering was performed using Seurat’s FindNeighbors() with all 50 PCs and Seurat’s FindClusters() with a resolution of 0.7. scRNA-seq UMAP plots were generated in R(Team, 2020) using ggplot2(Wickham, 2016).
使用 Seurat 的 NormalizeData() 对基因表达矩阵进行归一化,并将归一化方法设置为“LogNormalize”。使用 Seurat 的 FindVariableFeatures() 执行特征选择,选择方法设置为 “vst”,顶部变量特征的数量设置为 2,000。在主成分分析 (PCA) 之前,我们使用 Seurat 的 ScaleData() 缩放了数据集中所有基因的表达。我们选择不回归每个细胞的 UMI 计数,因为 1) PC1 与每个细胞的 UMI 计数无关,或者 2) 根据推断的 CNV 数量和细胞类型基因特征富集,在 PC1 中发现了生物学变异的证据。我们选择不回归每个细胞的线粒体读取计数百分比,因为它可能代表有意义的生物学变异,因为代谢活性增加是癌细胞的标志性特征。PCA 将前 2,000 个最可变的基因总结为 50 个主成分 (PC),并使用 Seurat 的 RunUMAP() 对所有 50 个 PC 进行二维 UMAP 嵌入,如 Seurat 的 JackStraw() 的结果所示(数据未显示)。为了识别转录不同的细胞组,使用 Seurat 的 FindNeighbors() 对所有 50 台 PC 和 Seurat 的 FindClusters() 以 0.7 的分辨率执行基于图的鲁汶聚类。scRNA-seq UMAP 图是使用 ggplot2( Team, 2020 ) 在 R( ) 中生成的 Wickham, 2016 。
Inference of copy number variation (CNV) from single-cell RNA-seq
从单细胞 RNA-seq 推断拷贝数变异 (CNV)
For each patient tumor sample,putative copy number events were inferred for each cell cluster using the R package inferCNV(Tickle, 2019). To determine which cell clusters would serve as a normal background, each cell was scored for enrichment in the ESTIMATE immune gene signature(Yoshihara et al., 2013) and in the PanglaoDB(Franzen et al., 2019) plasma cell gene signature using Seurat’s AddModuleScore(). Cell clusters having a median enrichment score >0.1 in either of these gene signatures were deemed as normal immune cell types and were used as a normal background for inferCNV. The remaining cell clusters, representing the remaining cellular fraction of the tumor, were specified in inferCNV annotations file to infer CNVs at the level of these clusters. The standard inferCNV algorithm was invoked with infercnv::run() with cutoff set to “0.1”, denoise set to “TRUE”, scale_data set to “TRUE” and HMM set to “TRUE”. The default i6 Hidden Markov Model (HMM) was used to predict CNV levels based on a six-state CNV model ranging from complete loss to >2 copies. The Bayesian Network Latent Mixture Model was used to estimate the posterior probability of each CNV level at each predicted CNV region. CNV regions with a posterior probability of a normal diploid state <0.05 were deemed as putative CNV events and were further used to justify the CNV status of each cluster (and thus the CNV status for each cell). The inferred CNVs determined individually for each patient dataset were retained after combining multiple patient datasets into the different patient cohort datasets. Box plots showing the number of inferred CNV events in each cell type subcluster were generated in R(Team, 2020) using ggplot2(Wickham, 2016).
对于每个患者的肿瘤样本,使用 R 包 inferCNV( ) 推断每个细胞簇的推定拷贝数事件 Tickle, 2019 。为了确定哪些细胞簇将作为正常背景,使用 Seurat 的 AddModuleScore() 对每个细胞在 ESTIMATE 免疫基因特征 () Yoshihara et al., 2013 和 PanglaoDB( Franzen et al., 2019 ) 浆细胞基因特征中的富集进行评分。在这些基因特征中的任何一个中位富集评分 >0.1 的细胞簇被认为是正常的免疫细胞类型,并被用作 inferCNV 的正常背景。在 inferCNV 注释文件中指定代表肿瘤剩余细胞部分的剩余细胞簇,以推断这些簇水平的 CNV。标准 inferCNV 算法是使用 infercnv::run() 调用的,截止设置为 “0.1”,降噪设置为 “TRUE”,scale_data 设置为 “TRUE”,HMM 设置为 “TRUE”。默认的 i6 隐马尔可夫模型 (HMM) 用于根据从完全丢失到 >2 拷贝的六态 CNV 模型预测 CNV 水平。贝叶斯网络潜在混合模型用于估计每个预测 CNV 区域每个 CNV 水平的后验概率。具有正常二倍体状态 <0.05 的后验概率的 CNV 区域被视为推定的 CNV 事件,并进一步用于证明每个簇的 CNV 状态(以及每个细胞的 CNV 状态)。将多个患者数据集组合到不同的患者队列数据集中后,保留为每个患者数据集单独确定的推断 CNV。显示每个细胞类型子集群中推断的 CNV 事件数量的箱形图是在 R( Team, 2020 ) 中使用 ggplot2( )生成的 Wickham, 2016 。
Single-cell RNA-seq cell type annotation
单细胞 RNA-seq 细胞类型注释
Cell type annotation was performed using a combination of 1) reference-based annotation with the R package SingleR(Aran et al., 2019) and 2) gene signature enrichment with Seurat’s AddModuleScore(). After QC, doublet removal, and dimension reduction for each patient dataset, single cells were annotated to known cell types using SingleR with a reference scRNA-seq dataset. Datasets for Patients 1–5 were annotated based on a reference scRNA-seq dataset from the human endometrium(Wang et al., 2020). Datasets forPatients 6–11 were annotated based on a reference scRNA-seq dataset from a human ovarian tumor (sample ID: HTAPP-624-SMP-3212)(Slyper et al., 2020). The individual patient datasets were then combined using Seurat’s merge() to form each patient cohort presented in this study and subsequently reprocessed according to the normalization, feature selection and clustering methods described previously. The resulting clusters in each patient cohort dataset were annotated based on the majority cell type label within each cluster. Finally, SingleR cell type annotations were verified by calculating single cell enrichment scores for cell type gene signatures from PangladoDB(Franzen et al., 2019) using Seurat’s AddModuleScore(). The cell type annotations for each cluster were then modified to include the cluster number identity hyphened with the cell type identity. To identify malignant cell clusters, MUC16/CA125 and WFDC2/HE4 expression levels were used to identify EC and OC (Duffy et al., 2005, Sturgeon et al., 2008, Hellström et al., 2003, Li et al., 2009, Dong et al., 2017) and KIT/CD117 expression level was used to identify GIST(Sarlomo-Rikala et al., 1998). A cluster was deemed malignant if it had inferCNV events and/or statistically significant increased expression (Wilcoxon Rank Sum test, Bonferroni-corrected p-value <0.01) of any of these markers relative to the predicted non-malignant fraction (Figure S4, Figure S11, Figure S15). These criteria defined the final cell type subcluster identities for scRNA-seq that were used in label transferring to the matching scATAC-seq data.
使用 1) 基于 Reference 的注释与 R 包 SingleR( Aran et al., 2019 ) 和 2) 基因特征富集与 Seurat 的 AddModuleScore() 的组合进行细胞类型注释。在对每个患者数据集进行 QC、双峰去除和降维后,使用 SingleR 和参考 scRNA-seq 数据集将单个细胞注释为已知细胞类型。患者 1-5 的数据集根据来自人类子宫内膜的参考 scRNA-seq 数据集进行注释 ( Wang et al., 2020 )。患者 6-11 的数据集基于来自人类卵巢肿瘤的参考 scRNA-seq 数据集(样本 ID:HTAP P-624-SMP-3212)( Slyper et al., 2020 )进行注释。 然后使用 Seurat 的 merge() 将单个患者数据集组合在一起,以形成本研究中介绍的每个患者队列,随后根据前面描述的标准化、特征选择和聚类方法进行重新处理。每个患者队列数据集中生成的聚类根据每个聚类中的大多数细胞类型标签进行注释。最后,通过使用 Seurat 的 AddModuleScore() 计算 PangladoDB( Franzen et al., 2019 ) 中细胞类型基因特征的单细胞富集分数来验证 SingleR 细胞类型注释。然后修改每个集群的单元类型注释,以包含与单元类型标识连字符的集群编号标识。为了鉴定恶性细胞簇,采用 MUC16/CA125 和 WFDC2/HE4 表达水平鉴定 EC 和 OC ( Duffy et al., 2005 , Sturgeon et al., 2008 , Hellström et al., 2003 , Li et al., 2009 Dong et al., 2017 , ),用 KIT/CD117 表达水平鉴定 GIST( Sarlomo-Rikala et al., 1998 )。 如果一个簇相对于预测的非恶性分数 ( Figure S4 , Figure S11 , Figure S15 ) 具有推断 CNV 事件和/或这些标志物中任何一个具有统计学意义的表达增加 (Wilcoxon Rank Sum 检验,Bonferroni 校正的 p 值 <0.01),则认为该簇是恶性的。这些标准定义了 scRNA-seq 的最终细胞类型子集群身份,这些身份用于标签转移到匹配的 scATAC-seq 数据。
Calculating enrichment of gene signatures in single-cell RNA-seq
Single-cell gene signature enrichment was calculated using Seurat’s AddModuleScore() with the search parameter set to “TRUE” to find aliases for gene names. Gene signature enrichment for pseudo-bulk clusters was performed using the R package GSVA(Hanzelmann et al., 2013). To generate pseudo-bulk transcriptome profiles for each cluster as shown in Figure S18, raw gene counts were summed across all cells in each cluster. The resulting matrix of genes by n clusters was then used as input into GSVA with the method argument set to “gsva” and the kcdf argument set to “Poisson.” Gene signature enrichment violin plots and/or boxplots were generated in R(Team, 2020) using ggplot2(Wickham, 2016).
Single-cell ATAC-seq quality control (QC)
单细胞 ATAC-seq 质量控制 (QC)
For each patient tumor sample, a list of unique ATAC-seq fragments with associated barcodeswas generated using 10x Genomics Cell Ranger ATAC. The list of unique fragments per barcode for each patient tumor sample was read into the R package ArchR(Granja et al., 2021) to perform quality control and doublet removal for each patient dataset individually. To enrich for cellular barcodes, we took advantage of the bimodal distributions in log10(TSS enrichement+1) and in log10(number of unique fragments) characterizing two different populations of barcodes (cellular and non-cellular). Barcode cutoff thresholds for log10(TSS enrichement+1) and log10(number of unique fragments) were estimated using a Gaussian Mixture Model (GMM) for each metric, as implemented in the R package mclust(Scrucca et al., 2016). Only barcodes above these estimated thresholds in both metrics were kept as cellular barcodes for doublet detection. Note that for our lowest viability samples, collected from Patients 2 & 7, we manually set these QC thresholds. Doublet enrichment scores were calculated for cellular barcodes using ArchR’s addDoubletScores() with the knnMethod set to “UMAP.” Cellular barcodes with doublet enrichment scores >1 were marked as potential doublets and subsequently removed based on the filterRatio parameter of ArchR’s filterDoublets() function.
对于每个患者的肿瘤样本,使用 10x Genomics Cell Ranger ATAC 生成带有相关条形码的独特 ATAC-seq 片段列表。将每个患者肿瘤样本的每个条形码的唯一片段列表读取到 R 包 ArchR( Granja et al., 2021 ) 中,以单独对每个患者数据集进行质量控制和双峰去除。为了丰富细胞条形码,我们利用了 log10 (TSS 富集 + 1) 和 log10 (唯一片段数)中的双峰分布来表征两种不同的条形码群体 (细胞和非细胞)。log10(TSS 富集 + 1)和 log10(唯一片段数)的条形码截止阈值是使用高斯混合模型 (GMM) 为每个指标估计的,如 R 包 mclust( )中实现 Scrucca et al., 2016 的那样。只有高于这两个指标中这些估计阈值的条形码才会被保留为蜂窝条形码,以便进行双峰检测。请注意,对于我们从患者 2 和 7 收集的最低活力样本,我们手动设置这些 QC 阈值。使用 ArchR 的 addDoubletScores() 计算细胞条形码的双峰富集分数,并将 knnMethod 设置为 “UMAP”。具有双峰富集分数 >1 的细胞条形码被标记为潜在的双峰,随后根据 ArchR 的 filterDoublets() 函数的 filterRatio 参数删除。
Single-cell ATAC-seq quantification, feature selection and integration with single-cell RNA-seq
单细胞 ATAC-seq 定量、特征选择和与单细胞 RNA-seq 的整合
We opted not to use the peak-barcode matrices generated by Cell Ranger ATAC because these peaks were called in a pooled/bulk setting (i.e. using all fragments captured by the assay in such a way that is agnostic to barcode identity). This would effectively drown out the signal from rare cell types present in the dataset. Therefore, we used the R package ArchR(Granja et al., 2021) to construct an initial feature matrix of 500 bp genomic tiles across all cells in each patient cohort. To reduce dimensions of the genomic tile features, we adopted the iterative latent semantic indexing(Cusanovich et al., 2015, Satpathy et al., 2019, Granja et al., 2019) (LSI) procedure implemented in the ArchR R package(Granja et al., 2021). Briefly, this procedure performs term frequency-inverse document frequency (TF-IDF) normalization to upweight more informative features followed by an initial LSI reduction on the top accessible tiles. Graph-based Louvain clustering is used to identify low resolution clusters in which feature counts are summed across all cells in each cluster to identify the top 25,000 most variable features across clusters. This procedure was iterated once more by inputting the top 25,000 most variable tiles from iteration 1 as the top accessible tiles in iteration 2. The iterative LSI procedure computed 50 LSI dimensions that were then collapsed further into a two dimensional UMAP embedding using ArchR’s addUMAP() with the same UMAP parameters used in Seurat’s RunUMAP(). LSI dimensions that were correlated with sequencing depth (>0.75, Pearson correlation) were not included in downstream analysis. scATAC-seq UMAP plots were generated in R(Team, 2020) using ggplot2(Wickham, 2016).
我们选择不使用 Cell Ranger ATAC 生成的峰条形码基质,因为这些峰是在混合/批量设置中调用的(即以与条形码身份无关的方式使用分析捕获的所有片段)。这将有效地淹没数据集中存在的稀有细胞类型的信号。因此,我们使用 R 包 ArchR( Granja et al., 2021 ) 构建了每个患者队列中所有细胞的 500 bp 基因组图块的初始特征矩阵。为了减小基因组瓦片特征的维度,我们采用了在 ArchR R 包( )中实现的迭代潜在语义索引( Cusanovich et al., 2015 , Satpathy et al., 2019 , Granja et al., 2019 ) (LSI) 程序 Granja et al., 2021 。简而言之,此过程执行术语频率-逆文档频率 (TF-IDF) 规范化,以增加信息量更大的特征,然后在顶部可访问的磁贴上初始减少 LSI。基于图的鲁汶聚类用于识别低分辨率聚类,其中每个聚类中所有单元的特征计数相加,以确定聚类中变量最多的 25,000 个特征。通过将迭代 1 中的前 25,000 个可变图块输入为迭代 2 中可访问量最大的图块,再次迭代此过程。迭代 LSI 过程计算了 50 个 LSI 维度,然后使用 ArchR 的 addUMAP() 进一步折叠成二维 UMAP 嵌入,并使用与 Seurat 的 RunUMAP() 相同的 UMAP 参数。与测序深度相关的 LSI 维度 (>0.75,Pearson 相关性) 不包括在下游分析中。scATAC-seq UMAP 图是使用 ggplot2( Team, 2020 ) 在 R( ) 中生成的 Wickham, 2016 。
Before transferring labels from scRNA-seq to scATAC-seq, gene activity scores were inferred in scATAC-seq using ArchR’s addGeneScoreMatrix(). Briefly, this method uses the following features to estimate gene activity: 1) fragment counts mapping to the gene body, 2) an exponential weighting function to give higher weights to fragment counts closer to the gene and lower weights to fragment counts father away from the gene, and 3) gene boundaries to prevent the contribution of fragments from other genes. Seurat’s CCA implementation(Stuart et al., 2019) in FindTransferAnchors() and TransferData() was used to assign each of the scATAC-seq cells a cell type subcluster identity from the matching scRNA-seq data and an associated label prediction score. This label transferring procedure was constrained to only align cells of the same patient dataset (e.g. Patient 1 scATAC-seq cells were assigned only to cell type subclusters represented by Patient 1 scRNA-seq cells). All scATAC-seq cells were included in UMAP visualization and in calculating patient contribution per cluster, but only scATAC-seq cells with a label prediction score >0.5 were included in downstream analyses. Also, only inferred cell type subclusters with >10 cells were included in downstream analysis to ensure enough cells for peak calling in each cluster. This criterion was raised to >30 cells for the HGSOC patient cohort analysis. After scATAC-seq cells received a cell type subcluster label, pseudo-bulk replicates were generated for each inferred cell type subcluster in the R package ArchR(Granja et al., 2021) and pseudo-bulk peak calling was performed within each inferred cell type subcluster using MACS2(Zhang et al., 2008, Liu, 2014). ArchR’s default iterative overlap procedure was used to merge all peak calls into a single peak by barcode matrix across all cellular barcodes in each patient cohort dataset. Genomic browser tracks displaying the pseudo-bulk ATAC-seq coverage patterns within cell types were generated using ArchR’s plotBrowserTrack() function(Granja et al., 2021).
在将标签从 scRNA-seq 转移到 scATAC-seq 之前,使用 ArchR 的 addGeneScoreMatrix() 在 scATAC-seq 中推断基因活性分数。简而言之,该方法使用以下特征来估计基因活性:1) 映射到基因体的片段计数,2) 指数加权函数,为更靠近基因的片段计数提供更高的权重,为远离基因的片段计数提供较低的权重,以及 3) 基因边界以防止来自其他基因的片段的贡献。Seurat 在 FindTransferAnchors() 和 TransferData() 中的 CCA 实现 () Stuart et al., 2019 用于为每个 scATAC-seq 细胞分配一个来自匹配 scRNA-seq 数据的细胞类型子集群身份和相关的标签预测分数。该标签转移程序被限制为仅对齐同一患者数据集的细胞(例如,患者 1 scATAC-seq 细胞仅分配给由患者 1 scRNA-seq 细胞表示的细胞类型亚簇)。所有 scATAC-seq 细胞都包含在 UMAP 可视化和计算每个集群的患者贡献中,但只有标签预测评分为 >0.5 的 scATAC-seq 细胞被纳入下游分析。此外,下游分析中仅包括具有 >10 细胞的推断细胞类型子簇,以确保每个簇中有足够的细胞进行峰检出。该标准提高到 >30 细胞用于 HGSOC 患者队列分析。在 scATAC-seq 细胞收到细胞类型子簇标签后,为 R 包 ArchR( Granja et al., 2021 ) 中的每个推断细胞类型子簇生成伪批量重复,并使用 MACS2( Zhang et al., 2008 , Liu, 2014 ) 在每个推断的细胞类型子簇内进行伪批量峰值调用。 ArchR 的默认迭代重叠程序用于通过条形码矩阵将每个患者队列数据集中所有细胞条形码的所有峰值调用合并为一个峰值。显示细胞类型中伪批量 ATAC-seq 覆盖模式的基因组浏览器轨道是使用 ArchR 的 plotBrowserTrack() 函数( Granja et al., 2021 )生成的。
Differential gene expression and differential peak accessibility
差异基因表达和差异峰可及性
Differential gene expression analysis in scRNA-seq was performed using Seurat’s FindAllMarkers() with the min.pct set to “0.25” and only.pos set to “FALSE”. This procedure identifies differentially expressed genes (DEGs) between two groups of cells using a Wilcoxon Rank Sum test. Unless otherwise noted in figure legends, DEGs were identified for each cell cluster by comparing the expression values of genes across all cells in a cluster (group 1) relative to the expression values for all remaining cells in the dataset (group 2). We chose a stringent Bonferroni-corrected p-value threshold of 0.01 for determining differentially expressed genes after multiple testing. For some cases, we pooled together malignant clusters to form group 1 and compared against non-malignant clusters to form group 2. For these special cases, we set the min.pct parameter to zero. Differential peak accessibility analysis in scATAC-seq was performed using ArchR’s getMarkerFeatures() with the bias argument set to include both “TSSEnrichment” and “log10(number of fragments)”. This procedure identifies differentially accessibility peaks (DEPs) between two groups of cells using a Wilcoxon Rank Sum test. DEPs were identified for each cell cluster by comparing the accessibility values of peaks across all cells in a cluster (group 1) relative to the accessibility values for a group of background cells matched for TSS enrichment and read depth (group 2). We chose a stringent Benjamini-Hochberg corrected p-value threshold of 0.01 for determining differentially accessible peaks (Log2FC >= 1.25) after multiple testing, and used these thresholds for determining distal marker peaks for the Total Functional Score of Enhancer Elements (TFSEE) analysis (Figure 6, Figure S19-S20).
使用 Seurat 的 FindAllMarkers() 进行 scRNA-seq 中的差异基因表达分析,min.pct 设置为 “0.25”,only.pos 设置为 “FALSE”。该程序使用 Wilcoxon 秩和检验来识别两组细胞之间的差异表达基因 (DEG)。除非图例中另有说明,否则通过比较簇中所有细胞的基因表达值(第 1 组)与数据集中所有剩余细胞(第 2 组)的表达值,确定每个细胞簇的 DEG。我们选择了严格的 Bonferroni 校正 p 值阈值 0.01 来确定多次测试后的差异表达基因。对于某些病例,我们将恶性簇汇集在一起形成第 1 组,并与非恶性簇进行比较形成第 2 组。对于这些特殊情况,我们将 min.pct 参数设置为零。scATAC-seq 中的差分峰可访问性分析是使用 ArchR 的 getMarkerFeatures() 进行的,并将 bias 参数设置为包括 “TSSEnrichment” 和 “log10(number of fragments)” 。此过程使用 Wilcoxon 秩和检验识别两组细胞之间的差异可及性峰 (DEP)。通过比较簇中所有细胞(第 1 组)中峰的可及性值与一组与 TSS 富集和读长深度匹配的背景细胞的可及性值(第 2 组),确定每个细胞簇的 DEP。 我们选择了严格的 Benjamini-Hochberg 校正 p 值阈值 0.01 来确定多次测试后差异可及的峰 (Log2FC >= 1.25),并使用这些阈值来确定增强子元件总功能评分 (TFSEE) 分析的远端标志物峰 ( Figure 6 , Figure S19 - S20 )。
Kaplan-Meier (KM) survival curves
Kaplan-Meier (KM) 生存曲线
All KM plots and hazard ratio statistics for each gene were generated using the Kaplan Meier Plotter web tool(Gyorffy et al., 2012, Nagy et al., 2018, Szasz et al., 2016) available at https://kmplot.com/analysis/. Detailed metadata for each KM analysis, such as datasets used, filtering criteria, etc., are listed in Table S4.
每个基因的所有 KM 图和风险比统计均使用 Kaplan Meier 绘图仪网络工具( Gyorffy et al., 2012 , Nagy et al., 2018 , Szasz et al., 2016 ) 生成,网址为 https://kmplot.com/analysis/ 。中 Table S4 列出了每个 KM 分析的详细元数据,例如使用的数据集、筛选标准等。
To determine the expression cutoff for stratifying patients into high versus low groups, we used the auto select best cutoff option. Briefly, this method involves computing all possible cutoff values between the lower and upper quartiles and choosing the KM plot result with the maximum difference between the p-value and hazard ratio.
为了确定将患者分为高组和低组的表达临界值,我们使用了自动选择最佳临界值选项。简而言之,此方法涉及计算下四分位数和上四分位数之间所有可能的截断值,并选择 p 值和风险比之间差值最大的 KM 图结果。
Pseudo-bulk clustering of patient tumors
患者肿瘤的假性大块聚集
To create a pseudo-bulk transcriptome profile for each patient tumor sample as shown in Figure S9, the raw feature barcode matrix generated by 10x Genomics Cell Ranger (v3.1.0) was collapsed into a single profile by row summing the raw counts across all barcodes (cellular and non-cellular). Only genes expressed across all patient samples were kept for downstream analysis due to a lack of replicates to distinguish biological zeros from technical zeros. The resulting matrix of 19,914 genes by 11 patients was transformed with the regularized logarithm transformation in the DESeq2(Love et al., 2014) R package to stabilize variance and to account for differences in library size between patients. The top 5% most variable genes were chosen for unsupervised hierarchical clustering and principal component analysis (PCA). Hierarchical clustering, with complete linkage and 1-Pearson correlation as the distance metric, was performed in the R package sigclust2(Kimes et al., 2017) to assess statistical significance of splitting. Dendrograms were generated by invoking sigclust2::shc() with the alpha set to 0.05 and n_min set to 8. The R package ComplexHeatmap(Gu et al., 2016) was used to generate the heatmap of the top 5% most variable genes across 11 patients using the custom dendrogram generated by sigclust2. The PCA plot of 11 patient tumors based on the top 5% most variable genes was generated using DESeq2’s plotPCA().
为了为每个患者肿瘤样本创建伪大量转录组图谱,如 Figure S9 所示,将 10x Genomics Cell Ranger (v3.1.0) 生成的原始特征条形码矩阵折叠成一个图谱,对所有条形码(细胞和非细胞)的原始计数求和。由于缺乏区分生物零和技术零的重复,因此仅保留所有患者样本中表达的基因用于下游分析。使用 DESeq2( Love et al., 2014 ) R 包中的正则化对数变换对 11 名患者的 19,914 个基因的结果矩阵进行转换,以稳定方差并解释患者之间文库大小的差异。选择前 5% 最可变的基因进行无监督分层聚类和主成分分析 (PCA)。在 R 包 sigclust2( Kimes et al., 2017 ) 中执行分层聚类,以完全关联和 1-Pearson 相关作为距离度量,以评估分裂的统计显着性。通过调用 sigclust2::shc() 生成树状图,其中 alpha 设置为 0.05,n_min 设置为 8。R 包 ComplexHeatmap( Gu et al., 2016 ) 用于使用 sigclust2 生成的自定义树状图生成 11 名患者的前 5% 最可变基因的热图。使用 DESeq2 的 plotPCA() 生成基于前 5% 最可变基因的 11 例患者肿瘤的 PCA 图。
To create a pseudo-bulk chromatin accessibility profile for each patient tumor sample as shown in Figure S9, the position sorted bam file generated by 10x Genomics Cell Ranger ATAC (v 1.2.0) was inputted into the R package csaw(Lun and Smyth, 2016) to quantify ATAC fragments into 200 bp contiguous genomic tiles. The read parameters were set using csaw’s readParam() with minq set to “20”, pe set to “both”, dedup set to “TRUE”, max.frag set to “500”, and discard to set to a Granges object listing hg38 blacklist regions. The 200 bp genomic tile matrix was constructed using csaw’s windowCounts() with ext set to “100”, width set to “200”, and bin set to “TRUE”. Only genomic tiles accessible across all patient samples were kept for downstream analysis due to a lack of replicates to distinguish biological zeros from technical zeros. The resulting matrix of 6,052,083 genomic tiles by 11 patients was transformed with the regularized logarithm transformation in the DESeq2(Love et al., 2014) R package to stabilize variance and to account for differences in library size between patients. The top 5% most variable genomic tiles were chosen for unsupervised hierarchical clustering and principal component analysis (PCA). Hierarchical clustering, with complete linkage and 1-Pearson correlation as the distance metric, was performed in the R package sigclust2(Kimes et al., 2017) to assess statistical significance of splitting. Dendrograms were generated by invoking sigclust2::shc() with the alpha set to 0.05 and n_min set to 8. The R package ComplexHeatmap(Gu et al., 2016) was used to generate the heatmap of 3,000 randomly sampled features out of the top 5% most variable genomic tiles across 11 patients using the custom dendrogram generated by sigclust2. The PCA plot of 11 patient tumors based on the top 5% most variable genomic tiles was generated using DESeq2’s plotPCA().
为了为每个患者肿瘤样本创建伪大量染色质可及性曲线,如图所示 Figure S9 ,将 10x Genomics Cell Ranger ATAC (v 1.2.0) 生成的位置排序 bam 文件输入到 R 包 csaw( Lun and Smyth, 2016 ) 中,以将 ATAC 片段定量为 200 bp 连续基因组切片。使用 csaw 的 readParam() 设置读取参数,其中 minq 设置为“20”,pe 设置为“both”,dedup 设置为“TRUE”,max.frag 设置为“500”,discard 设置为列出 hg38 黑名单区域的 Granges 对象。200 bp 基因组切片矩阵是使用 csaw 的 windowCounts() 构建的,其中 ext 设置为 “100”,width 设置为 “200”,bin 设置为 “TRUE”。由于缺乏区分生物零和技术零的重复,因此仅保留可从所有患者样本中访问的基因组切片用于下游分析。使用 DESeq2( Love et al., 2014 ) R 包中的正则化对数变换,将 11 名患者得到的 6,052,083 个基因组图块的矩阵进行转换,以稳定方差并解释患者之间文库大小的差异。选择前 5% 最可变的基因组瓦片进行无监督分层聚类和主成分分析 (PCA)。在 R 包 sigclust2( Kimes et al., 2017 ) 中执行分层聚类,以完全关联和 1-Pearson 相关作为距离度量,以评估分裂的统计显着性。通过调用 sigclust2::shc() 生成树状图,其中 alpha 设置为 0.05,n_min 设置为 8。R 包 ComplexHeatmap( Gu et al., 2016 ) 用于使用 sigclust2 生成的自定义树状图,从 11 名患者的前 5% 最可变的基因组图块中生成 3,000 个随机采样特征的热图。 使用 DESeq2 的 plotPCA() 生成基于前 5% 最可变基因组瓦片的 11 例患者肿瘤的 PCA 图。
Peak-to-gene correlation analysis with empirically derived FDR (eFDR)
使用经验衍生的 FDR (eFDR) 进行峰到基因相关性分析
Peak-to-gene correlation analysis was performed to identify putative regulatory relationships by correlating peak accessibility to imputed gene expression across scATAC-seq metacells. This procedure was invoked by ArchR’s addPeak2GeneLinks() with reducedDims set to “IterativeLSI” and dimsToUse set to “1:50”. Gene expression in scATAC-seq was imputed after the Seurat label transfer procedure. This procedure calculated imputed gene expression values by multiplying the scRNA-seq expression values by the anchor weights matrix defining the association between each scATAC-seq cell and each anchor. Next, low-overlapping aggregates of scATAC-seq cells were generated via a k-nearest neighbor procedure in the LSI space to reduce noise and to ensure robust correlations in the features. Aggregates with >80% overlap with any other aggregate were removed to reduce to bias. This procedure resulted in approximately 500 aggregates of scATAC-seq cells which were used to correlate the accessibility of every peak to the imputed expression of every gene on the same chromosome using an implementation of fast feature correlations in C++ using the Rcpp package implemented by the ArchR(Granja et al., 2021) R package.
进行峰-基因相关性分析,通过将峰可及性与 scATAC-seq 元细胞中插补的基因表达相关联来确定假定的调控关系。此过程由 ArchR 的 addPeak2GeneLinks() 调用,其中 reducedDims 设置为“IterativeLSI”,dimsToUse 设置为“1:50”。scATAC-seq 中的基因表达在 Seurat 标记转移程序后估算。该程序通过将 scRNA-seq 表达值乘以定义每个 scATAC-seq 细胞和每个锚点之间关联的锚点权重矩阵来计算插补基因表达值。接下来,通过 LSI 空间中的 k 最近邻程序生成 scATAC-seq 细胞的低重叠聚集体,以降低噪声并确保特征中的稳健相关性。删除 >80% 与任何其他聚集体重叠的聚集体以减少偏差。该程序产生了大约 500 个 scATAC-seq 细胞聚集体,这些细胞用于使用 ArchR( Granja et al., 2021 ) R 包实现的 C++ 快速特征相关性实现,将每个峰的可及性与同一染色体上每个基因的插补表达相关联。
To assess statistical significance of the peak-to-gene correlations as shown in Figure S7, we developed an elaborate empirical FDR (eFDR) procedure to help screen for robust peak-to-gene associations(Storey and Tibshirani, 2003). To estimate the eFDR, the number of observed peak-to-gene associations with a raw p-value ≤ 1e-12 was first recorded. The peak-to-gene correlation analysis was then repeated 100 times under the permuted null condition where, for each permutation, the scATAC-seq metacell labels were shuffled for the peak data only to break the link between peak accessibility and gene expression. To calculate the eFDR, the median number of null peak-to-gene associations with a raw p-value ≤ 1e-12 across all 100 permutations was divided by the number of observed peak-to-gene associations with a raw p-value ≤ 1e-12. This entire procedure was conducted for each patient analysis cohort (full cohort, EEC, and HGSOC) based on the peak matrices generated for each patient analysis. The initial raw p-value threshold of 1e-12 was chosen over the first-quartile of the observed p-value distribution because in two out of three analysis cohorts, the 1e-12 raw p-value threshold offered a preferable (lower) eFDR relative to the first-quartile approach.
为了评估峰与基因相关性的统计显着性,如 Figure S7 所示,我们开发了一个精心设计的经验 FDR (eFDR) 程序,以帮助筛选稳健的峰与基因关联 ( Storey and Tibshirani, 2003 )。为了估计 eFDR,首先记录观察到的与原始 p 值≤ 1e-12 的峰-基因关联的数量。然后在置换零条件下重复峰-基因相关性分析 100 次,其中,对于每个排列,scATAC-seq 元细胞标签被洗牌以获得峰值数据,只是为了打破峰可及性和基因表达之间的联系。为了计算 eFDR,将所有 100 次排列中原始 p 值≤ 1e-12 的零峰基因关联的中位数除以观察到的原始 p 值≤ 1e-12 的峰基因关联数。整个过程是根据为每个患者分析生成的峰矩阵对每个患者分析队列(完整队列、EEC 和 HGSOC)进行的。1e-12 的初始原始 p 值阈值是在观察到的 p 值分布的第一个四分位数上选择的,因为在三个分析队列中的两个队列中,1e-12 原始 p 值阈值提供了相对于第一个四分位数方法更可取(更低)的 eFDR。
To compute the distribution of the number peaks per gene and vice versa as shown in Figures 2D and S8, a peak-to-gene metadata table was first created where each row contained a peak name, or set of genomic coordinates, and a corresponding gene name. The distribution of the number peaks per gene was computed by tallying the number of unique gene names. The distribution of the number genes per peak was computed by tallying the number of unique peak names.
为了计算每个基因的峰数分布,反之亦然,如 Figures 2D 和 S8 所示,首先创建了一个峰到基因元数据表,其中每行包含一个峰名称或一组基因组坐标,以及一个相应的基因名称。通过计算唯一基因名称的数量来计算每个基因的数量峰的分布。通过计算唯一峰名称的数量来计算每个峰的基因数量分布。
To identify patient-specific and malignant cell type-specific peak-to-gene correlations, as shown in Figures S12, S13, and S16, the scATAC-seq ArchR dataset was subsetted accordingly to only include patient or malignant cell type barcodes of interest before re-computing the peak-to-gene links.
为了识别患者特异性和恶性细胞类型特异性峰-基因相关性,如 Figures S12 、 S13 和 S16 所示,scATAC-seq ArchR 数据集相应地进行了子集化,在重新计算峰-基因链接之前,仅包括感兴趣的患者或恶性细胞类型条形码。
Genomic coordinate overlap analysis with normal epigenome profiles
与正常表观基因组图谱的基因组坐标重叠分析
To identify putative cancer-specific distal regulatory elements (dREs) within each patient analysis cohort as demonstrated in Figure S8, the genomic coordinates of the distal peaks participating in the cancer-enriched peak-to-gene links were overlapped with a set of normal epigenome profiles.
为了识别每个患者分析队列中推定的癌症特异性远端调节元件 (dRE),如 所示 Figure S8 ,参与癌症富集峰基因连接的远端峰的基因组坐标与一组正常的表观基因组图谱重叠。
H3K27ac ChIP-seq peaks of ovarian surface epithelium cell lines iOSE4 and iOSE11 were downloaded from GSE68104. The hg19 genomic coordinates from iOSE4 rep1, iOSE4 rep2, iOSE11 rep1, and iOSE11 rep2 were merged into one combined peak set using the reduce() function from the GenomicRanges R package(Coetzee et al., 2015, Lawrence et al., 2013). After liftOver from hg19 to hg38, this combined peak set served as the normal reference enhancer profile for ovarian surface epithelium(Maintainer, 2020). H3K27ac ChIP-seq peaks of fallopian tube secretory epithelial cell lines iFTSEC33 and iFTSEC246 were downloaded from GSE68104. The hg19 genomic coordinates from iFTSEC33 rep1, iFTSEC33 rep2, iFTSEC246 rep1, and iFTSEC246 rep2 were merged into one combined peak set using the reduce() function from the GenomicRanges R package(Coetzee et al., 2015, Lawrence et al., 2013). After liftOver from hg19 to hg38, this combined peak set served as the normal reference enhancer profile for fallopian tube secretory epithelium(Maintainer, 2020). The last normal reference epigenome profile was supplied by the full list of Candidate cis-Regulatory Elements by ENCODE (ENCODE cCREs) in hg38 (Consortium et al., 2020).
卵巢表面上皮细胞系 iOSE4 和 iOSE11 的 H3K27ac ChIP-seq 峰是从 下载 GSE68104 的。使用 GenomicRanges R 包中的 reduce() 函数( Coetzee et al., 2015 , Lawrence et al., 2013 ),将来自 iOSE4 rep1、iOSE4 rep2、iOSE11 rep1 和 iOSE11 rep2 的 hg19 基因组坐标合并为一个组合峰集。从 hg19 提升到 hg38 后,该组合峰集用作卵巢表面上皮的正常参考增强子曲线 ( Maintainer, 2020 )。输卵管分泌型上皮细胞系 iFTSEC33 和 iFTSEC246 的 H3K27ac ChIP-seq 峰是从 下载 GSE68104 的。使用 GenomicRanges R 包中的 reduce() 函数,将来自 iFTSEC33 rep1、iFTSEC33 rep2、iFTSEC246 rep1 和 iFTSEC246 rep2 的 hg19 基因组坐标合并为一个组合峰集 Lawrence et al., 2013 。 Coetzee et al., 2015 从 hg19 提升到 hg38 后,这个组合峰组用作输卵管分泌上皮的正常参考增强子曲线 ( Maintainer, 2020 )。最后一个正常的参考表观基因组图谱由 hg38 ( 中的 ENCODE) 的候选顺式调节元件 (ENCODE cCRE) 的完整列表提供 Consortium et al., 2020 。
findOverlapsOfPeaks() from the ChIPpeakAnno R package was used to find overlaps between the cancer-enriched peaks and the normal reference epigenome profiles(Zhu et al., 2010). Genomic coordinate overlap between features was defined as a minimum of 1 bp overlap. The cancer-enriched peak coordinates that did not overlap with any of the normal reference epigenome profiles were deemed cancer-specific peaks.
来自 ChIPpeakAnno R 包的 findOverlapsOfPeaks() 用于查找富含癌症的峰与正常参考表观基因组图谱 () 之间的重叠 Zhu et al., 2010 。特征之间的基因组坐标重叠定义为至少 1 bp 重叠。与任何正常参考表观基因组图谱不重叠的富含癌症的峰坐标被认为是癌症特异性峰。
Predicting transcription factor occupancy at select putative enhancer regions in High-Grade Serous OC (HGSOC)
预测高级别浆液性 OC (HGSOC) 中选定假定增强子区域的转录因子占有率
The sequences of the select putative enhancers in the malignant fraction of Patient 9, as shown in Figure 4D, were extracted with bedtools(Quinlan and Hall, 2010) getfasta() after accounting for single-nucleotide variants relative to the hg38 reference genome. Single-nucleotide variants in the malignant fraction were called using bcftools(Danecek and McCarthy, 2017) mpileup followed by bcftools(Danecek and McCarthy, 2017) consensus with a bam file containing fragments only from cellular barcodes present in in the Patient 9 malignant fraction. This malignant-specific bam file was generated using Cell Ranger’s bamslice. The putative enhancer sequences were inputted into Find Individual Motif Occurrences (FIMO) (Bailey et al., 2015) motif scanning with the --bgfile parameter set to “motif-file” and with a motif database supplied by JASPAR2020 (Fornes et al., 2020). The FIMO output listing matching motif occurrences was filtered for matches with a q-value < 0.10. This list of statistically significant motif matches was further ranked by TF expression in the malignant fraction of Patient 9 calculated by summing the normalized TF counts across all cells in the malignant fraction. TF expression box plots were generated in R(Team, 2020) using ggplot2(Wickham, 2016).
如中 Figure 4D 所示,在考虑了相对于 hg38 参考基因组的单核苷酸变异后,用 bedtools( Quinlan and Hall, 2010 ) getfasta() 提取了患者 9 恶性部分中的选择推定增强子序列。使用 bcftools( Danecek and McCarthy, 2017 ) mpileup 调用恶性组分中的单核苷酸变异,然后使用 bcftools( Danecek and McCarthy, 2017 ) 共识 ,bam 文件仅包含来自患者 9 恶性组分中存在的细胞条形码的片段。这个恶性特异性 bam 文件是使用 Cell Ranger 的 bamslice 生成的。将推定的增强子序列输入到查找单个基序出现 (FIMO) ( Bailey et al., 2015 ) 基序扫描中,将 --bgfile 参数设置为“基序文件”,并使用 JASPAR2020 ( ) 提供的基序数据库 Fornes et al., 2020 。列出匹配模体出现次数的 FIMO 输出已过滤为 q 值 < 为 0.10 的匹配项。该具有统计学意义的基序匹配列表通过患者 9 恶性部分的 TF 表达进一步排名,该列表通过将恶性部分中所有细胞的标准化 TF 计数相加来计算。TF 表达式框图是使用 ggplot2( Team, 2020 ) 在 R( ) 中生成的 Wickham, 2016 。
Total Functional Score of Enhancer Elements (TFSEE)
增强子元件的总功能评分 (TFSEE)
TFSEE analysis, as presented in Figure 6, was performed to identify transcription factors (TFs) enriched at active distal regulatory elements (dREs) for each malignant cell type(Malladi et al., 2020) (Franco et al., 2018). Referring back to the entire patient cohort, 11 out of 36 cell type subclusters were chosen for TFSEE analysis based on patient specificity, inferred copy number events and malignant cell type identity (Figure 1D, Figure S18). Only malignant cell type clusters with 100% patient specificity were chosen for the TFSEE analysis.
如 Figure 6 所示,进行 TFSEE 分析以鉴定在每种恶性细胞类型的 Malladi et al., 2020 活性远端调节元件 (dRE) 处富集的转录因子 (TFs) ( Franco et al., 2018 )。回顾整个患者队列,根据患者特异性、推断的拷贝数事件和恶性细胞类型身份,选择了 36 个细胞类型亚簇中的 11 个进行 TFSEE 分析 ( Figure 1D , Figure S18 )。仅选择具有 100% 患者特异性的恶性细胞类型簇进行 TFSEE 分析。
To generate the dRE or enhancer activity matrix, statistically significant dREs identified in the peak-to-gene linkage analysis (Pearson correlation >0.45, p-value <= 1e-12) were set intersected with a list of differentially accessible peaks enriched (Benjamini-Hochberg corrected p-value <= 0.01 & log2FC >= 1.25) in each of the malignant cell type groups. Pseudo-bulk enhancer activity profiles were generated by row summing the counts across all cells in each malignant cell type. Only enhancer regions that were accessible across all malignant cell types were included in the analysis due to a lack of replicates to distinguish biological zeros from technical zeros. The resulting matrix of enhancers by malignant cell types was transformed with the regularized logarithm transformation in the DESeq2(Love et al., 2014) R package to stabilize variance and to account for differences in library size between malignant cell type groups. Post-transformation, the enhancer activity matrix was scaled from 0 to 1 (cell type-wise) prior to the TFSEE matrix operations.
为了生成 dRE 或增强子活性矩阵,将在峰到基因连接分析中鉴定出的具有统计学意义的 dREs(Pearson 相关性>0.45,p 值<= 1e-12)与每个恶性细胞类型组中富含差异可及的峰列表(Benjamini-Hochberg 校正的 p 值<= 0.01 & log2FC >= 1.25)相交。通过对每种恶性细胞类型中所有细胞的计数进行行求和来生成伪大量增强子活性谱。由于缺乏区分生物零和技术零的重复,因此仅包括在所有恶性细胞类型中均可访问的增强子区域。使用 DESeq2( Love et al., 2014 ) R 包中的正则化对数变换对恶性细胞类型得到的增强子矩阵进行转换,以稳定方差并解释恶性细胞类型组之间文库大小的差异。转化后,在 TFSEE 矩阵作之前,增强子活性矩阵从 0 缩放到 1 ( 细胞类型方面 )。
To generate the TF motif prediction matrix, motif search and matching were performed with MEME and TOMTOM, respectively using MEME suite of programs(Bailey et al., 2009, Bailey et al., 2015). The sequences of the enhancers in each malignant cell type were extracted with bedtools(Quinlan and Hall, 2010) getfasta() using the hg38 reference genome. The enhancer sequences were then inputted into MEME motif searching using the following flags: - dna, -mod zoops, -nmotifs 15, -minw 8, -maxw 15, and -revcomp. The MEME outputs were inputted into TOMTOM motif matching using the flags -evalue and -thresh 10 with a motif database supplied by JASPAR2020(Fornes et al., 2020). The outputs of MEME and TOMTOM were parsed using a custom Python script written by the original authors (Malladi et al., 2020) of TFSEE to generate a matrix of TF motif prediction scores (https://git.biohpc.swmed.edu/gcrb/tfsee). This motif prediction score matrix was scaled from 0 to 1 (enhancer-wise) prior to the TFSEE matrix operations.
为了生成 TF 基序预测矩阵,使用 MEME 程序套件( Bailey et al., 2009 , Bailey et al., 2015 )分别使用 MEME 和 TOMTOM 进行模体搜索和匹配。使用 hg38 参考基因组,用 bedtools( Quinlan and Hall, 2010 ) getfasta() 提取每种恶性细胞类型中的增强子序列。然后使用以下标志将增强子序列输入到 MEME 基序搜索中:- dna、-mod zoops、-nmotifs 15、-minw 8、-maxw 15 和 -revcomp。使用标志 -evalue 和 -thresh 10 将 MEME 输出输入到 TOMTOM 模体匹配中,并使用 JASPAR2020( ) 提供的模体数据库 Fornes et al., 2020 。MEME 和 TOMTOM 的输出是使用 TFSEE 的原作者 ( Malladi et al., 2020 ) 编写的自定义 Python 脚本解析的,以生成 TF 基序预测分数矩阵 ( https://git.biohpc.swmed.edu/gcrb/tfsee )。在 TFSEE 矩阵作之前,该基序预测评分矩阵从 0 缩放到 1 ( 增强子方面 )。
To generate the TF expression matrix, pseudo-bulk gene expression profiles were generated by row summing the gene counts across all cells in each malignant cell type. Only genes that were expressed across all malignant cell types were included in the analysis due to a lack of replicates to distinguish biological zeros from technical zeros. The resulting matrix of genes by malignant cell types was transformed with the regularized logarithm transformation in the DESeq2(Love et al., 2014) R package to stabilize variance and to account for differences in library size between malignant cell type groups. Post-transformation, the gene expression matrix was subsetted to TFs identified in the motif prediction analysis and then scaled from 0 to 1 (cell type-wise) prior to the TFSEE matrix operations.
为了生成 TF 表达矩阵,通过对每种恶性细胞类型中所有细胞的基因计数进行行求和来生成伪大量基因表达谱。由于缺乏区分生物零和技术零的重复,因此仅包括在所有恶性细胞类型中表达的基因。使用 DESeq2( Love et al., 2014 ) R 包中的正则化对数变换转换恶性细胞类型的基因矩阵,以稳定方差并解释恶性细胞类型组之间文库大小的差异。转化后,将基因表达矩阵子集化为在基序预测分析中鉴定的 TFs,然后在 TFSEE 矩阵作之前从 0 缩放到 1 ( 细胞类型方面 )。
The enhancer activity matrix was multiplied with the TF motif prediction matrix to form an intermediate matrix product. This matrix product was element-wise multiplied with the TF expression matrix to form the final TFSEE matrix used in downstream analysis (Figure 6A). Heatmaps of the final TFSEE matrix were generated in R(Team, 2020) using ComplexHeatmap(Gu et al., 2016, Wickham, 2016).
将增强子活性矩阵与 TF 基序预测矩阵相乘,形成中间矩阵乘积。该矩阵乘积与 TF 表达矩阵元素相乘,形成用于下游分析的最终 TFSEE 矩阵 ( Figure 6A )。最终 TFSEE 矩阵的热图是使用 ComplexHeatmap( Team, 2020 Gu et al., 2016 , Wickham, 2016 ) 在 R( ) 中生成的。
The rank order frequency distribution plots were generated by computing the difference in scaled TFSEE score between two conditions or malignant cell types of interest. If multiple malignant cell types were represented in a condition, the average TFSEE score profile was computed to form one observation for that condition group in the difference calculation. Rank order plots were generated in R(Team, 2020) using ggplot2(Wickham, 2016).
通过计算两种条件或感兴趣的恶性细胞类型之间缩放的 TFSEE 评分的差异来生成排名顺序频率分布图。如果一种病症中表示多种恶性细胞类型,则计算平均 TFSEE 评分曲线,以在差异计算中形成该病症组的一个观察值。使用 ggplot2( Team, 2020 ) 在 R( ) 中生成排名顺序图 Wickham, 2016 。
QUANTIFICATION AND STATISTICAL ANALYSIS
量化和统计分析
For computational analyses, statistical details can be found in the corresponding figure legends and in the publicly available Github repository (https://github.com/RegnerM2015/scENDO_scOVAR_2020). Most of the computational analyses and statistical tests were performed in R version 4.0.3 (Team, 2020). Statistical significance for correlation, Wilcoxon-Rank Sum, and Kruskal-Wallis tests were defined as a p-value < 0.01 unless otherwise indicated in the figure legends or method details section. The remaining statistical analyses were performed through the Unix command line interface with the Cell Ranger software or the MEME suite of tools (Grant et al., 2011, Bailey et al., 2009, Bailey et al., 2015). Statistical significance for Cell Ranger related analyses can be described further here: https://support.10xgenomics.com/single-cell-gene-expression/software/pipelines/latest/what-is-cell-ranger. Statistically significant motif matches identified by the FIMO software were defined as a Benjamini-Hochberg corrected p-value (i.e. q-value) < 0.10.
对于计算分析,统计详细信息可以在相应的图形图例和公开可用的 Github 存储库 ( https://github.com/RegnerM2015/scENDO_scOVAR_2020 ) 中找到。大多数计算分析和统计测试是在 R 版本 4.0.3 ( Team, 2020 ) 中进行的。相关性、Wilcoxon-Rank Sum 和 Kruskal-Wallis 检验的统计显著性定义为 p 值 < 0.01,除非图例或 method details 部分中另有说明。其余的统计分析是通过 Unix 命令行界面使用 Cell Ranger 软件或 MEME 工具套件 ( Grant et al., 2011 , Bailey et al., 2009 , Bailey et al., 2015 ) 进行的。Cell Ranger 相关分析的统计显著性可在此处进一步描述: https://support.10xgenomics.com/single-cell-gene-expression/software/pipelines/latest/what-is-cell-ranger 。FIMO 软件鉴定的具有统计学意义的基序匹配定义为 Benjamini-Hochberg 校正的 p 值(即 q 值)< 0.10。
For RT-qPCR, statistical details of experiments can be found in the corresponding figure legends. Results are shown as the mean fold change (n=3) ± S.E.M. (n = number of biological replicates). Statistical analysis was conducted with the GraphPad Prism 9.0.0 software using Welch’s one-tailed t-test. Statistical significance is indicated by *p<0.05, **p<0.01, ***p<0.001, and ****p<0.0001.
对于 RT-qPCR,实验的统计细节可以在相应的图例中找到。结果显示为 S.E.M. ±平均倍数变化 (n=3)(n = 生物学重复数)。使用 Welch 的单尾 t 检验,使用 GraphPad Prism 9.0.0 软件进行统计分析。统计显著性用 *p<0.05、**p<0.01、***p<0.001 和 ****p<0.0001 表示。
Supplementary Material 补充材料
Table S1. Extended clinical data and library information for 11 gynecologic tumor specimens, Related to
Table 1. (Table_S1_clinical_data.xlsx)
表 S1.11 例妇科肿瘤标本的扩展临床数据和文库信息,相关 Table 1 。( Table_S1_clinical_data.xlsx )
Table S2. scRNA-seq barcode metadata, clustering, and cell type annotations, Related to
Figures 1, 3, and 4.(Table_S2_scRNA_metadata.xlsx)
表 S2.scRNA-seq 条形码元数据、聚类和细胞类型注释,与 Figures 1 、 3 和 4 相关。( Table_S2_scRNA_metadata.xlsx )
Table S3. scATAC-seq barcode metadata, clustering, and inferred cell type annotations, Related to
Figures 1, 3, and 4. (Table_S3_scATAC_metadata.xlsx)
表 S3.scATAC-seq 条形码元数据、聚类和推断的细胞类型注释,与 Figures 1 、 3 和 4 相关。( Table_S3_scATAC_metadata.xlsx )
Table S4. Kaplan-Meier data summary and associated metadata with directions to reproduce the analyses on kmplot.com, Related to
STAR Methods. (Table_S4_KM_metadata.xlsx)
表 S4.Kaplan-Meier 数据摘要和相关元数据,以及在 kmplot.com 上重现分析的方向,相关 STAR Methods 。( Table_S4_KM_metadata.xlsx )
Table S5. FIMO transcription factor motif scanning results for the LAPTM4B enhancers 1–5 and promoter in high-grade serous ovarian cancer, Related to Figure 4. (Table_S5_ranked_FIMO_results.xlsx)
表 S5.高级别浆液性卵巢癌中 LAPTM4B 增强子 1-5 和启动子的 FIMO 转录因子基序扫描结果,与 Figure 4 .( Table_S5_ranked_FIMO_results.xlsx )
6. 数据 S1.峰到基因链接导致制表符分隔值格式,与 Figures 2 、 3 和 4 相关。
There are three sets of files for each cohort of patients in this study: 1) statistically significant peak-to-gene links with all peak types and no correlation thresholding, 2) statistically significant distal peak-to-gene links with correlation >= 0.45, and 3) statistically significant cancer-specific distal peak-to-gene links with correlation >= 0.45. (Data_S1_Peak_to_Gene_Links.tsv.gz)
本研究中的每个患者队列有三组文件:1) 与所有峰类型有统计学意义的峰到基因联系,没有相关性阈值,2) 具有统计学意义的远端峰到基因联系,相关性 >= 0.45,以及 3) 具有统计学意义的癌症特异性远端峰到基因联系,相关性 >= 0.45。( Data_S1_Peak_to_Gene_Links.tsv.gz )
KEY RESOURCES TABLE 关键资源表
| REAGENT or RESOURCE 试剂或资源 | SOURCE | IDENTIFIER | |
|---|---|---|---|
| Antibodies 抗体 | |||
| Anti-beta Tubulin antibody – Loading Control 抗 β 微管蛋白抗体 – 上样对照 |
Abcam Abcam 中文官网 | Cat#ab6046; RRID: AB_2210370 货号#ab6046;RRID: AB_2210370 |
|
| Anti-Cas9 Antibody (7A9–3A3) 抗 Cas9 抗体 (7A9–3A3) |
Santa Cruz Biotechnology 圣克鲁斯生物技术 |
Cat#sc-517386; RRID: AB_2800509 货号#sc-517386;RRID:AB_2800509 |
|
| Donkey anti-rabbit IgG, Whole Ab, HRP-conjugated 驴抗兔 IgG,全抗体,HRP 偶联 |
GE Healthcare GE 医疗 | Cat#NA934, RRID: AB_772206 Cat#NA934, RRID: AB_772206 |
|
| Donkey anti-Mouse IgG (H+L), HRP-conjugated | Thermo Fisher Scientific | Cat#PA1–28748, RRID: AB_10982166 | |
| Bacterial and virus strains | |||
| Subcloning Efficiency DH5alpha Competent Cells | Invitrogen | Cat#18265017 | |
| Chemicals, peptides, and recombinant proteins | |||
| FuGENE 6 | Promega | Cat#E2691 | |
| Collagenase/Hyaluronidase | Stemcell Technologies | Cat#07912 | |
| Gentle Collagenase/Hyaluronidase | Stemcell Technologies | Cat#07919 | |
| Hydrocortisone | Stemcell Technologies | Cat#74144 | |
| Dispase | Stemcell Technologies | Cat#07923 | |
| DNase I | Stemcell Technologies | Cat#07900 | |
| Blasticidin | Corning | Cat#30100RB | |
| Lenti-X Concentrator | Takara | Cat#631231 | |
| Polybrene | Millipore | Cat#TR1003G | |
| RNAiMAX | Invitrogen | Cat#13778075 | |
| Critical commercial assays | |||
| Chromium Single Cell 3’ GEM, Library & Gel Bead Kit v3 | 10x Genomics | Cat#PN-1000075 | |
| Chromium Single Cell ATAC Library & Gel Bead Kit v1 | 10x Genomics | Cat#PN-1000110 | |
| Chromium Chip B Single Cell Kit | 10x Genomics | Cat#PN-10000153 | |
| Chromium i7 Multiplex Kit | 10x Genomics | Cat#PN-120262 | |
| Chromium Chip E Single Cell ATAC Kit | 10x Genomics | Cat#PN-1000082 | |
| Chromium i7 Multiplex Kit N, Set A | 10x Genomics | Cat#PN-1000084 | |
| Quick-RNA Miniprep Kit | Zymo | Cat#R1055 | |
| Turbo DNA-free Kit | Invitrogen | Cat#AM1907 | |
| iScript cDNA Synthesis Kit | BioRad | Cat#1708891 | |
| Deposited data | |||
| scRNA-seq (processed data) | This Paper | GSE173682 | |
| scATAC-seq (processed data) | This Paper | GSE173682 | |
| scRNA-seq (raw data) | This Paper | phs002340.v1.p1 | |
| scATAC-seq (raw data) | This Paper | phs002340.v1.p1 | |
| Normal ovarian epithelial H3K27ac ChIP-seq peaks | Coetzee et. al., 2015 | GSE68104 | |
| Normal fallopian tube H3K27ac ChIP-seq peaks | Coetzee et. al., 2015 | GSE68104 | |
| Experimental models: Cell lines | |||
| Human: NIH:OVCAR-3 [OVCAR3] | ATCC | Cat#HTB-161, RRID: CVCL_0465 | |
| Human: HEK-293T | ATCC | Cat#CRL-3216, RRID: CVCL_0063 | |
| Experimental models: Organisms/strains | |||
| Human patients consented to participation in ‘Genomics of Ovarian and Endometrial Cancers’ study at the UNC Cancer Hospital (IRB Protocol 18–3198) | This Paper | Table 1, Table S1 | |
| Oligonucleotides | |||
| See Table S6, Table S7 and Table S8 | |||
| Recombinant DNA | |||
| Lenti-dCas9-KRAB-blast vector | Xie et al., 2017 | Addgene #89567 | |
| psPAX2 | Gift from Didier Trono | Addgene #12260 | |
| pMD2.G | Gift from Didier Trono | Addgene #12259 | |
| pSpCas9(BB)-2A-Puro (pX459) v2.0 | Ran et al., 2013 | Addgene #62988 | |
| pX-sgRNA-eGFP-MI | This paper | n/a | |
| Software and algorithms | |||
| Code used to analyze data presented in this paper | This Paper | 10.5281/zenodo.5546110 | |
| Prism (v9.0.0) | GraphPad | www.graphpad.com | |
| R (v4.0.2 or v4.0.3) | The R Project for Statistical Computing | https://www.r-project.org/ | |
| Seurat (v3.2.0 or v3.2.1) | Stuart et al., 2019 | https://satijalab.org/seurat/index.html | |
| ArchR (v0.9.5) | Granja et al., 2021 | https://www.archrproject.com/ | |
| mclust (v5.4.6 or v5.4.7) | Scrucca et al., 2016 | https://cran.r-project.org/web/packages/mclust/index.html | |
| scater (v1.17.5 or v1.18.6) | McCarthy et al., 2017 | https://bioconductor.org/packages/release/bioc/html/scater.html | |
| DESeq2 (v1.29.13 or v1.30.1) | Love et al., 2014 | https://bioconductor.org/packages/release/bioc/html/DESeq2.html | |
| inferCNV (v1.4.0 or v1.6.0) | Tickle, 2019 | http://www.bioconductor.org/packages/release/bioc/html/infercnv.html | |
| DoubletDecon (v1.1.5 or v1.1.6) | DePasquale et al., 2019 | https://github.com/EDePasquale/DoubletDecon | |
| DoubletFinder (v2.0.3) | McGinnis et al., 2019 | https://github.com/chris-mcginnis-ucsf/DoubletFinder | |
| GSVA (v1.36.1 or v1.36.2) | Hanzelmann et al., 2013 | http://bioconductor.org/packages/release/bioc/html/GSVA.html | |
| ggplot2 (v3.3.2 or v3.3.3) | Wickham, 2016 | https://cran.r-project.org/web/packages/ggplot2/index.html | |
| ComplexHeatmap (v2.4.3 or v2.6.2) | Gu et al., 2016 | https://jokergoo.github.io/ComplexHeatmap-reference/book/ | |
| Cell Ranger (v3.1.0) | 10x Genomics | https://support.10xgenomics.com/single-cell-gene-expression/software/pipelines/latest/installation | |
| Cell Ranger ATAC (v1.2.0) | 10x Genomics | https://support.10xgenomics.com/single-cell-atac/software/pipelines/latest/installation | |
| MEME suite (v4.12.0) | Bailey et al, 2009 | https://meme-suite.org/meme/index.html | |
| Python (v3.6.10) | Python Software Foundation | https://www.python.org/ | |
| Biopython (v1.78) | Python tools for computational biology | https://biopython.org / | |
| scikit-learn (v0.23.2) | Machine Learning in Python | https://scikit-learn.org/stable/ | |
| scipy (v1.5.2) | Fundamental Algorithms for Scientific Computing in Python | https://www.scipy.org/ | |
Highlights.
First matched scRNA-seq and scATAC-seq dataset of human gynecologic tumors
Rewiring of chromatin accessibility linked to transcriptional output in cancer cells
Identification of cancer-specific and clinically relevant distal regulatory elements
Differential transcription factor activity drives intratumor heterogeneity
ACKNOWLEDGEMENTS
We thank all patients and their families. We thank the UNC Tissue Procurement Facility and UNC Translational Genomics Core Facility for helping us acquire tumor specimens and sequence genomic libraries. We thank Michele Hayward at the Office of Genomics research for help in navigating the IRB and data submission process. We thank Dr. Yuchao Jiang for helpful discussion on statistical considerations needed for single-cell analysis. We thank Dr. Katie Hoadley and Dr. Steve Marron for insights into statistical considerations regarding pseudo-bulk clustering of patient tumors. We thank Olivia Brown in the UNC School of Medicine for helpful discussion on the clinical interpretation of our single-cell analysis. Finally, we thank members of the Franco Lab for their helpful comments and discussions.
This work was supported by grants from the NIH/National Cancer Institute (5-P50-CA058223-25), the Susan G. Komen Breast Cancer Research Foundation (CCR19608601), and the V Foundation for Cancer Research (V2019-015) to H.L.F. Additional support was provided by the She Rocks Foundation to V.B.J.
Footnotes
DECLARATION OF INTERESTS
The authors declare no competing interests.
Publisher's Disclaimer: This is a PDF file of an unedited manuscript that has been accepted for publication. As a service to our customers we are providing this early version of the manuscript. The manuscript will undergo copyediting, typesetting, and review of the resulting proof before it is published in its final form. Please note that during the production process errors may be discovered which could affect the content, and all legal disclaimers that apply to the journal pertain.
REFERENCES
- AKDEMIR KC, LE VT, CHANDRAN S, LI Y, VERHAAK RG, BEROUKHIM R, CAMPBELL PJ, CHIN L, DIXON JR & FUTREAL PA 2020. Disruption of chromatin folding domains by somatic genomic rearrangements in human cancer. Nature genetics, 52, 294–305. [DOI] [PMC free article] [PubMed] [Google Scholar]
- ARAN D, LOONEY AP, LIU L, WU E, FONG V, HSU A, CHAK S, NAIKAWADI RP, WOLTERS PJ, ABATE AR, BUTTE AJ & BHATTACHARYA M 2019. Reference-based analysis of lung single-cell sequencing reveals a transitional profibrotic macrophage. Nat Immunol, 20, 163–172. [DOI] [PMC free article] [PubMed] [Google Scholar]
- BAILEY TL, BODEN M, BUSKE FA, FRITH M, GRANT CE, CLEMENTI L, REN J, LI WW & NOBLE WS 2009. MEME SUITE: tools for motif discovery and searching. Nucleic Acids Res, 37, W202–8. [DOI] [PMC free article] [PubMed] [Google Scholar]
- BAILEY TL, JOHNSON J, GRANT CE & NOBLE WS 2015. The MEME Suite. Nucleic Acids Res, 43, W39–49. [DOI] [PMC free article] [PubMed] [Google Scholar]
- BANERJI U 2014. A Phase I Trial of the Combination of AZD2014 and Weekly Paclitaxel [Online]. Available: https://ClinicalTrials.gov/show/NCT02193633 [Accessed].
- BARKER HE & SCOTT CL Genomics of gynaecological carcinosarcomas and future treatment options. Seminars in cancer biology, 2020. Elsevier, 110–120. [DOI] [PubMed] [Google Scholar]
- BERGER AC, KORKUT A, KANCHI RS, HEGDE AM, LENOIR W, LIU W, LIU Y, FAN H, SHEN H & RAVIKUMAR V 2018. A comprehensive pan-cancer molecular study of gynecologic and breast cancers. Cancer cell, 33, 690–705. e9. [DOI] [PMC free article] [PubMed] [Google Scholar]
- BREMBECK FH, OPITZ OG, LIBERMANN TA & RUSTGI AK 2000. Dual function of the epithelial specific ets transcription factor, ELF3, in modulating differentiation. Oncogene, 19, 1941–1949. [DOI] [PubMed] [Google Scholar]
- BUENROSTRO JD, WU B, LITZENBURGER UM, RUFF D, GONZALES ML, SNYDER MP, CHANG HY & GREENLEAF WJ 2015. Single-cell chromatin accessibility reveals principles of regulatory variation. Nature, 523, 486–90. [DOI] [PMC free article] [PubMed] [Google Scholar]
- CANCER GENOME ATLAS RESEARCH, N. 2011. Integrated genomic analyses of ovarian carcinoma. Nature, 474, 609–15. [DOI] [PMC free article] [PubMed] [Google Scholar]
- CANCER GENOME ATLAS RESEARCH, N., KANDOTH C, SCHULTZ N, CHERNIACK AD, AKBANI R, LIU Y, SHEN H, ROBERTSON AG, PASHTAN I, SHEN R, BENZ CC, YAU C, LAIRD PW, DING L, ZHANG W, MILLS GB, KUCHERLAPATI R, MARDIS ER & LEVINE DA 2013. Integrated genomic characterization of endometrial carcinoma. Nature, 497, 67–73. [DOI] [PMC free article] [PubMed] [Google Scholar]
- CAO J, CUSANOVICH DA, RAMANI V, AGHAMIRZAIE D, PLINER HA, HILL AJ, DAZA RM, MCFALINE-FIGUEROA JL, PACKER JS, CHRISTIANSEN L, STEEMERS FJ, ADEY AC, TRAPNELL C & SHENDURE J 2018. Joint profiling of chromatin accessibility and gene expression in thousands of single cells. Science, 361, 1380–1385. [DOI] [PMC free article] [PubMed] [Google Scholar]
- CHEN B, GILBERT LA, CIMINI BA, SCHNITZBAUER J, ZHANG W, LI GW, PARK J, BLACKBURN EH, WEISSMAN JS, QI LS & HUANG B 2013. Dynamic imaging of genomic loci in living human cells by an optimized CRISPR/Cas system. Cell, 155, 1479–91. [DOI] [PMC free article] [PubMed] [Google Scholar]
- CHEN S, LAKE BB & ZHANG K 2019. High-throughput sequencing of the transcriptome and chromatin accessibility in the same cell. Nat Biotechnol, 37, 1452–1457. [DOI] [PMC free article] [PubMed] [Google Scholar]
- CHEN Y-P, YIN J-H, LI W-F, LI H-J, CHEN D-P, ZHANG C-J, LV J-W, WANG Y-Q, LI X-M & LI J-Y 2020. Single-cell transcriptomics reveals regulators underlying immune cell diversity and immune subtypes associated with prognosis in nasopharyngeal carcinoma. Cell research, 30, 1024–1042. [DOI] [PMC free article] [PubMed] [Google Scholar]
- CLAUSS A, NG V, LIU J, PIAO H, RUSSO M, VENA N, SHENG Q, HIRSCH MS, BONOME T & MATULONIS U 2010. Overexpression of elafin in ovarian carcinoma is driven by genomic gains and activation of the nuclear factor κB pathway and is associated with poor overall survival. Neoplasia, 12, 161-IN15. [DOI] [PMC free article] [PubMed] [Google Scholar]
- CLEVERS H, RAFELSKI S, ELOWITZ M, KLEIN A, SHENDURE J, TRAPNELL C, LEIN E, LUNDBERG E, UHLEN M & MARTINEZ-ARIAS A 2017. What is your conceptual definition of “cell type” in the context of a mature organism? Cell Systems, 4, 255–259. [DOI] [PubMed] [Google Scholar]
- COCHRANE DR, CAMPBELL KR, GREENING K, HO GC, HOPKINS J, BUI M, DOUGLAS JM, SHARLANDJIEVA V, MUNZUR AD, LAI D, DEGROOD M, GIBBARD EW, LEUNG S, BOYD N, CHENG AS, CHOW C, LIM JL, FARNELL DA, KOMMOSS S, KOMMOSS F, ROTH A, HOANG L, MCALPINE JN, SHAH SP & HUNTSMAN DG 2020. Single cell transcriptomes of normal endometrial derived organoids uncover novel cell type markers and cryptic differentiation of primary tumours. J Pathol, 252, 201–214. [DOI] [PubMed] [Google Scholar]
- COETZEE SG, SHEN HC, HAZELETT DJ, LAWRENSON K, KUCHENBAECKER K, TYRER J, RHIE SK, LEVANON K, KARST A & DRAPKIN R 2015. Cell-type-specific enrichment of risk-associated regulatory elements at ovarian cancer susceptibility loci. Human molecular genetics, 24, 3595–3607. [DOI] [PMC free article] [PubMed] [Google Scholar]
- CONCORDET JP & HAEUSSLER M 2018. CRISPOR: intuitive guide selection for CRISPR/Cas9 genome editing experiments and screens. Nucleic Acids Res, 46, W242–W245. [DOI] [PMC free article] [PubMed] [Google Scholar]
- CONSORTIUM EP 2012. An integrated encyclopedia of DNA elements in the human genome. Nature, 489, 57–74. [DOI] [PMC free article] [PubMed] [Google Scholar]
- CONSORTIUM EP, MOORE JE, PURCARO MJ, PRATT HE, EPSTEIN CB, SHORESH N, ADRIAN J, KAWLI T, DAVIS CA, DOBIN A, KAUL R, HALOW J, VAN NOSTRAND EL, FREESE P, GORKIN DU, SHEN Y, HE Y, MACKIEWICZ M, PAULI-BEHN F, WILLIAMS BA, MORTAZAVI A, KELLER CA, ZHANG XO, ELHAJJAJY SI, HUEY J, DICKEL DE, SNETKOVA V, WEI X, WANG X, RIVERA-MULIA JC, ROZOWSKY J, ZHANG J, CHHETRI SB, ZHANG J, VICTORSEN A, WHITE KP, VISEL A, YEO GW, BURGE CB, LECUYER E, GILBERT DM, DEKKER J, RINN J, MENDENHALL EM, ECKER JR, KELLIS M, KLEIN RJ, NOBLE WS, KUNDAJE A, GUIGO R, FARNHAM PJ, CHERRY JM, MYERS RM, REN B, GRAVELEY BR, GERSTEIN MB, PENNACCHIO LA, SNYDER MP, BERNSTEIN BE, WOLD B, HARDISON RC, GINGERAS TR, STAMATOYANNOPOULOS JA & WENG Z 2020. Expanded encyclopaedias of DNA elements in the human and mouse genomes. Nature, 583, 699–710. [DOI] [PMC free article] [PubMed] [Google Scholar]
- CORCES MR, GRANJA JM, SHAMS S, LOUIE BH, SEOANE JA, ZHOU W, SILVA TC, GROENEVELD C, WONG CK, CHO SW, SATPATHY AT, MUMBACH MR, HOADLEY KA, ROBERTSON AG, SHEFFIELD NC, FELAU I, CASTRO MAA, BERMAN BP, STAUDT LM, ZENKLUSEN JC, LAIRD PW, CURTIS C, CANCER GENOME ATLAS ANALYSIS N, GREENLEAF WJ & CHANG HY 2018. The chromatin accessibility landscape of primary human cancers. Science, 362. [DOI] [PMC free article] [PubMed] [Google Scholar]
- COWARD JI, MIDDLETON K & MURPHY F 2015. New perspectives on targeted therapy in ovarian cancer. Int J Womens Health, 7, 189–203. [DOI] [PMC free article] [PubMed] [Google Scholar]
- CUSANOVICH DA, DAZA R, ADEY A, PLINER HA, CHRISTIANSEN L, GUNDERSON KL, STEEMERS FJ, TRAPNELL C & SHENDURE J 2015. Multiplex single cell profiling of chromatin accessibility by combinatorial cellular indexing. Science, 348, 910–4. [DOI] [PMC free article] [PubMed] [Google Scholar]
- DANECEK P & MCCARTHY SA 2017. BCFtools/csq: haplotype-aware variant consequences. Bioinformatics, 33, 2037–2039. [DOI] [PMC free article] [PubMed] [Google Scholar]
- DAS A, REIS F, MAEJIMA Y, CAI Z & REN J 2017. mTOR Signaling in Cardiometabolic Disease, Cancer, and Aging. Oxid Med Cell Longev, 2017, 6018675. [DOI] [PMC free article] [PubMed] [Google Scholar]
- DAVIDSON S, EFREMOVA M, RIEDEL A, MAHATA B, PRAMANIK J, HUUHTANEN J, KAR G, VENTO-TORMO R, HAGAI T, CHEN X, HANIFFA MA, SHIELDS JD & TEICHMANN SA 2020. Single-Cell RNA Sequencing Reveals a Dynamic Stromal Niche That Supports Tumor Growth. Cell Rep, 31, 107628. [DOI] [PMC free article] [PubMed] [Google Scholar]
- DEPASQUALE EAK, SCHNELL DJ, VAN CAMP PJ, VALIENTE-ALANDI I, BLAXALL BC, GRIMES HL, SINGH H & SALOMONIS N 2019. DoubletDecon: Deconvoluting Doublets from Single-Cell RNA-Sequencing Data. Cell Rep, 29, 1718–1727 e8. [DOI] [PMC free article] [PubMed] [Google Scholar]
- DONG C, LIU P & LI C 2017. Value of HE4 combined with cancer antigen 125 in the diagnosis of endometrial cancer. Pakistan journal of medical sciences, 33, 1013. [DOI] [PMC free article] [PubMed] [Google Scholar]
- DUFFY M, BONFRER J, KULPA J, RUSTIN G, SOLETORMOS G, TORRE G, TUXEN M & ZWIRNER M 2005. CA125 in ovarian cancer: European Group on Tumor Markers guidelines for clinical use. International Journal of Gynecologic Cancer, 15. [DOI] [PubMed] [Google Scholar]
- FORNES O, CASTRO-MONDRAGON JA, KHAN A, VAN DER LEE R, ZHANG X, RICHMOND PA, MODI BP, CORREARD S, GHEORGHE M, BARANAŠIĆ D, SANTANA-GARCIA W, TAN G, CHÈNEBY J, BALLESTER B, PARCY F, SANDELIN A, LENHARD B, WASSERMAN WW & MATHELIER A 2020. JASPAR 2020: update of the open-access database of transcription factor binding profiles. Nucleic Acids Res, 48, D87–D92. [DOI] [PMC free article] [PubMed] [Google Scholar]
- FRANCO HL, NAGARI A, MALLADI VS, LI W, XI Y, RICHARDSON D, ALLTON KL, TANAKA K, LI J, MURAKAMI S, KEYOMARSI K, BEDFORD MT, SHI X, BARTON MC, DENT SYR & KRAUS WL 2018. Enhancer transcription reveals subtype-specific gene expression programs controlling breast cancer pathogenesis. Genome Res, 28, 159–170. [DOI] [PMC free article] [PubMed] [Google Scholar]
- FRANZEN O, GAN LM & BJORKEGREN JLM 2019. PanglaoDB: a web server for exploration of mouse and human single-cell RNA sequencing data. Database (Oxford), 2019. [DOI] [PMC free article] [PubMed] [Google Scholar]
- FULCO CP, MUNSCHAUER M, ANYOHA R, MUNSON G, GROSSMAN SR, PEREZ EM, KANE M, CLEARY B, LANDER ES & ENGREITZ JM 2016. Systematic mapping of functional enhancer-promoter connections with CRISPR interference. Science, 354, 769–773. [DOI] [PMC free article] [PubMed] [Google Scholar]
- GEISTLINGER L, OH S, RAMOS M, SCHIFFER L, LARUE RS, HENZLER CM, MUNRO SA, DAUGHTERS C, NELSON AC, WINTERHOFF BJ, CHANG Z, TALUKDAR S, SHETTY M, MULLANY SA, MORGAN M, PARMIGIANI G, BIRRER MJ, QIN LX, RIESTER M, STARR TK & WALDRON L 2020. Multiomic Analysis of Subtype Evolution and Heterogeneity in High-Grade Serous Ovarian Carcinoma. Cancer Res, 80, 4335–4345. [DOI] [PMC free article] [PubMed] [Google Scholar]
- GILBERT LA, LARSON MH, MORSUT L, LIU Z, BRAR GA, TORRES SE, STERN-GINOSSAR N, BRANDMAN O, WHITEHEAD EH, DOUDNA JA, LIM WA, WEISSMAN JS & QI LS 2013. CRISPR-mediated modular RNA-guided regulation of transcription in eukaryotes. Cell, 154, 442–51. [DOI] [PMC free article] [PubMed] [Google Scholar]
- GONZALEZ G, MEHRA S, WANG Y, AKIYAMA H & BEHRINGER RR 2016. Sox9 overexpression in uterine epithelia induces endometrial gland hyperplasia. Differentiation, 92, 204–215. [DOI] [PMC free article] [PubMed] [Google Scholar]
- GRANJA JM, CORCES MR, PIERCE SE, BAGDATLI ST, CHOUDHRY H, CHANG HY & GREENLEAF WJ 2021. ArchR is a scalable software package for integrative single-cell chromatin accessibility analysis. Nat Genet, 53, 403–411. [DOI] [PMC free article] [PubMed] [Google Scholar]
- GRANJA JM, KLEMM S, MCGINNIS LM, KATHIRIA AS, MEZGER A, CORCES MR, PARKS B, GARS E, LIEDTKE M, ZHENG GXY, CHANG HY, MAJETI R & GREENLEAF WJ 2019. Single-cell multiomic analysis identifies regulatory programs in mixed-phenotype acute leukemia. Nat Biotechnol, 37, 1458–1465. [DOI] [PMC free article] [PubMed] [Google Scholar]
- GRANT CE, BAILEY TL & NOBLE WS 2011. FIMO: scanning for occurrences of a given motif. Bioinformatics, 27, 1017–8. [DOI] [PMC free article] [PubMed] [Google Scholar]
- GU Z, EILS R & SCHLESNER M 2016. Complex heatmaps reveal patterns and correlations in multidimensional genomic data. Bioinformatics, 32, 2847–9. [DOI] [PubMed] [Google Scholar]
- GYORFFY B, LANCZKY A & SZALLASI Z 2012. Implementing an online tool for genome-wide validation of survival-associated biomarkers in ovarian-cancer using microarray data from 1287 patients. Endocr Relat Cancer, 19, 197–208. [DOI] [PubMed] [Google Scholar]
- HANZELMANN S, CASTELO R & GUINNEY J 2013. GSVA: gene set variation analysis for microarray and RNA-seq data. BMC Bioinformatics, 14, 7. [DOI] [PMC free article] [PubMed] [Google Scholar]
- HELLSTRÖM I, RAYCRAFT J, HAYDEN-LEDBETTER M, LEDBETTER JA, SCHUMMER M, MCINTOSH M, DRESCHER C, URBAN N & HELLSTRÖM KE 2003. The HE4 (WFDC2) protein is a biomarker for ovarian carcinoma. Cancer research, 63, 3695–3700. [PubMed] [Google Scholar]
- HENLEY SJ, MILLER JW, DOWLING NF, BENARD VB & RICHARDSON LC 2018. Uterine cancer incidence and mortality—United States, 1999–2016. Morbidity and Mortality Weekly Report, 67, 1333. [DOI] [PMC free article] [PubMed] [Google Scholar]
- IZAR B, TIROSH I, STOVER EH, WAKIRO I, CUOCO MS, ALTER I, RODMAN C, LEESON R, SU MJ, SHAH P, IWANICKI M, WALKER SR, KANODIA A, MELMS JC, MEI S, LIN JR, PORTER CBM, SLYPER M, WALDMAN J, JERBY-ARNON L, ASHENBERG O, BRINKER TJ, MILLS C, ROGAVA M, VIGNEAU S, SORGER PK, GARRAWAY LA, KONSTANTINOPOULOS PA, LIU JF, MATULONIS U, JOHNSON BE, ROZENBLATT-ROSEN O, ROTEM A & REGEV A 2020. A single-cell landscape of high-grade serous ovarian cancer. Nat Med, 26, 1271–1279. [DOI] [PMC free article] [PubMed] [Google Scholar]
- KIM KH, CHOI JS, CHOI Y-L, SHIN YK, LEE H-C, SEONG IO, KIM BK, CHAE SW & KIM S-H 2009. Enhanced CD24 expression in endometrial carcinoma and its expression pattern in normal and hyperplastic endometrium. Histology and histopathology. [DOI] [PubMed] [Google Scholar]
- KIM N, KIM HK, LEE K, HONG Y, CHO JH, CHOI JW, LEE JI, SUH YL, KU BM, EUM HH, CHOI S, CHOI YL, JOUNG JG, PARK WY, JUNG HA, SUN JM, LEE SH, AHN JS, PARK K, AHN MJ & LEE HO 2020. Single-cell RNA sequencing demonstrates the molecular and cellular reprogramming of metastatic lung adenocarcinoma. Nat Commun, 11, 2285. [DOI] [PMC free article] [PubMed] [Google Scholar]
- KIMES PK, LIU Y, NEIL HAYES D & MARRON JS 2017. Statistical significance for hierarchical clustering. Biometrics, 73, 811–821. [DOI] [PMC free article] [PubMed] [Google Scholar]
- KOSTOV S, KORNOVSKI Y, IVANOVA Y, DZHENKOV D, STOYANOV G, STOILOV S, SLAVCHEV S, TRENDAFILOVA E & YORDANOV A 2020. Ovarian Carcinosarcoma with Retroperitoneal Para-Aortic Lymph Node Dissemination Followed by an Unusual Postoperative Complication: A Case Report with a Brief Literature Review. Diagnostics, 10, 1073. [DOI] [PMC free article] [PubMed] [Google Scholar]
- LABIDI-GALY SI, CLAUSS A, NG V, DURAISAMY S, ELIAS KM, PIAO H-Y, BILAL E, DAVIDOWITZ RA, LU Y & BADALIAN-VERY G 2015. Elafin drives poor outcome in high-grade serous ovarian cancers and basal-like breast tumors. Oncogene, 34, 373–383. [DOI] [PMC free article] [PubMed] [Google Scholar]
- LAMBRECHTS D, WAUTERS E, BOECKX B, AIBAR S, NITTNER D, BURTON O, BASSEZ A, DECALUWE H, PIRCHER A, VAN DEN EYNDE K, WEYNAND B, VERBEKEN E, DE LEYN P, LISTON A, VANSTEENKISTE J, CARMELIET P, AERTS S & THIENPONT B 2018. Phenotype molding of stromal cells in the lung tumor microenvironment. Nat Med, 24, 1277–1289. [DOI] [PubMed] [Google Scholar]
- LARSON MH, GILBERT LA, WANG X, LIM WA, WEISSMAN JS & QI LS 2013. CRISPR interference (CRISPRi) for sequence-specific control of gene expression. Nat Protoc, 8, 2180–96. [DOI] [PMC free article] [PubMed] [Google Scholar]
- LAWHORN IE, FERREIRA JP & WANG CL 2014. Evaluation of sgRNA target sites for CRISPR-mediated repression of TP53. PLoS One, 9, e113232. [DOI] [PMC free article] [PubMed] [Google Scholar]
- LAWRENCE M, HUBER W, PAGES H, ABOYOUN P, CARLSON M, GENTLEMAN R, MORGAN MT & CAREY VJ 2013. Software for computing and annotating genomic ranges. PLoS computational biology, 9, e1003118. [DOI] [PMC free article] [PubMed] [Google Scholar]
- LI J, DOWDY S, TIPTON T, PODRATZ K, LU W-G, XIE X & JIANG S-W 2009. HE4 as a biomarker for ovarian and endometrial cancer management. Expert review of molecular diagnostics, 9, 555–566. [DOI] [PMC free article] [PubMed] [Google Scholar]
- LI L, WEI XH, PAN YP, LI HC, YANG H, HE QH, PANG Y, SHAN Y, XIONG FX, SHAO GZ & ZHOU RL 2010. LAPTM4B: a novel cancer-associated gene motivates multidrug resistance through efflux and activating PI3K/AKT signaling. Oncogene, 29, 5785–95. [DOI] [PubMed] [Google Scholar]
- LIBERZON A, BIRGER C, THORVALDSDOTTIR H, GHANDI M, MESIROV JP & TAMAYO P 2015. The Molecular Signatures Database (MSigDB) hallmark gene set collection. Cell Syst, 1, 417–425. [DOI] [PMC free article] [PubMed] [Google Scholar]
- LIN C-Y, TSAI C-L, CHAO A, LEE L-Y, CHEN W-C, TANG Y-H, CHAO A-S & LAI C-H 2021. Nucleophosmin/B23 promotes endometrial cancer cell escape from macrophage phagocytosis by increasing CD24 expression. Journal of Molecular Medicine, 1–13. [DOI] [PubMed] [Google Scholar]
- LIU T 2014. Use model-based Analysis of ChIP-Seq (MACS) to analyze short reads generated by sequencing protein-DNA interactions in embryonic stem cells. Methods Mol Biol, 1150, 81–95. [DOI] [PubMed] [Google Scholar]
- LORTET-TIEULENT J, FERLAY J, BRAY F & JEMAL A 2018. International Patterns and Trends in Endometrial Cancer Incidence, 1978–2013. J Natl Cancer Inst, 110, 354–361. [DOI] [PubMed] [Google Scholar]
- LOVE MI, HUBER W & ANDERS S 2014. Moderated estimation of fold change and dispersion for RNA-seq data with DESeq2. Genome Biol, 15, 550. [DOI] [PMC free article] [PubMed] [Google Scholar]
- LUN AT & SMYTH GK 2016. csaw: a Bioconductor package for differential binding analysis of ChIP-seq data using sliding windows. Nucleic Acids Res, 44, e45. [DOI] [PMC free article] [PubMed] [Google Scholar]
- MA S, ZHANG B, LAFAVE LM, EARL AS, CHIANG Z, HU Y, DING J, BRACK A, KARTHA VK, TAY T, LAW T, LAREAU C, HSU YC, REGEV A & BUENROSTRO JD 2020. Chromatin Potential Identified by Shared Single-Cell Profiling of RNA and Chromatin. Cell, 183, 1103–1116 e20. [DOI] [PMC free article] [PubMed] [Google Scholar]
- MACINTYRE G, GORANOVA TE, DE SILVA D, ENNIS D, PISKORZ AM, ELDRIDGE M, SIE D, LEWSLEY LA, HANIF A, WILSON C, DOWSON S, GLASSPOOL RM, LOCKLEY M, BROCKBANK E, MONTES A, WALTHER A, SUNDAR S, EDMONDSON R, HALL GD, CLAMP A, GOURLEY C, HALL M, FOTOPOULOU C, GABRA H, PAUL J, SUPERNAT A, MILLAN D, HOYLE A, BRYSON G, NOURSE C, MINCARELLI L, SANCHEZ LN, YLSTRA B, JIMENEZLINAN M, MOORE L, HOFMANN O, MARKOWETZ F, MCNEISH IA & BRENTON JD 2018. Copy number signatures and mutational processes in ovarian carcinoma. Nat Genet, 50, 1262–1270. [DOI] [PMC free article] [PubMed] [Google Scholar]
- MAINTAINER BP 2020. liftOver: Changing genomic coordinate systems with rtracklayer:: liftOver. R package version, 1. [Google Scholar]
- MALLADI VS, NAGARI A, FRANCO HL & KRAUS WL 2020. Total Functional Score of Enhancer Elements Identifies Lineage-Specific Enhancers That Drive Differentiation of Pancreatic Cells. Bioinform Biol Insights, 14, 1177932220938063. [DOI] [PMC free article] [PubMed] [Google Scholar]
- MANSOUR MR, ABRAHAM BJ, ANDERS L, BEREZOVSKAYA A, GUTIERREZ A, DURBIN AD, ETCHIN J, LAWTON L, SALLAN SE, SILVERMAN LB, LOH ML, HUNGER SP, SANDA T, YOUNG RA & LOOK AT 2014. Oncogene regulation. An oncogenic super-enhancer formed through somatic mutation of a noncoding intergenic element. Science, 346, 1373–7. [DOI] [PMC free article] [PubMed] [Google Scholar]
- MCCARTHY DJ, CAMPBELL KR, LUN AT & WILLS QF 2017. Scater: pre-processing, quality control, normalization and visualization of single-cell RNA-seq data in R. Bioinformatics, 33,1179–1186. [DOI] [PMC free article] [PubMed] [Google Scholar]
- MCGINNIS CS, MURROW LM & GARTNER ZJ 2019. DoubletFinder: Doublet Detection in Single-Cell RNA Sequencing Data Using Artificial Nearest Neighbors. Cell Syst, 8, 329–337.e4. [DOI] [PMC free article] [PubMed] [Google Scholar]
- MILLS C, MURUGANUJAN A, EBERT D, MARCONETT CN, LEWINGER JP, THOMAS PD & MI H 2020. PEREGRINE: A genome-wide prediction of enhancer to gene relationships supported by experimental evidence. PloS one, 15, e0243791. [DOI] [PMC free article] [PubMed] [Google Scholar]
- MITSOPOULOS C, DI MICCO P, FERNANDEZ EV, DOLCIAMI D, HOLT E, MICA IL, COKER EA, TYM JE, CAMPBELL J, CHE KH, OZER B, KANNAS C, ANTOLIN AA, WORKMAN P & ALLAZIKANI B 2020. canSAR: update to the cancer translational research and drug discovery knowledgebase. Nucleic Acids Res. [DOI] [PMC free article] [PubMed] [Google Scholar]
- MOORE JE, PRATT HE, PURCARO MJ & WENG Z 2020. A curated benchmark of enhancer-gene interactions for evaluating enhancer-target gene prediction methods. Genome biology, 21, 1–16. [DOI] [PMC free article] [PubMed] [Google Scholar]
- NAGY A, LANCZKY A, MENYHART O & GYORFFY B 2018. Validation of miRNA prognostic power in hepatocellular carcinoma using expression data of independent datasets. Sci Rep, 8, 9227. [DOI] [PMC free article] [PubMed] [Google Scholar]
- NAGY Á, MUNKÁCSY G & GYŐRFFY B 2021. Pancancer survival analysis of cancer hallmark genes. Sci Rep, 11, 6047. [DOI] [PMC free article] [PubMed] [Google Scholar]
- OHNISHI T, OHBA H, SEO K-C, IM J, SATO Y, IWAYAMA Y, FURUICHI T, CHUNG S-K & YOSHIKAWA T 2007. Spatial expression patterns and biochemical properties distinguish a second myo-inositol monophosphatase IMPA2 from IMPA1. Journal of Biological Chemistry, 282, 637–646. [DOI] [PubMed] [Google Scholar]
- OLBRECHT S, BUSSCHAERT P, QIAN J, VANDERSTICHELE A, LOVERIX L, VAN GORP T, VAN NIEUWENHUYSEN E, HAN S, VAN DEN BROECK A & COOSEMANS A 2021. High-grade serous tubo-ovarian cancer refined with single-cell RNA sequencing: specific cell subtypes influence survival and determine molecular subtype classification. Genome Medicine, 13, 1–30. [DOI] [PMC free article] [PubMed] [Google Scholar]
- PANDEY V, JUNG Y, KANG J, STEINER M, QIAN P-X, BANERJEE A, MITCHELL MD, WU Z-S, ZHU T & LIU D-X 2010. Artemin reduces sensitivity to doxorubicin and paclitaxel in endometrial carcinoma cells through specific regulation of CD24. Translational oncology, 3, 218-IN5. [DOI] [PMC free article] [PubMed] [Google Scholar]
- PATEL AP, TIROSH I, TROMBETTA JJ, SHALEK AK, GILLESPIE SM, WAKIMOTO H, CAHILL DP, NAHED BV, CURRY WT, MARTUZA RL, LOUIS DN, ROZENBLATT-ROSEN O, SUVA ML, REGEV A & BERNSTEIN BE 2014. Single-cell RNA-seq highlights intratumoral heterogeneity in primary glioblastoma. Science, 344, 1396–401. [DOI] [PMC free article] [PubMed] [Google Scholar]
- QI LS, LARSON MH, GILBERT LA, DOUDNA JA, WEISSMAN JS, ARKIN AP & LIM WA 2013. Repurposing CRISPR as an RNA-guided platform for sequence-specific control of gene expression. Cell, 152, 1173–83. [DOI] [PMC free article] [PubMed] [Google Scholar]
- QUINLAN AR & HALL IM 2010. BEDTools: a flexible suite of utilities for comparing genomic features. Bioinformatics, 26, 841–2. [DOI] [PMC free article] [PubMed] [Google Scholar]
- RAN FA, HSU PD, WRIGHT J, AGARWALA V, SCOTT DA & ZHANG F 2013. Genome engineering using the CRISPR-Cas9 system. Nat Protoc, 8, 2281–2308. [DOI] [PMC free article] [PubMed] [Google Scholar]
- RITTERHOUSE LL & HOWITT BE 2016. Molecular pathology: predictive, prognostic, and diagnostic markers in uterine tumors. Surgical pathology clinics, 9, 405–426. [DOI] [PubMed] [Google Scholar]
- ROADMAP EPIGENOMICS C, KUNDAJE A, MEULEMAN W, ERNST J, BILENKY M, YEN A, HERAVI-MOUSSAVI A, KHERADPOUR P, ZHANG Z, WANG J, ZILLER MJ, AMIN V, WHITAKER JW, SCHULTZ MD, WARD LD, SARKAR A, QUON G, SANDSTROM RS, EATON ML, WU YC, PFENNING AR, WANG X, CLAUSSNITZER M, LIU Y, COARFA C, HARRIS RA, SHORESH N, EPSTEIN CB, GJONESKA E, LEUNG D, XIE W, HAWKINS RD, LISTER R, HONG C, GASCARD P, MUNGALL AJ, MOORE R, CHUAH E, TAM A, CANFIELD TK, HANSEN RS, KAUL R, SABO PJ, BANSAL MS, CARLES A, DIXON JR, FARH KH, FEIZI S, KARLIC R, KIM AR, KULKARNI A, LI D, LOWDON R, ELLIOTT G, MERCER TR, NEPH SJ, ONUCHIC V, POLAK P, RAJAGOPAL N, RAY P, SALLARI RC, SIEBENTHALL KT, SINNOTT-ARMSTRONG NA, STEVENS M, THURMAN RE, WU J, ZHANG B, ZHOU X, BEAUDET AE, BOYER LA, DE JAGER PL, FARNHAM PJ, FISHER SJ, HAUSSLER D, JONES SJ, LI W, MARRA MA, MCMANUS MT, SUNYAEV S, THOMSON JA, TLSTY TD, TSAI LH, WANG W, WATERLAND RA, ZHANG MQ, CHADWICK LH, BERNSTEIN BE, COSTELLO JF, ECKER JR, HIRST M, MEISSNER A, MILOSAVLJEVIC A, REN B, STAMATOYANNOPOULOS JA, WANG T & KELLIS M 2015. Integrative analysis of 111 reference human epigenomes. Nature, 518, 317–30. [DOI] [PMC free article] [PubMed] [Google Scholar]
- ROE JS, HWANG CI, SOMERVILLE TDD, MILAZZO JP, LEE EJ, DA SILVA B, MAIORINO L, TIRIAC H, YOUNG CM, MIYABAYASHI K, FILIPPINI D, CREIGHTON B, BURKHART RA, BUSCAGLIA JM, KIM EJ, GREM JL, LAZENBY AJ, GRUNKEMEYER JA, HOLLINGSWORTH MA, GRANDGENETT PM, EGEBLAD M, PARK Y, TUVESON DA & VAKOC CR 2017. Enhancer Reprogramming Promotes Pancreatic Cancer Metastasis. Cell, 170, 875–888 e20. [DOI] [PMC free article] [PubMed] [Google Scholar]
- SAEGUSA M, HASHIMURA M, SUZUKI E, YOSHIDA T & KUWATA T 2012. Transcriptional up-regulation of Sox9 by NF-κB in endometrial carcinoma cells, modulating cell proliferation through alteration in the p14ARF/p53/p21WAF1 pathway. The American journal of pathology, 181, 684–692. [DOI] [PubMed] [Google Scholar]
- SARLOMO-RIKALA M, KOVATICH AJ, BARUSEVICIUS A & MIETTINEN M 1998. CD117: a sensitive marker for gastrointestinal stromal tumors that is more specific than CD34. Modern pathology: an official journal of the United States and Canadian Academy of Pathology, Inc, 11, 728–734. [PubMed] [Google Scholar]
- SATPATHY AT, GRANJA JM, YOST KE, QI Y, MESCHI F, MCDERMOTT GP, OLSEN BN, MUMBACH MR, PIERCE SE, CORCES MR, SHAH P, BELL JC, JHUTTY D, NEMEC CM, WANG J, WANG L, YIN Y, GIRESI PG, CHANG ALS, ZHENG GXY, GREENLEAF WJ & CHANG HY 2019. Massively parallel single-cell chromatin landscapes of human immune cell development and intratumoral T cell exhaustion. Nat Biotechnol, 37, 925–936. [DOI] [PMC free article] [PubMed] [Google Scholar]
- SCRUCCA L, FOP M, MURPHY TB & RAFTERY AE 2016. mclust 5: Clustering, Classification and Density Estimation Using Gaussian Finite Mixture Models. R J, 8, 289–317. [PMC free article] [PubMed] [Google Scholar]
- SENGEZ B, AYGÜN I, SHEHWANA H, TOYRAN N, TERCAN AVCI S, KONU O, STEMMLER MP & ALOTAIBI H 2019. The transcription factor Elf3 is essential for a successful mesenchymal to epithelial transition. Cells, 8, 858. [DOI] [PMC free article] [PubMed] [Google Scholar]
- SIEGEL RL, MILLER KD, FUCHS HE & JEMAL A 2021. Cancer statistics, 2021. CA: a cancer journal for clinicians, 71, 7–33. [DOI] [PubMed] [Google Scholar]
- SIEGEL RL, MILLER KD & JEMAL A 2018. Cancer statistics, 2018. CA Cancer J Clin, 68, 7–30. [DOI] [PubMed] [Google Scholar]
- SLYPER M, PORTER CBM, ASHENBERG O, WALDMAN J, DROKHLYANSKY E, WAKIRO I, SMILLIE C, SMITH-ROSARIO G, WU J, DIONNE D, VIGNEAU S, JANE-VALBUENA J, TICKLE TL, NAPOLITANO S, SU MJ, PATEL AG, KARLSTROM A, GRITSCH S, NOMURA M, WAGHRAY A, GOHIL SH, TSANKOV AM, JERBY-ARNON L, COHEN O, KLUGHAMMER J, ROSEN Y, GOULD J, NGUYEN L, HOFREE M, TRAMONTOZZI PJ, LI B, WU CJ, IZAR B, HAQ R, HODI FS, YOON CH, HATA AN, BAKER SJ, SUVA ML, BUENO R, STOVER EH, CLAY MR, DYER MA, COLLINS NB, MATULONIS UA, WAGLE N, JOHNSON BE, ROTEM A, ROZENBLATT-ROSEN O & REGEV A 2020. A single-cell and single-nucleus RNA-Seq toolbox for fresh and frozen human tumors. Nat Med, 26, 792–802. [DOI] [PMC free article] [PubMed] [Google Scholar]
- SOCIETY AC 2016. Cancer facts & figures. American Cancer Society. [Google Scholar]
- STOREY JD & TIBSHIRANI R 2003. Statistical significance for genomewide studies. Proceedings of the National Academy of Sciences, 100, 9440–9445. [DOI] [PMC free article] [PubMed] [Google Scholar]
- STUART T, BUTLER A, HOFFMAN P, HAFEMEISTER C, PAPALEXI E, MAUCK WM 3RD, HAO Y, STOECKIUS M, SMIBERT P & SATIJA R 2019. Comprehensive Integration of Single-Cell Data. Cell, 177, 1888–1902 e21. [DOI] [PMC free article] [PubMed] [Google Scholar]
- STURGEON CM, DUFFY MJ, STENMAN U-H, LILJA H, BRUNNER N, CHAN DW, BABAIAN R, BAST JR RC, DOWELL B & ESTEVA FJ 2008. National Academy of Clinical Biochemistry laboratory medicine practice guidelines for use of tumor markers in testicular, prostate, colorectal, breast, and ovarian cancers. Oxford University Press. [DOI] [PubMed] [Google Scholar]
- SZASZ AM, LANCZKY A, NAGY A, FORSTER S, HARK K, GREEN JE, BOUSSIOUTAS A, BUSUTTIL R, SZABO A & GYORFFY B 2016. Cross-validation of survival associated biomarkers in gastric cancer using transcriptomic data of 1,065 patients. Oncotarget, 7, 49322–49333. [DOI] [PMC free article] [PubMed] [Google Scholar]
- SÁNCHEZ-TILLÓ E, SILES L, DE BARRIOS O, CUATRECASAS M, VAQUERO EC, CASTELLS A & POSTIGO A 2011. Expanding roles of ZEB factors in tumorigenesis and tumor progression. American journal of cancer research, 1, 897. [PMC free article] [PubMed] [Google Scholar]
- TAN X, SUN Y, THAPA N, LIAO Y, HEDMAN AC & ANDERSON RA 2015. LAPTM4B is a PtdIns(4,5)P2 effector that regulates EGFR signaling, lysosomal sorting, and degradation. EMBO J, 34, 475–90. [DOI] [PMC free article] [PubMed] [Google Scholar]
- TEAM RC 2020. R: A Language and Environment for Statistical Computing. [Google Scholar]
- TICKLE TI, GEORGESCU C, BROWN M & HAAS B 2019. inferCNV of the Trinity CTAT Project [Online]. Available: https://github.com/broadinstitute/inferCNV [Accessed].
- TYM JE, MITSOPOULOS C, COKER EA, RAZAZ P, SCHIERZ AC, ANTOLIN AA & AL-LAZIKANI B 2016. canSAR: an updated cancer research and drug discovery knowledgebase. Nucleic Acids Res, 44, D938–43. [DOI] [PMC free article] [PubMed] [Google Scholar]
- WANG W, VILELLA F, ALAMA P, MORENO I, MIGNARDI M, ISAKOVA A, PAN W, SIMON C. & QUAKE SR 2020. Single-cell transcriptomic atlas of the human endometrium during the menstrual cycle. Nat Med, 26, 1644–1653. [DOI] [PubMed] [Google Scholar]
- WATANABE K, PANCHY N, NOGUCHI S, SUZUKI H. & HONG T. 2019. Combinatorial perturbation analysis reveals divergent regulations of mesenchymal genes during epithelial-to-mesenchymal transition. NPJ systems biology and applications, 5, 1–15. [DOI] [PMC free article] [PubMed] [Google Scholar]
- WEI H, HELLSTRÖM KE & HELLSTRÖM I. 2012. Elafin selectively regulates the sensitivity of ovarian cancer cells to genotoxic drug-induced apoptosis. Gynecologic oncology, 125, 727–733. [DOI] [PMC free article] [PubMed] [Google Scholar]
- WEINTRAUB AS, LI CH, ZAMUDIO AV, SIGOVA AA, HANNETT NM, DAY DS, ABRAHAM BJ, COHEN MA, NABET B, BUCKLEY DL, GUO YE, HNISZ D, JAENISCH R, BRADNER JE, GRAY NS & YOUNG RA 2017. YY1 Is a Structural Regulator of Enhancer-Promoter Loops. Cell, 171, 1573–1588.e28. [DOI] [PMC free article] [PubMed] [Google Scholar]
- WESTIN SN 2014. mTORC1/2 Inhibitor AZD2014 or the Oral AKT Inhibitor AZD5363 for Recurrent Endometrial and Ovarian [Online]. Available: https://ClinicalTrials.gov/show/NCT02208375 [Accessed].
- WICKHAM H. 2016. ggplot2: Elegant Graphics for Data Analysis, Springer-Verlag; New York. [Google Scholar]
- WILLIAMS J, LUCAS PC, GRIFFITH KA, CHOI M, FOGOROS S, HU YY & LIU JR 2005. Expression of Bcl-xL in ovarian carcinoma is associated with chemoresistance and recurrent disease. Gynecologic oncology, 96, 287–295. [DOI] [PubMed] [Google Scholar]
- XIE S, DUAN J, LI B, ZHOU P. & HON GC 2017. Multiplexed Engineering and Analysis of Combinatorial Enhancer Activity in Single Cells. Mol Cell, 66, 285–299.e5. [DOI] [PubMed] [Google Scholar]
- XU C. & SU Z. 2015. Identification of cell types from single-cell transcriptomes using a novel clustering method. Bioinformatics, 31, 1974–80. [DOI] [PMC free article] [PubMed] [Google Scholar]
- YANG H, JIANG X, LI B, YANG HJ, MILLER M, YANG A, DHAR A. & PAVLETICH NP 2017. Mechanisms of mTORC1 activation by RHEB and inhibition by PRAS40. Nature, 552, 368–373. [DOI] [PMC free article] [PubMed] [Google Scholar]
- YOSHIHARA K, SHAHMORADGOLI M, MARTINEZ E, VEGESNA R, KIM H, TORRES-GARCIA W, TREVINO V, SHEN H, LAIRD PW, LEVINE DA, CARTER SL, GETZ G, STEMKE-HALE K, MILLS GB & VERHAAK RG 2013. Inferring tumour purity and stromal and immune cell admixture from expression data. Nat Commun, 4, 2612. [DOI] [PMC free article] [PubMed] [Google Scholar]
- ZHANG K, LIU L, WANG M, YANG M, LI X, XIA X, TIAN J, TAN S. & LUO L. 2020. A novel function of IMPA2, plays a tumor-promoting role in cervical cancer. Cell death & disease, 11, 1–14. [DOI] [PMC free article] [PubMed] [Google Scholar]
- ZHANG X, CHOI PS, FRANCIS JM, IMIELINSKI M, WATANABE H, CHERNIACK AD & MEYERSON M. 2016. Identification of focally amplified lineage-specific super-enhancers in human epithelial cancers. Nat Genet, 48, 176–82. [DOI] [PMC free article] [PubMed] [Google Scholar]
- ZHANG Y, LIU T, MEYER CA, EECKHOUTE J, JOHNSON DS, BERNSTEIN BE, NUSBAUM C, MYERS RM, BROWN M, LI W. & LIU XS 2008. Model-based analysis of ChIP-Seq (MACS). Genome Biol, 9, R137. [DOI] [PMC free article] [PubMed] [Google Scholar]
- ZHU LJ, GAZIN C, LAWSON ND, PAGÈS H, LIN SM, LAPOINTE DS & GREEN MR 2010. ChIPpeakAnno: a Bioconductor package to annotate ChIP-seq and ChIP-chip data. BMC bioinformatics, 11, 1–10. [DOI] [PMC free article] [PubMed] [Google Scholar]
Associated Data
This section collects any data citations, data availability statements, or supplementary materials included in this article.
Supplementary Materials
Table S1. Extended clinical data and library information for 11 gynecologic tumor specimens, Related to Table 1. (Table_S1_clinical_data.xlsx)
Table S2. scRNA-seq barcode metadata, clustering, and cell type annotations, Related to Figures 1, 3, and 4.(Table_S2_scRNA_metadata.xlsx)
Table S3. scATAC-seq barcode metadata, clustering, and inferred cell type annotations, Related to Figures 1, 3, and 4. (Table_S3_scATAC_metadata.xlsx)
Table S4. Kaplan-Meier data summary and associated metadata with directions to reproduce the analyses on kmplot.com, Related to STAR Methods. (Table_S4_KM_metadata.xlsx)
Table S5. FIMO transcription factor motif scanning results for the LAPTM4B enhancers 1–5 and promoter in high-grade serous ovarian cancer, Related to Figure 4. (Table_S5_ranked_FIMO_results.xlsx)
There are three sets of files for each cohort of patients in this study: 1) statistically significant peak-to-gene links with all peak types and no correlation thresholding, 2) statistically significant distal peak-to-gene links with correlation >= 0.45, and 3) statistically significant cancer-specific distal peak-to-gene links with correlation >= 0.45. (Data_S1_Peak_to_Gene_Links.tsv.gz)
Data Availability Statement
Processed single-cell RNA-seq data and single-cell ATAC-seq have been deposited at GEO(https://www.ncbi.nlm.nih.gov/geo/) under the accession number GSE173682 and are publicly available as of the date of publication. Raw data (10x FASTQs) will be available with controlled access via dbGAP under the accession number phs002340.v1.p1 (https://www.ncbi.nlm.nih.gov/gap/).
All original code has been deposited on the Zenodo platform (DOI: 10.5281/zenodo.5546110) and is publicly available at the Github repository scENDO_scOVAR_2020 (https://github.com/RegnerM2015/scENDO_scOVAR_2020).
Any additional information required to reanalyze the data reported in this paper is available from the lead contact (hfranco@med.unc.edu).