A Return to Profitability
恢复盈利
Following Bitcoin’s recovery to $107K, many investors are once again in profit. However, current price levels appear less attractive for profit-taking than during the initial $100k breakout, with investor behavior suggesting a renewed phase of HODLing and reduced distribution.
随着比特币回升至 10.7 万美元,许多投资者再次获利。然而,当前价格水平的获利回吐吸引力似乎不如最初突破 10 万美元时那么大,投资者行为表明,新一轮的持币观望和减持现象正在上演。


Executive Summary 执行摘要
- The scale of the Bitcoin network remains remarkably impressive, now recording a market cap of $2.1T, and a realized cap of $955B. Together, they highlight not only the substantial capital inflows into Bitcoin, but also its maturation toward becoming a multi-trillion-dollar asset.
比特币网络的规模依然令人印象深刻,目前市值已达2.1万亿美元,实际市值达9550亿美元。这些数字不仅凸显了比特币正在获得大量资本流入,也表明它正朝着成为数万亿美元资产的方向发展。 - Following a recovery to $107k, a super-majority of Bitcoin investors are now holding unrealized profits. In total, the unrealized profit held across investors sits at a staggering $1.2T.
在比特币价格回升至 10.7 万美元后,绝大多数比特币投资者目前持有未实现利润。总体而言,所有投资者持有的未实现利润高达 1.2 万亿美元。 - HODLing appears to be the dominant market mechanic across a plethora of spending metrics, with realized profit taking declining, liveliness continuing to trend downwards, and Long-Term Holder supply surging to a new ATH.
在众多支出指标中,HODLing 似乎是主要的市场机制,已实现的获利回吐正在下降,活跃度继续呈下降趋势,而长期持有者的供应量则飙升至新的高点。 - Stablecoin purchasing power remains largely neutral, suggesting that the market views the current price level as being at a relative equilibrium. Additionally, demand from institutions for regulated Bitcoin exposure remains robust, with sustained and sizeable inflows.
稳定币的购买力基本保持中性,表明市场认为当前价格水平处于相对均衡状态。此外,机构投资者对受监管的比特币敞口的需求依然强劲,持续且可观的资金流入。
Market Recap 市场回顾
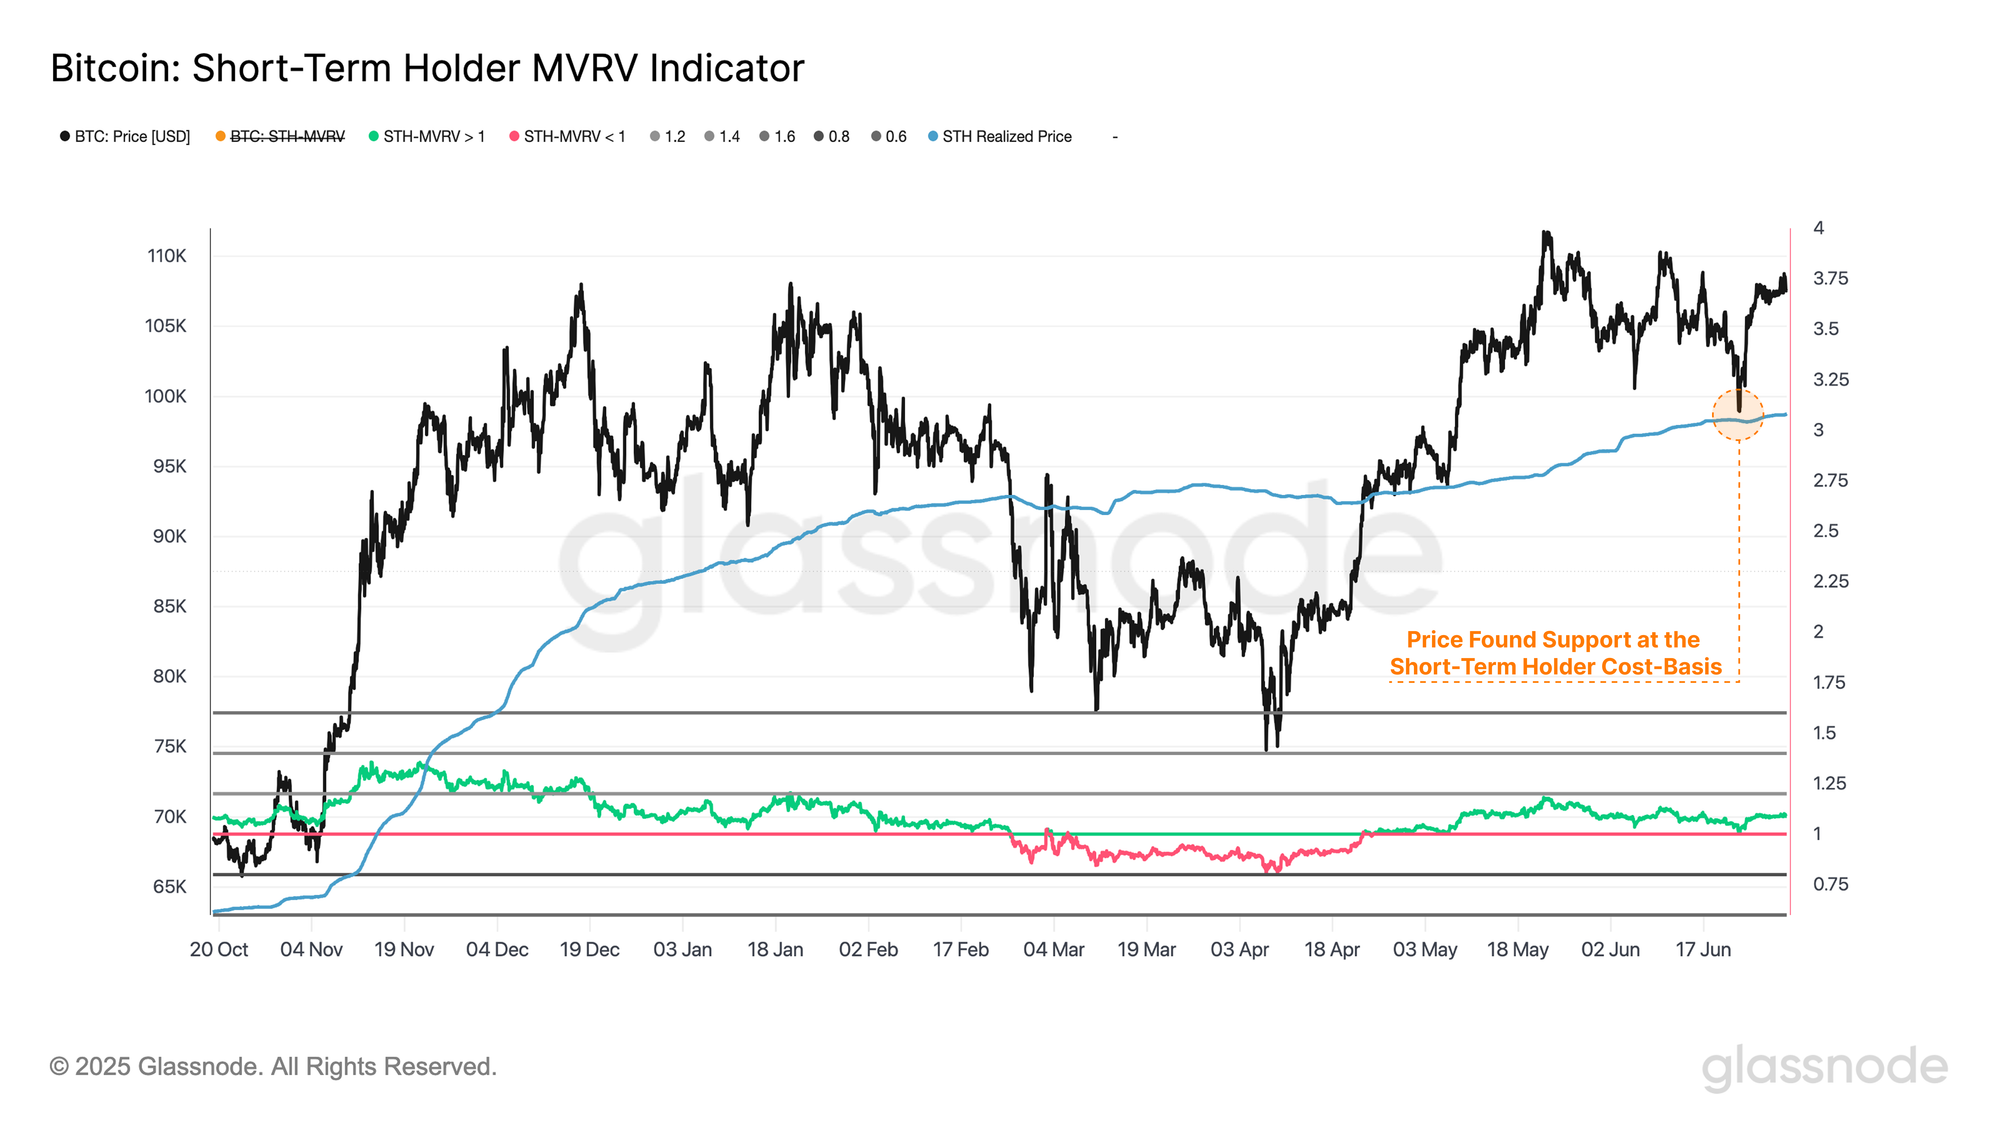
As tensions escalated between Israel and Iran last week, markets responded with a sharp sell-off, with Bitcoin prices dropping from $106K to $99K. However, the market found strong support near the Short-Term Holder cost basis at $98.3K, a key level that often distinguishes between local bullish and bearish conditions.
随着上周以色列和伊朗之间的紧张局势升级,市场遭遇大幅抛售,比特币价格从 10.6 万美元跌至 9.9 万美元。然而,市场在 9.83 万美元的短期持有成本基差附近获得了强劲支撑,这一关键水平通常可以区分局部看涨和看跌情况。
In a market driven by geopolitical headlines, the risk of further downside is still in the air, however, a U.S.-brokered ceasefire between the two nations has helped stabilize sentiment, and fuel a recovery to $107k.
在受地缘政治新闻驱动的市场中,进一步下跌的风险仍然存在,然而,在美国斡旋下,两国之间达成的停火有助于稳定市场情绪,并推动金价回升至 10.7 万美元。
The market’s ability to hold the Short-Term Holder cost basis during such a volatile and uncertain period is a constructive signal, suggesting that the bulls are still in control, and that underlying momentum may remain skewed to the upside.
市场在如此动荡和不确定的时期内能够保持短期持有者的成本基础是一个建设性信号,表明多头仍然处于控制之中,并且潜在势头可能仍然偏向上行。
Total Profitability 总盈利能力
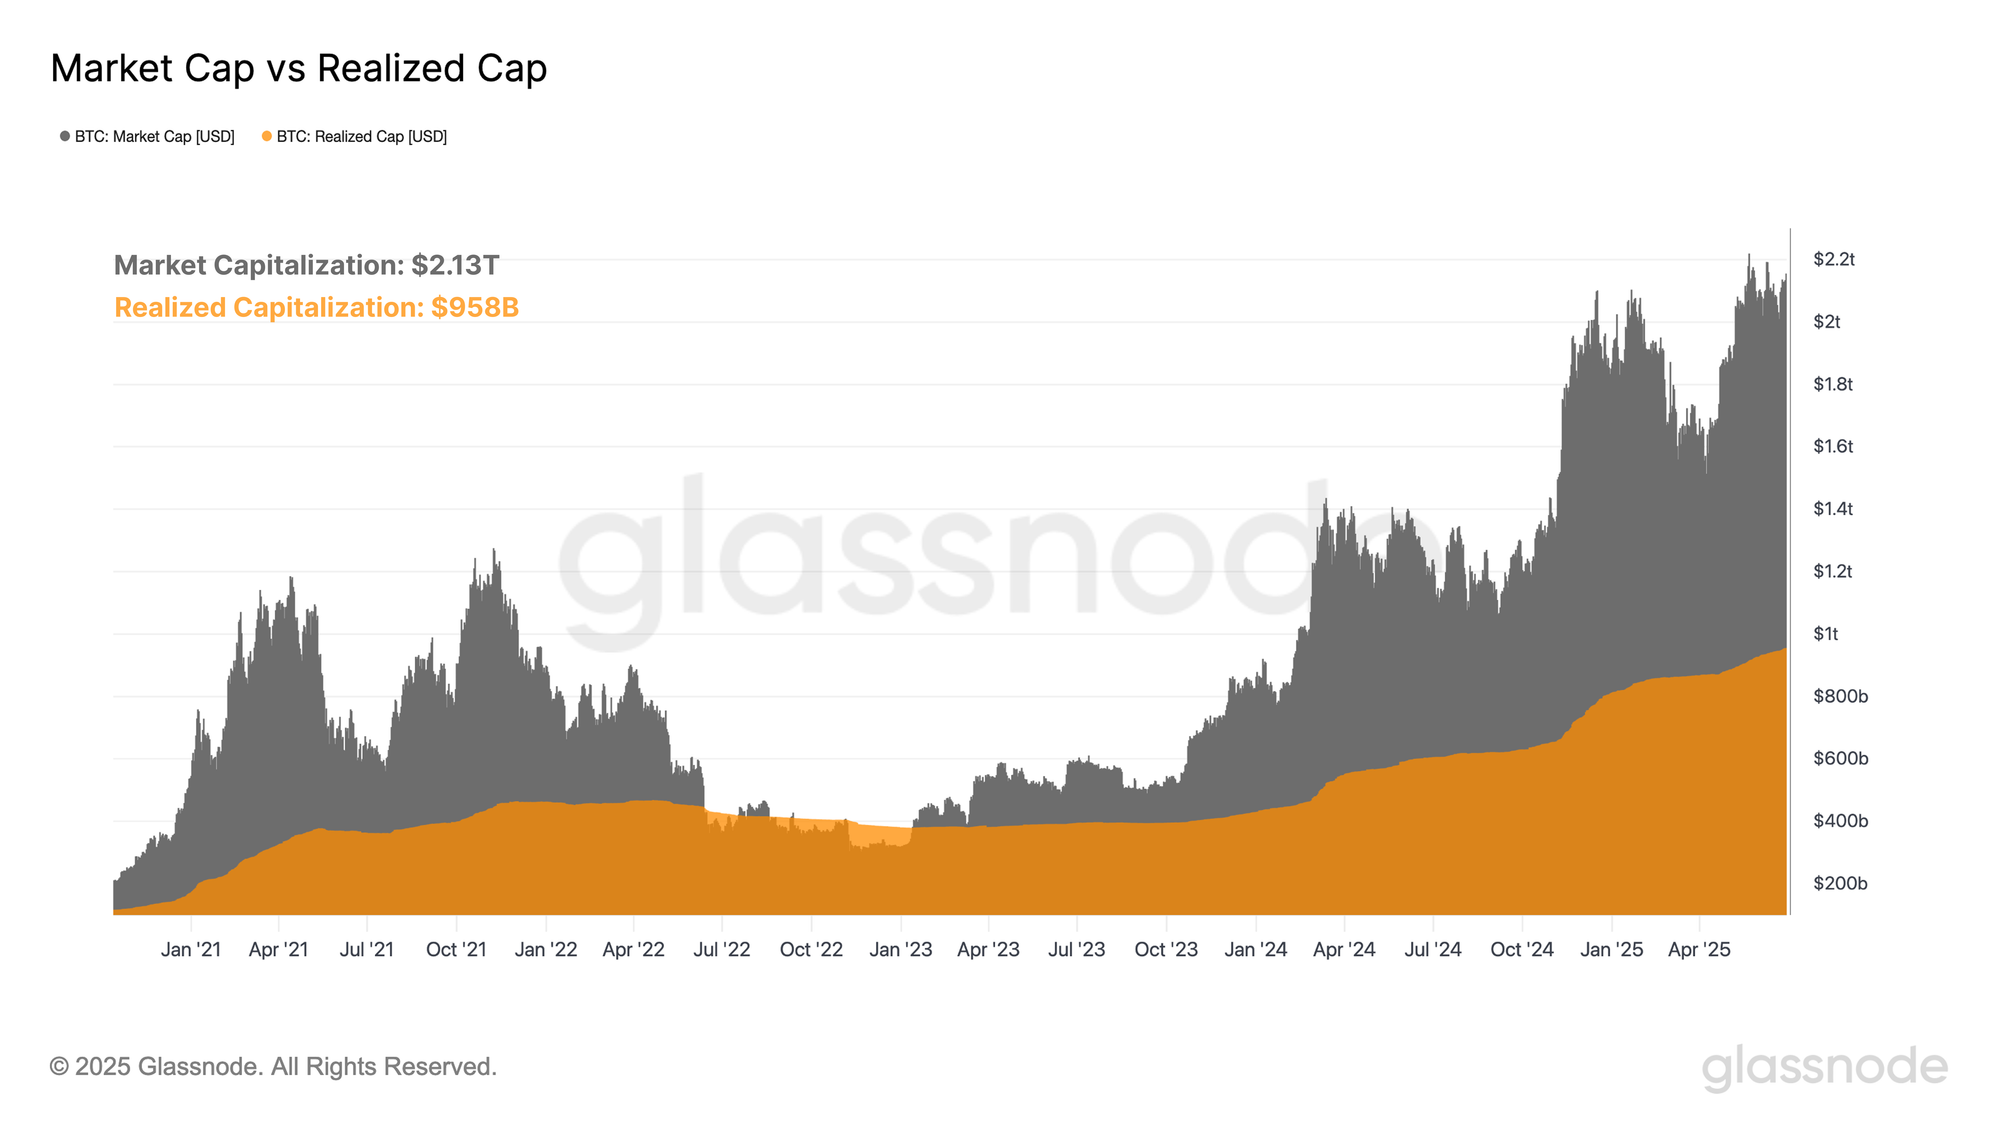
With Bitcoin trading just shy of its all-time high, we can apply two valuation frameworks to assess the assets current scale. The first is the traditional Market Capitalization, which values each coin in the circulating supply at the current market price. The second uses on-chain pricestamping of each coin to compute the Realized Cap, which values each coin at the last transacted price, and provides a more accurate measurement of true network liquidity.
鉴于比特币交易价格略低于历史最高点,我们可以运用两种估值框架来评估其当前的资产规模。第一种是传统的市值法,它以当前市场价格对流通供应中的每枚代币进行估值。第二种是使用每枚代币的链上价格标记来计算实际市值法,它以最新的交易价格对每枚代币进行估值,从而更准确地衡量真实的网络流动性。
- Market Cap: $2.13T 市值:2.13万亿美元
- Realized Cap: $958B 已实现市值:9580亿美元
Both measures have experienced substantial growth this cycle, with the market cap rising from a low of $304B to $2.13T, whilst the realized cap has surged from $400B to $955B. Together, they highlight not only the substantial capital inflows into Bitcoin, but also its maturation toward becoming a multi-trillion-dollar asset.
在本轮周期中,这两项指标均经历了大幅增长,市值从 3040 亿美元的低点飙升至 2.13 万亿美元,而实际市值则从 4000 亿美元飙升至 9550 亿美元。这两项指标不仅凸显了比特币获得了大量资本流入,也表明其正朝着成为数万亿美元资产的方向发展。
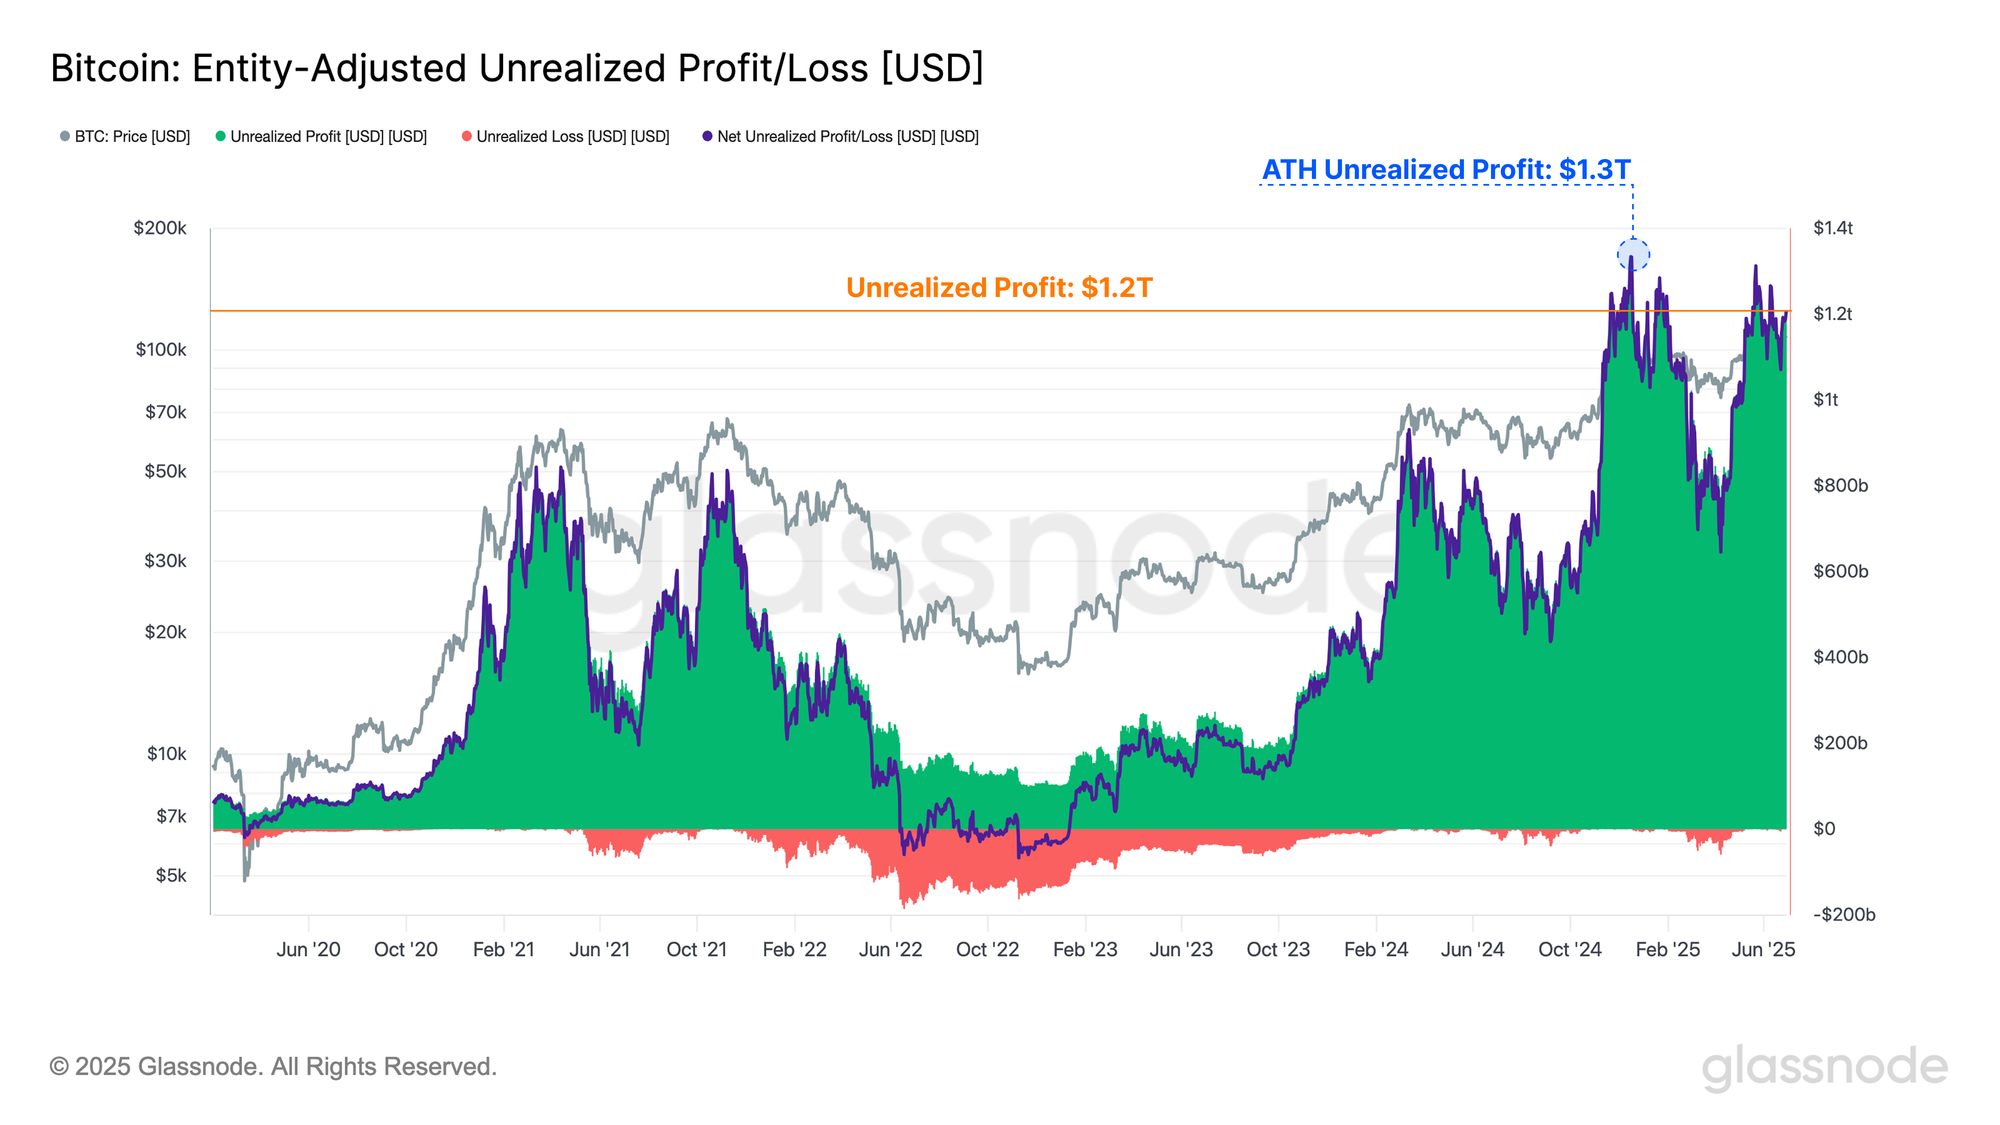
If we consider market capitalization as the spot valuation of the circulating supply, and the realized capitalization as the value ‘saved’ or ‘stored’ in BTC, then the difference between the two represents the unrealized profit (or loss) held by investors across the network.
At present, the total unrealized profit stands at an estimated $1.2 trillion, underscoring the substantial value appreciation experienced by Bitcoin investors, but also the incentive for potential sell-side pressure that may emerge if sentiment shifts.
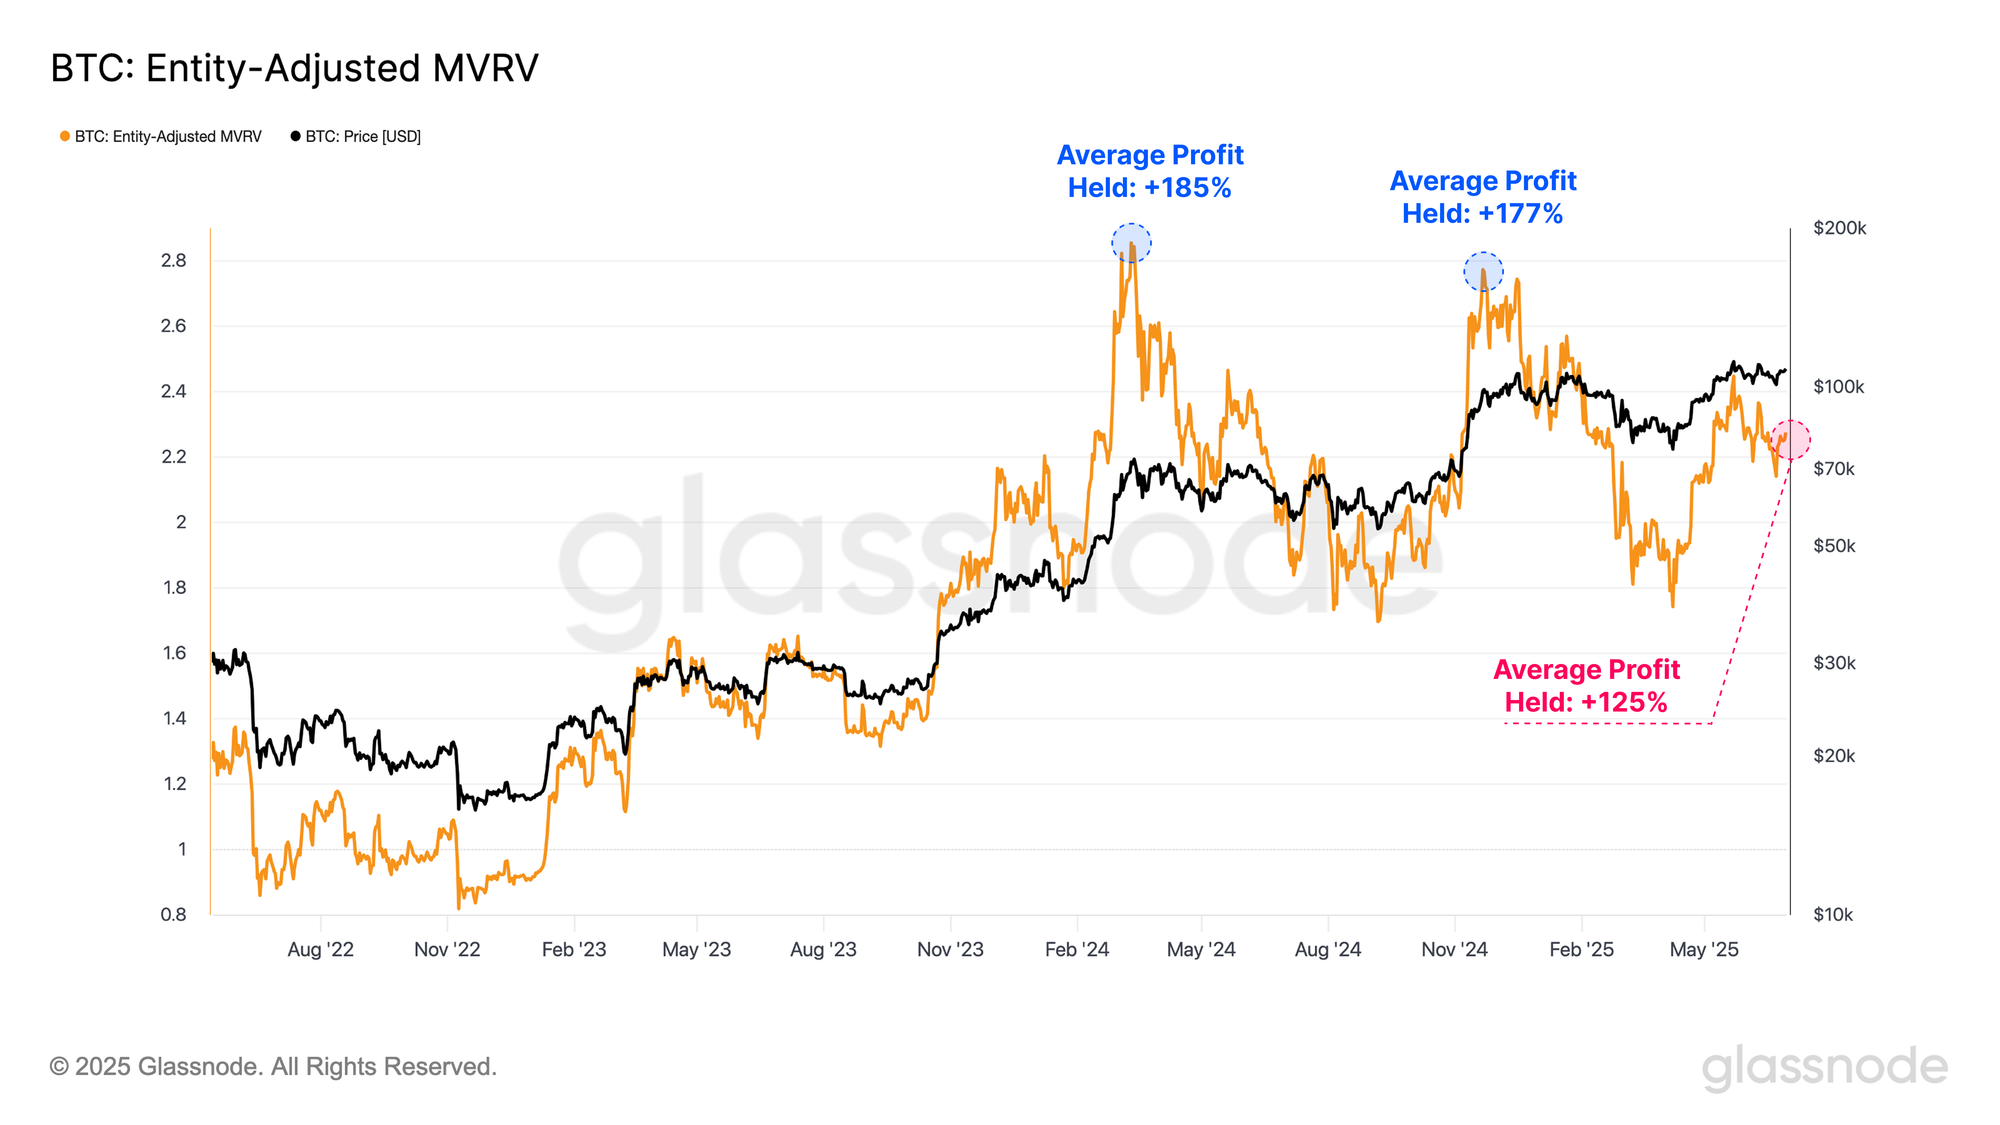
The MVRV metric provides us with an alternative, dimensionless view on investor profitability, and is constructed as the ratio of Market Cap / Realized Cap. This provides crucial information on the magnitude of paper gains, or losses held by the average market participant.
At the moment, the average paper gain held per investor stands at +125%, suggesting Bitcoin investors are sitting on significant profits. This remains substantially lower than the +180% profitability seen in March-2024 when the price hit the then $73k ATH, and also when the market initially broke $100k in Dec-2024.
With dollar-denominated unrealized profits trading near ATHs and the MVRV Ratio lower than the peak by comparison, this highlights a divergence between the two profitability measures. This suggests that the realized cap (capital inflows) has grown at a relatively faster rate compared to the market cap (price appreciation) over recent months.
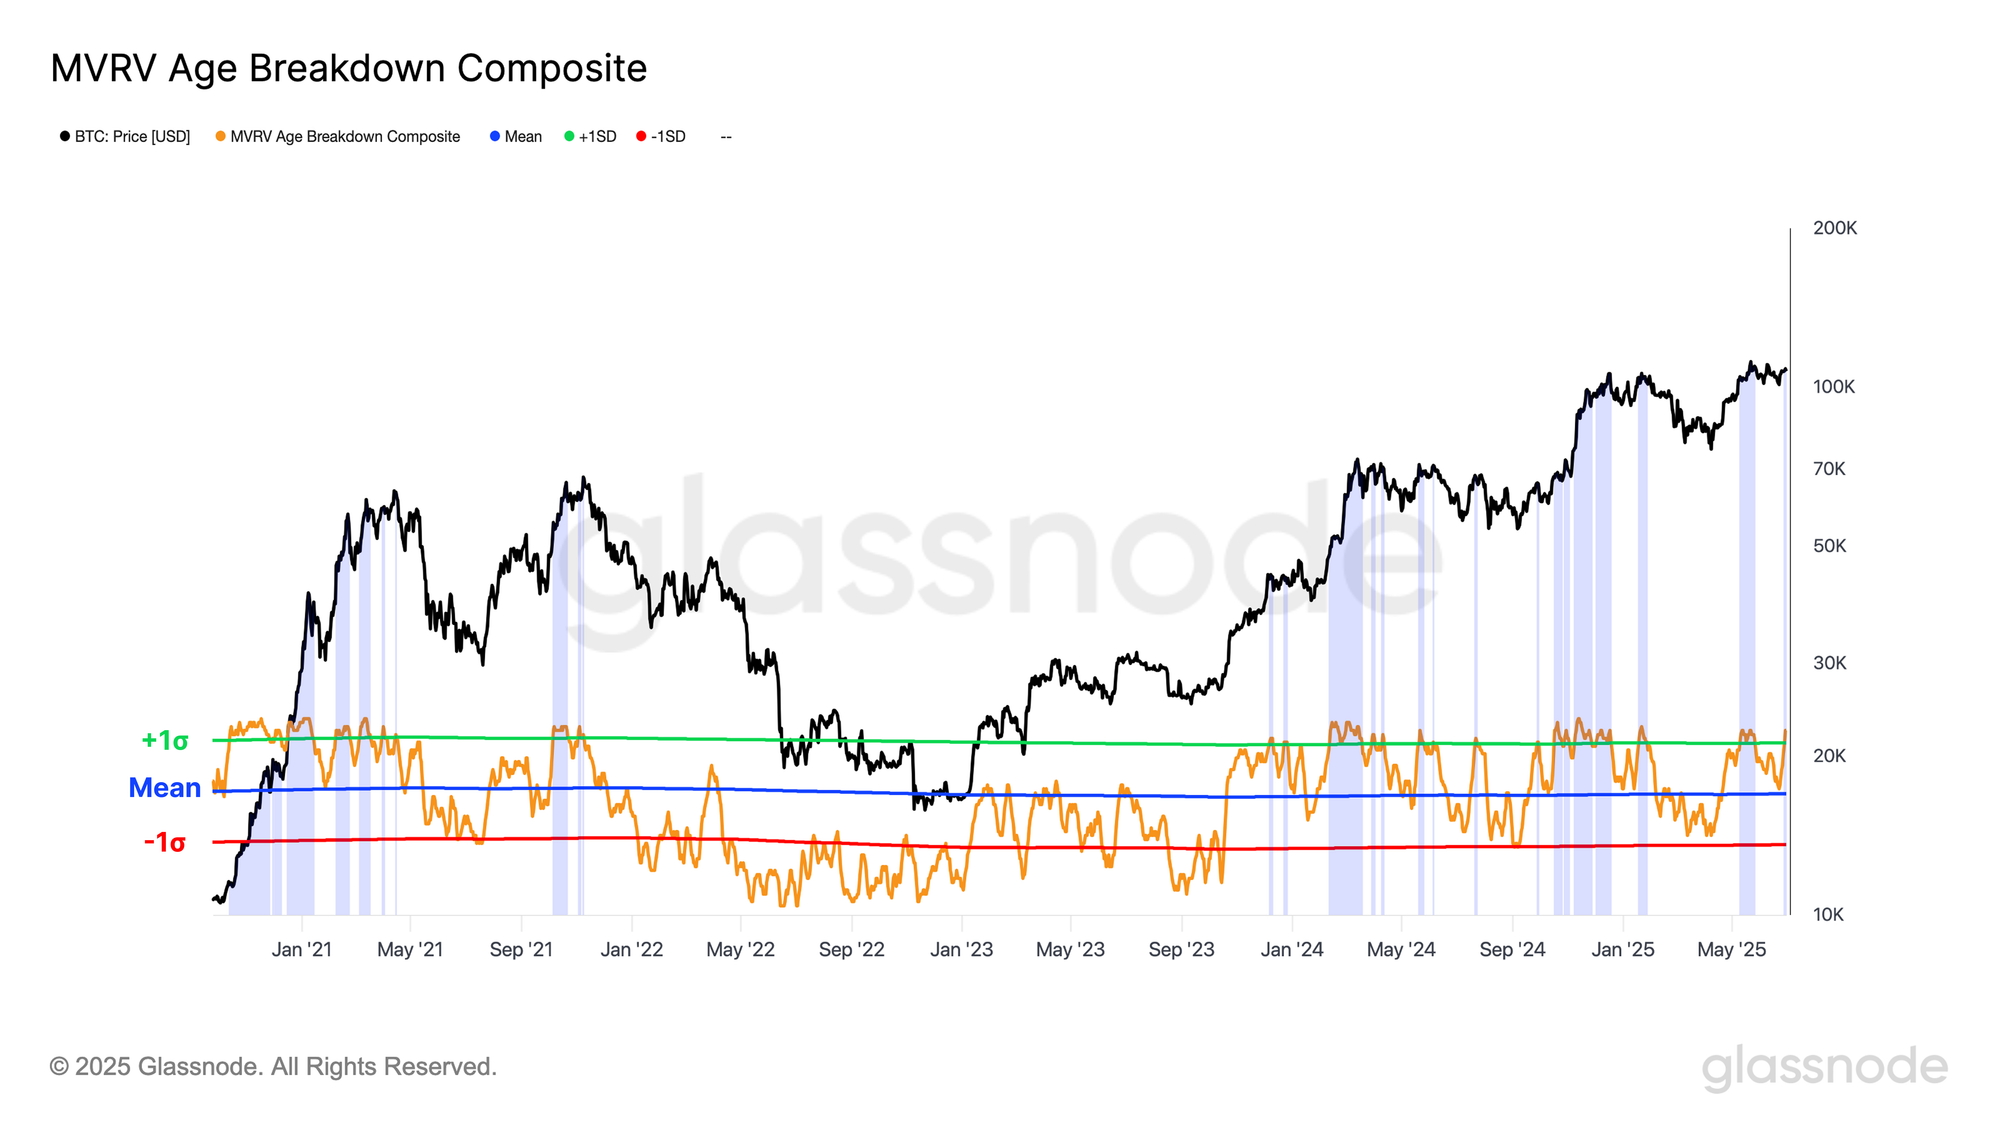
To increase the granularity of our analysis, we construct an oscillator designed to assess the profitability status across various coin age cohorts. This equal-weighted composite measures the number of age-based cohorts that, on average, are holding their coins in profit. Conceptually, this functions as a type of momentum indicator, tracking whether a growing share of the investor base is moving into profit or loss.
We can observe that the recent price contraction did not significantly impact investor profitability, unlike the sharper drawdowns seen during the accumulation ranges of May–Sep 2024 and Jan–Apr 2025. In addition, the composite has recently crossed above its +1 standard deviation threshold, signaling a positive profitability across holders of all coin ages, and a likely positive backdrop for sentiment.
Profits Continue to Dry Up
Now that we have established that the market is holding substantial unrealized profits, the next step is to assess how these investors are responding, and whether they are taking profit off the table.
To evaluate this, we can observe the magnitude of profit or loss locked in by transactions occurring on-chain each day. Realized profits have remained relatively muted over recent weeks, especially when considering that prices are only a stones throw off the ATH.
Around $872M worth of is currently being locked in profit per day, which is notably less that the $2.8B and $3.2B in realized profit seen during the $73K, and $107K all-time high formations, respectively.

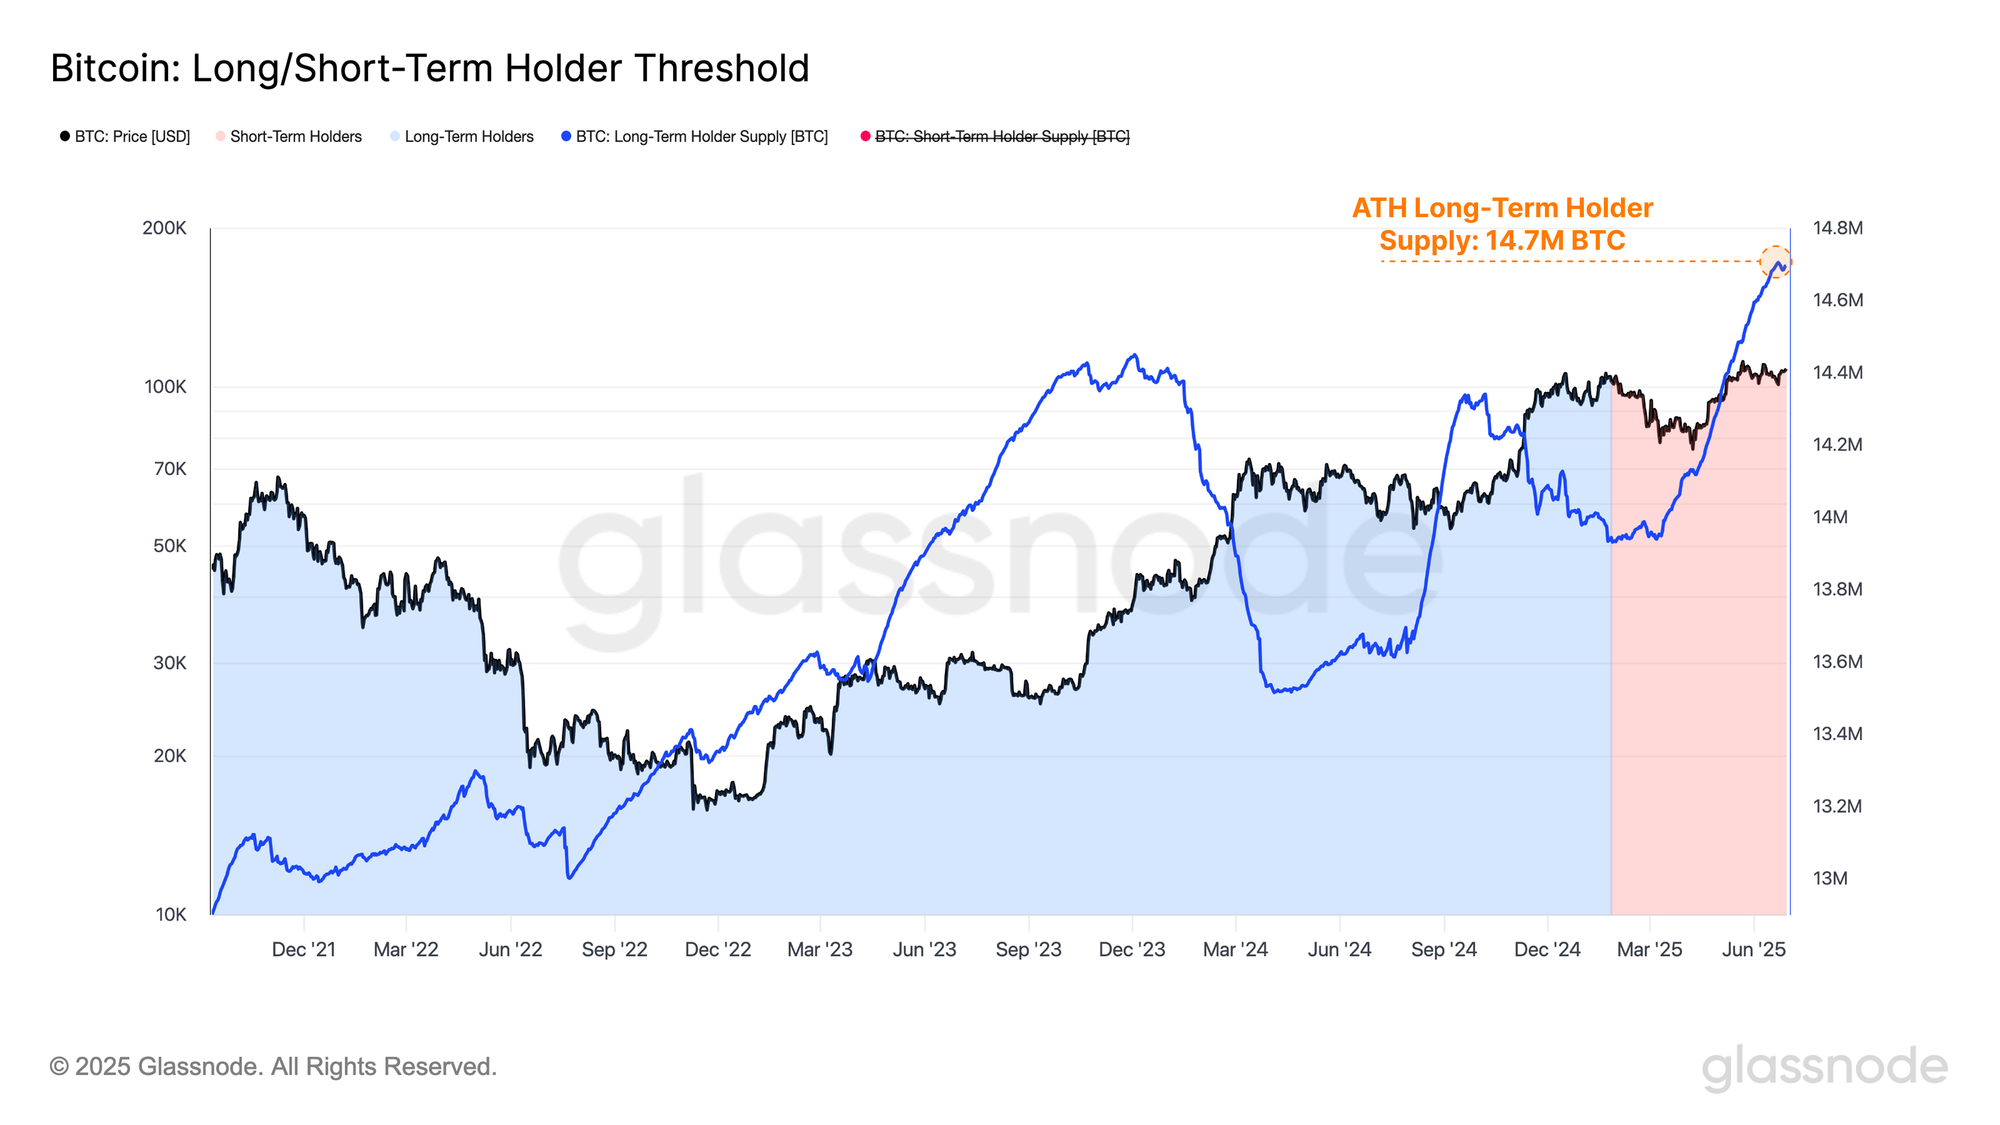
The decline in sell-side pressure is particularly evident when examining the total supply held by the Long-Term Holder (LTH) cohort, which recently reached a new all-time high of 14.7M BTC. This underscores that HODLing remains the dominant market behavior amongst investors, with accumulation and maturation flows significantly outweighing distribution pressures.
The 155-day time threshold required for coins to enter the LTH cohort is currently approaching the second ATH formation in late January. This indicates that investors who purchased during the breakout above $100K have largely held onto their coins, indicative of constructive sentiment under the surface.
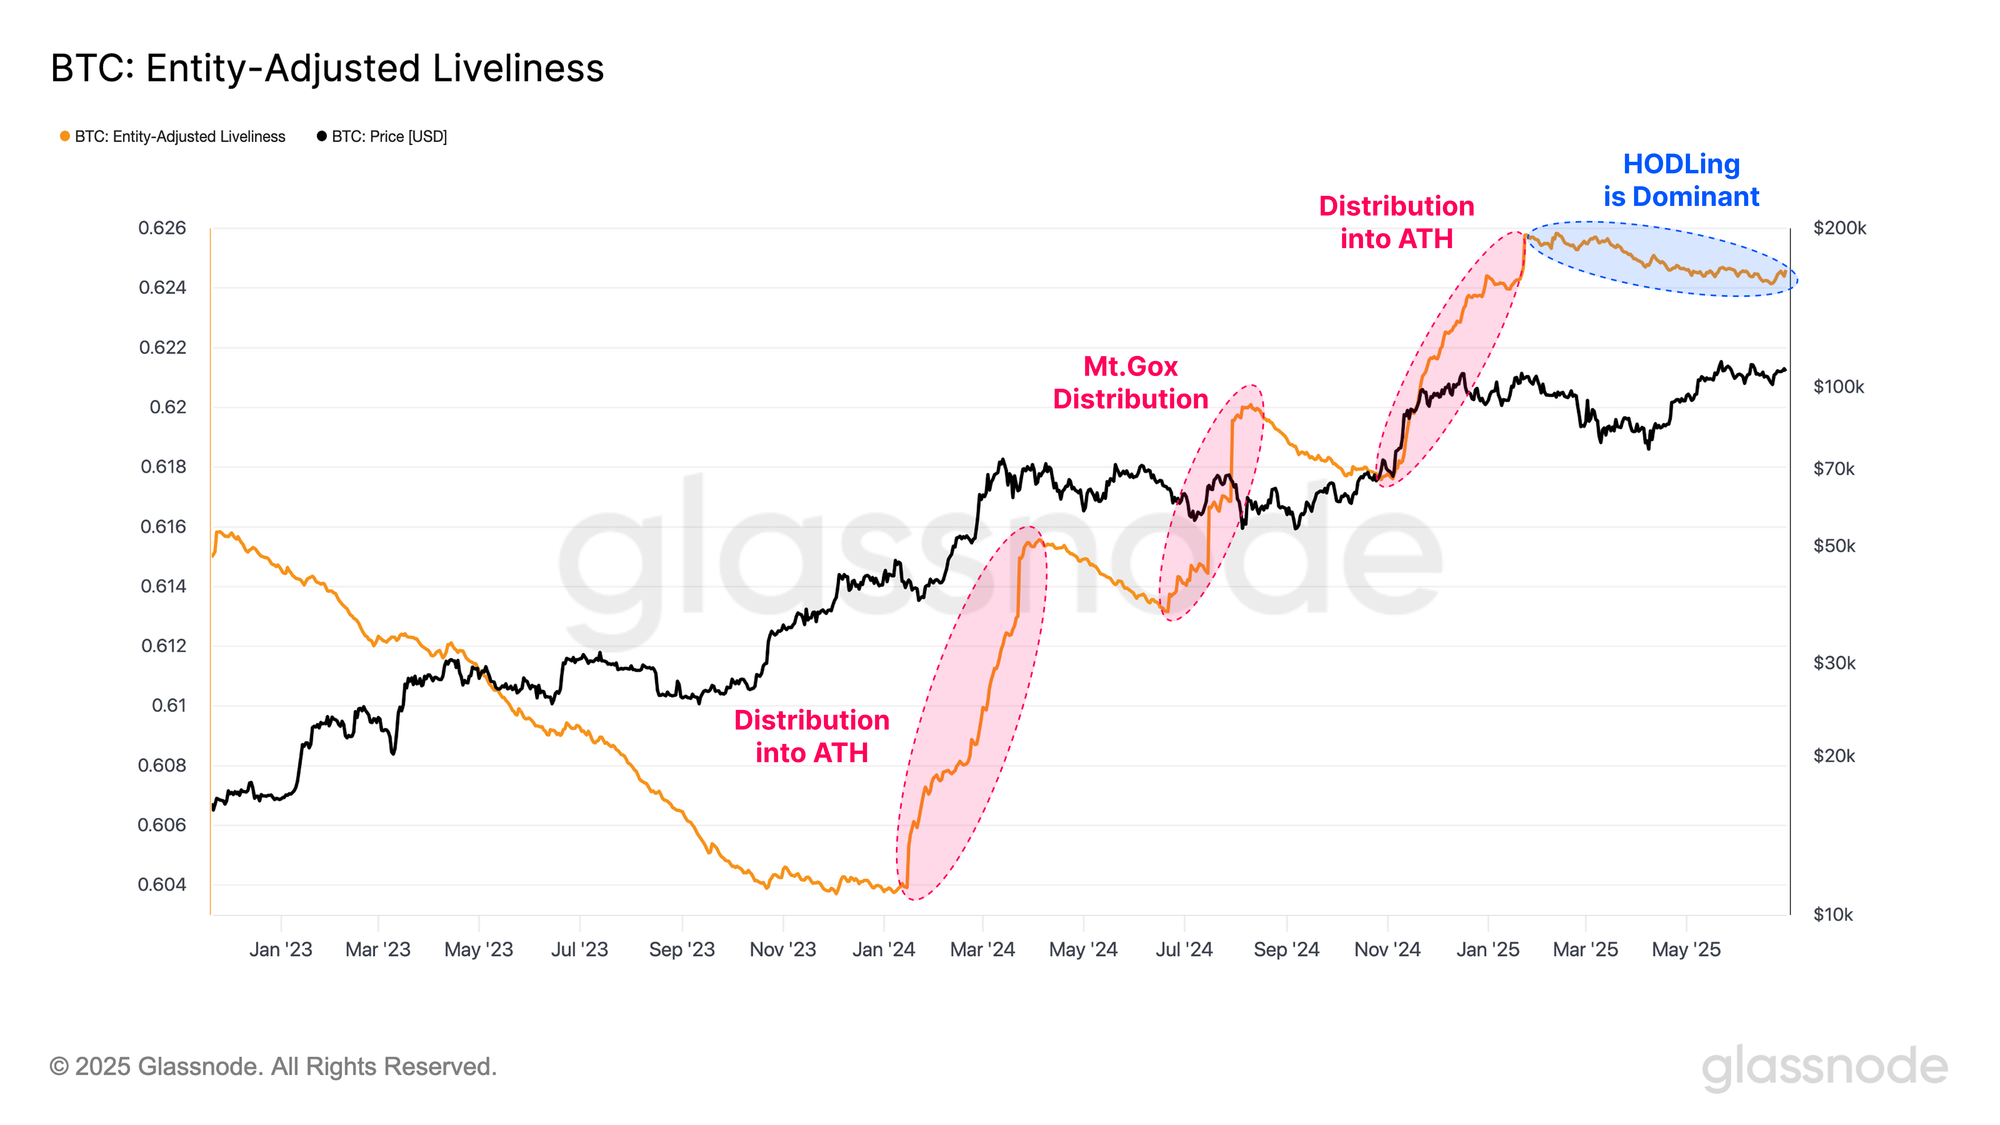
The Liveliness metric also captures this change in market character, and is constructed by assessing the all-time balance between coinday destruction (spending) and coinday creation (HODLing).
- Uptrends suggests spending is the dominant investor preference.
- Downtrends suggest HODLing is the dominant market mechanic.
During the two previous all-time high formations, the Liveliness metric saw meaningful upticks, highlighting a market dominated by spending activity and profit taking. Interestingly, this typical characteristic was absent during the most recent ATH break, and Liveliness has continued trending downward.
This further reinforces that HODLing remains the dominant behavior among investors, and that a range expansion in price may be necessary to incentivize renewed spending activity.
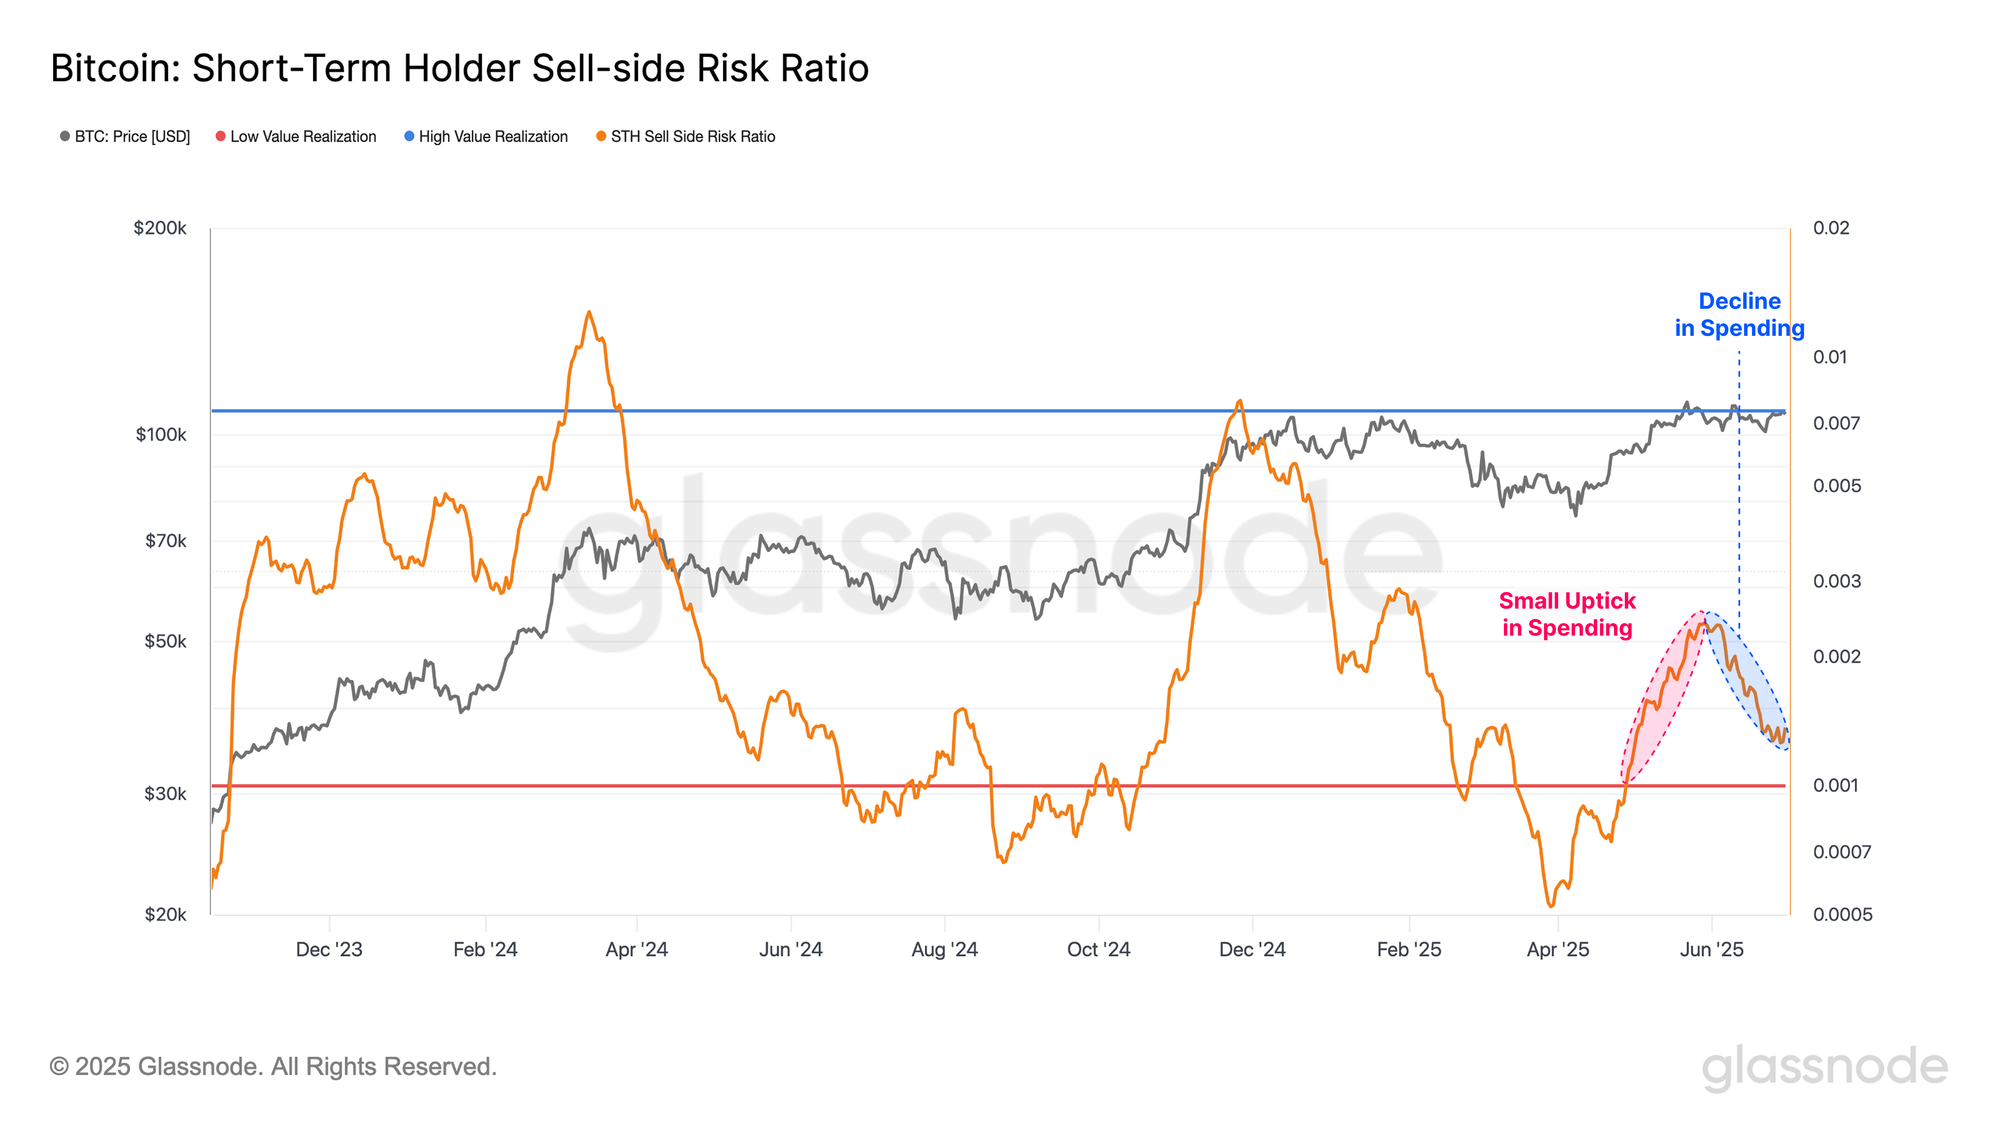
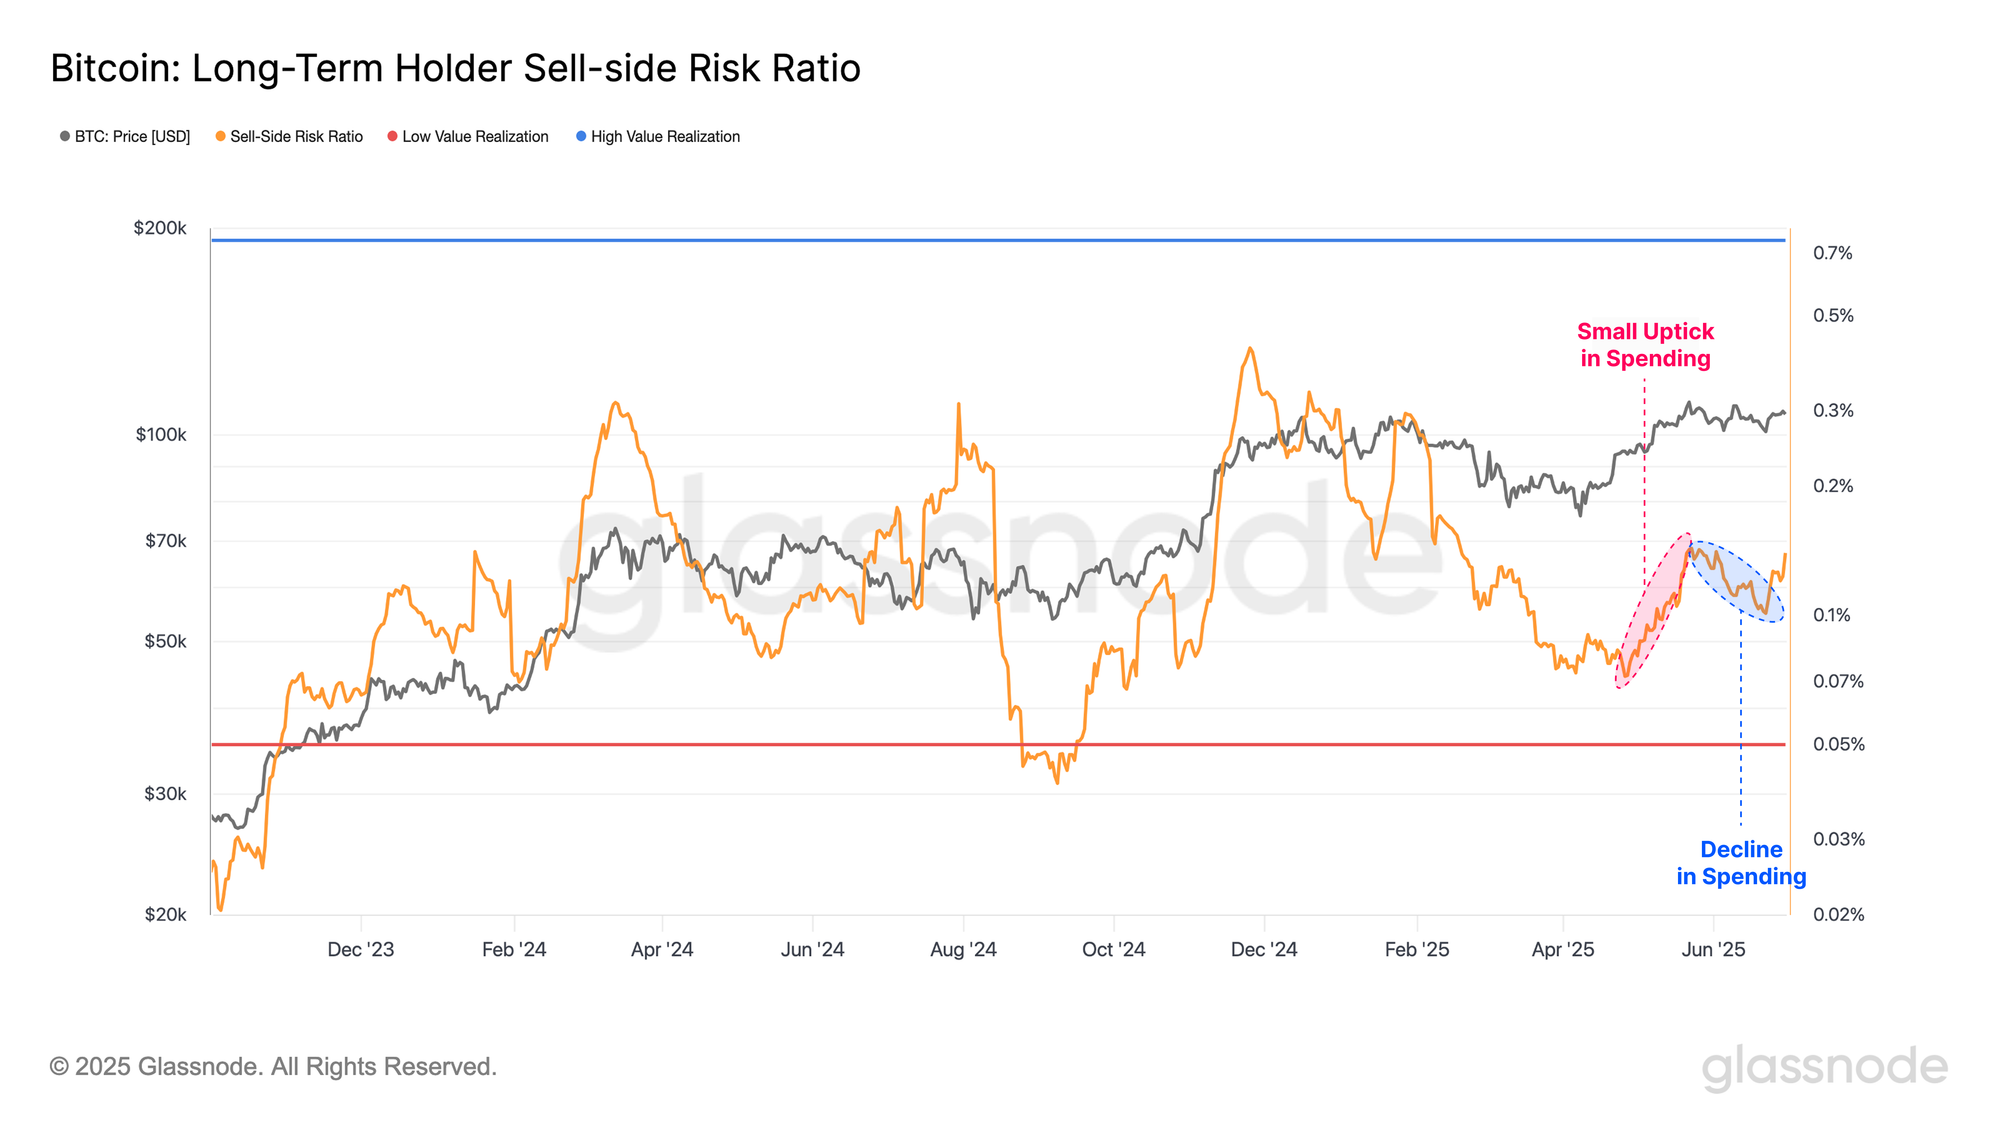
The Sell-Side Risk Ratio is a powerful tool used to gauge both investor activity in the markets, as well as whether the market is approaching degree of equilibrium. It can be interpreted within the following framework:
- High values indicate that investors are realizing significant profits or losses relative to their cost basis. This typically follows a high-volatility price move and suggests that the market may need time to re-establish equilibrium.
- Low values imply that coins are being spent near their original cost basis, signaling that profit and loss-taking has diminished. This reflects a more balanced market and often coincides with periods of reduced volatility.
Following an uptick in profit-taking at the all-time high, the Short-Term Holder cohort has markedly reduced their distribution pressures. This again suggests that the current price range is not compelling enough for investors to continue selling, implying that the market may need to move higher (or lower) to unlock additional supply.
In confluence, a similar structure is emerging across the profit and loss-taking behavior of Long-Term Holders. Following a brief uptick in sell-side pressure into the all-time high, these mature investors have also significantly slowed their spending.
This behavior aligns with broader market signals, including the overall decline in realized profit and loss volumes, the continued surge in Long-Term Holder supply, and the sustained downtrend in the Liveliness metric. All of these indicators reinforce a view that HODLing is the dominant behavior for investors at the present time.
In Search of Demand
Stablecoins have become a critical component of the digital asset ecosystem, serving as the primary quote asset for trading across both centralized and decentralized venues. Functionally, they represent readily available capital, or "dry powder", available for digital asset purchases.
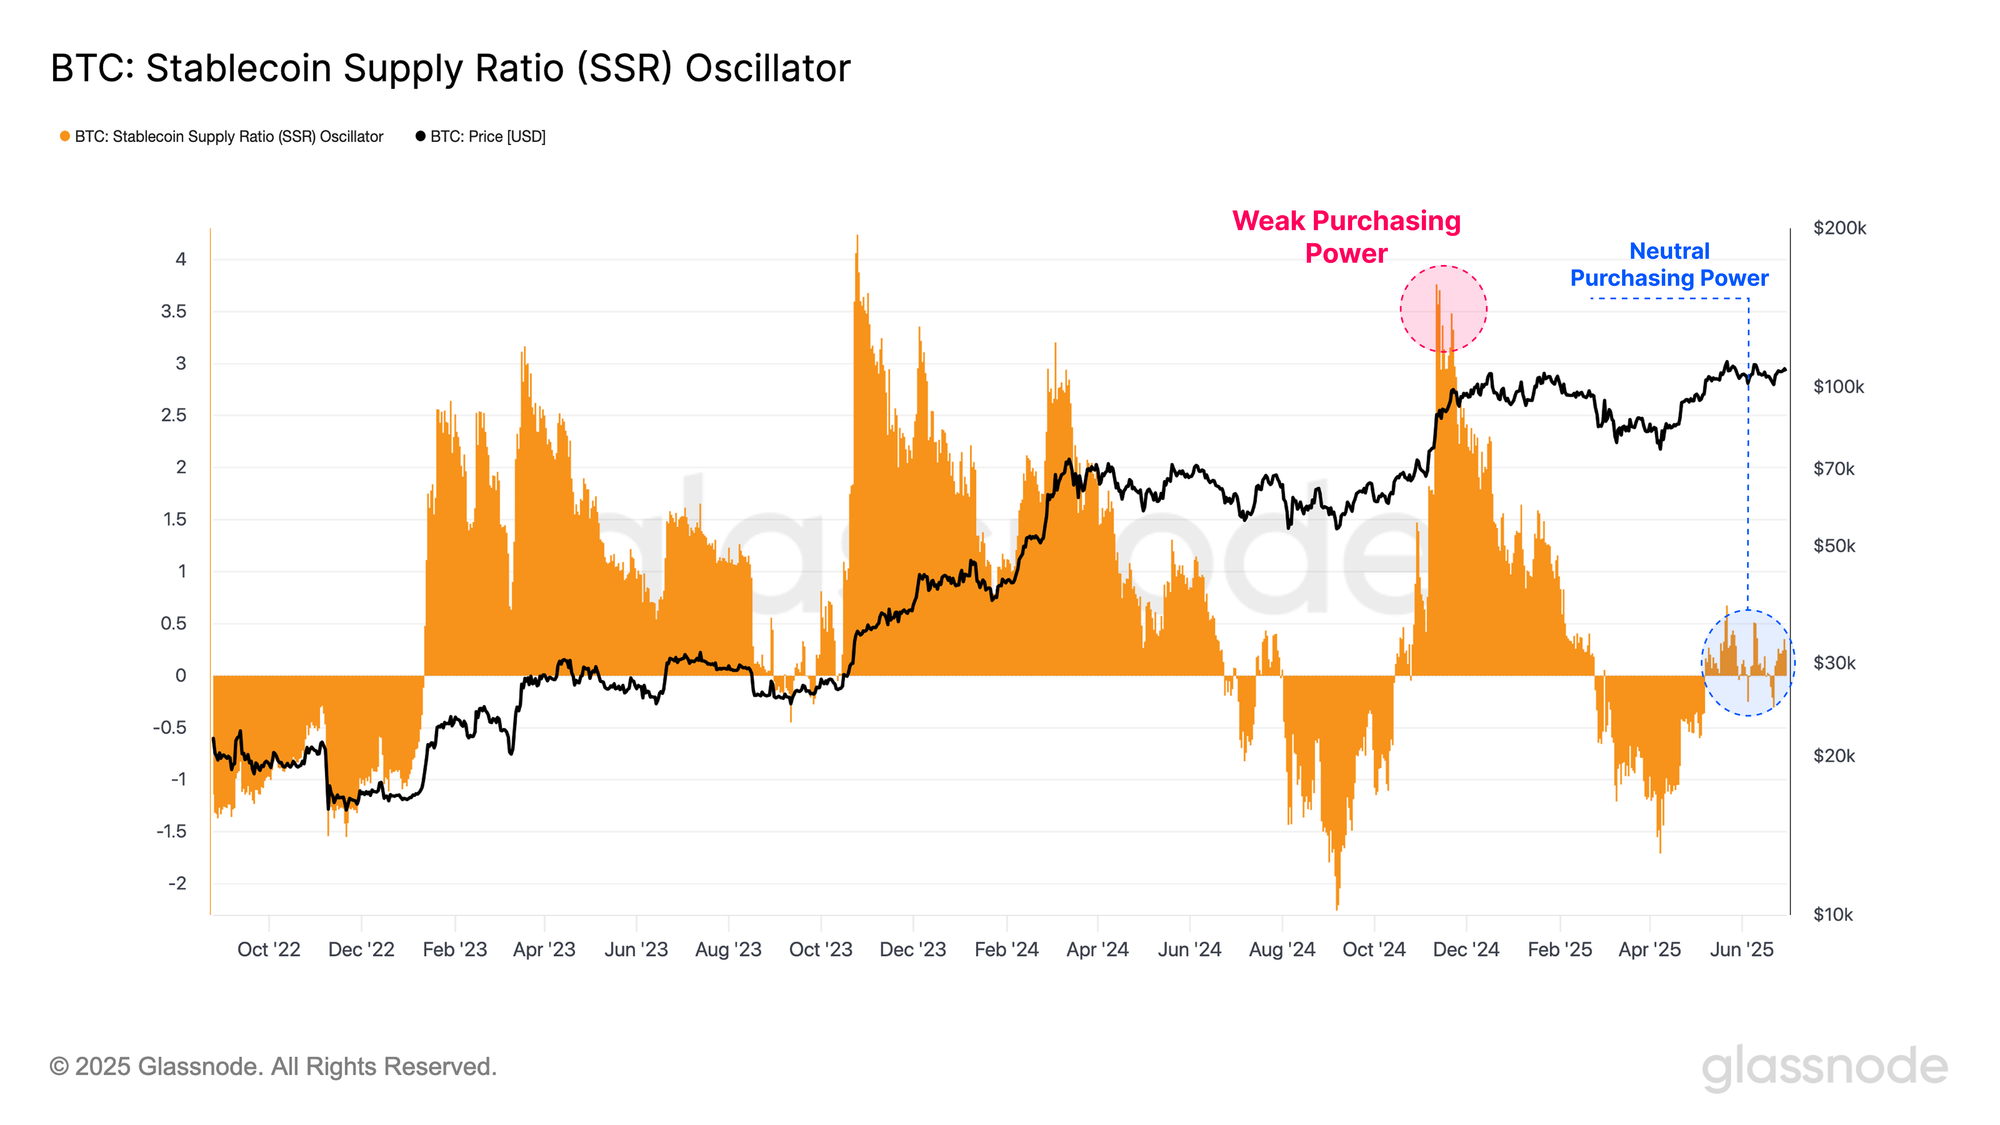
To quantify the purchasing power of stablecoins, we can employ the Stablecoin Supply Ratio Oscillator (SSR), which measures the ratio between the Bitcoin supply and the supply of stablecoins (denominated in BTC). This metric offers a proxy for the relative demand pressure between BTC and USD liquidity:
- Low SSR signals greater stablecoin-denominated buying power relative to BTC supply.
- High SSR suggests reduced stablecoin purchasing capacity relative to BTC, potentially reflecting weaker demand.
Currently, the normalized Stablecoin Supply Ratio (SSR) is oscillating near its baseline, another measure suggesting that the market views the current price level as being at a relative equilibrium. This is particularly notable when compared to the previous $100K breakout, during which the SSR was significantly higher. Despite similar price levels, this shift suggests that investor purchasing power has improved markedly, reflecting stronger underlying demand conditions.
Another way we can assess the relative strength of stablecoin purchasing power is through the Exchange Buying Power metric. This metrics records the 30-day change in major stablecoin supplies on exchanges, and subtracts the USD denominated 30-day change in BTC and ETH flows, and can be considered under the following framework.
- Positive values and uptrends indicate that a larger or increasing volume of USD-denominated stablecoins is flowing into exchanges relative to BTC and ETH over the past 30 days. This trend suggests greater stablecoin buying power is available on exchanges, which may support increased demand and liquidity for major crypto assets.
- Negative values and downtrends reflect a smaller or decreasing flow of stablecoins into exchanges relative to BTC and ETH over the same period. This points to reduced stablecoin-denominated buying power, potentially signaling weaker demand and tighter liquidity conditions across the market.
The market appears to be transitioning away from a strong period of stablecoin inflows into exchanges regime, suggesting a potential rotation of liquidity from stablecoins, into the major assets. If sustained, this could be considered as a tailwind for digital asset valuations, as stablecoin capital is deployed.

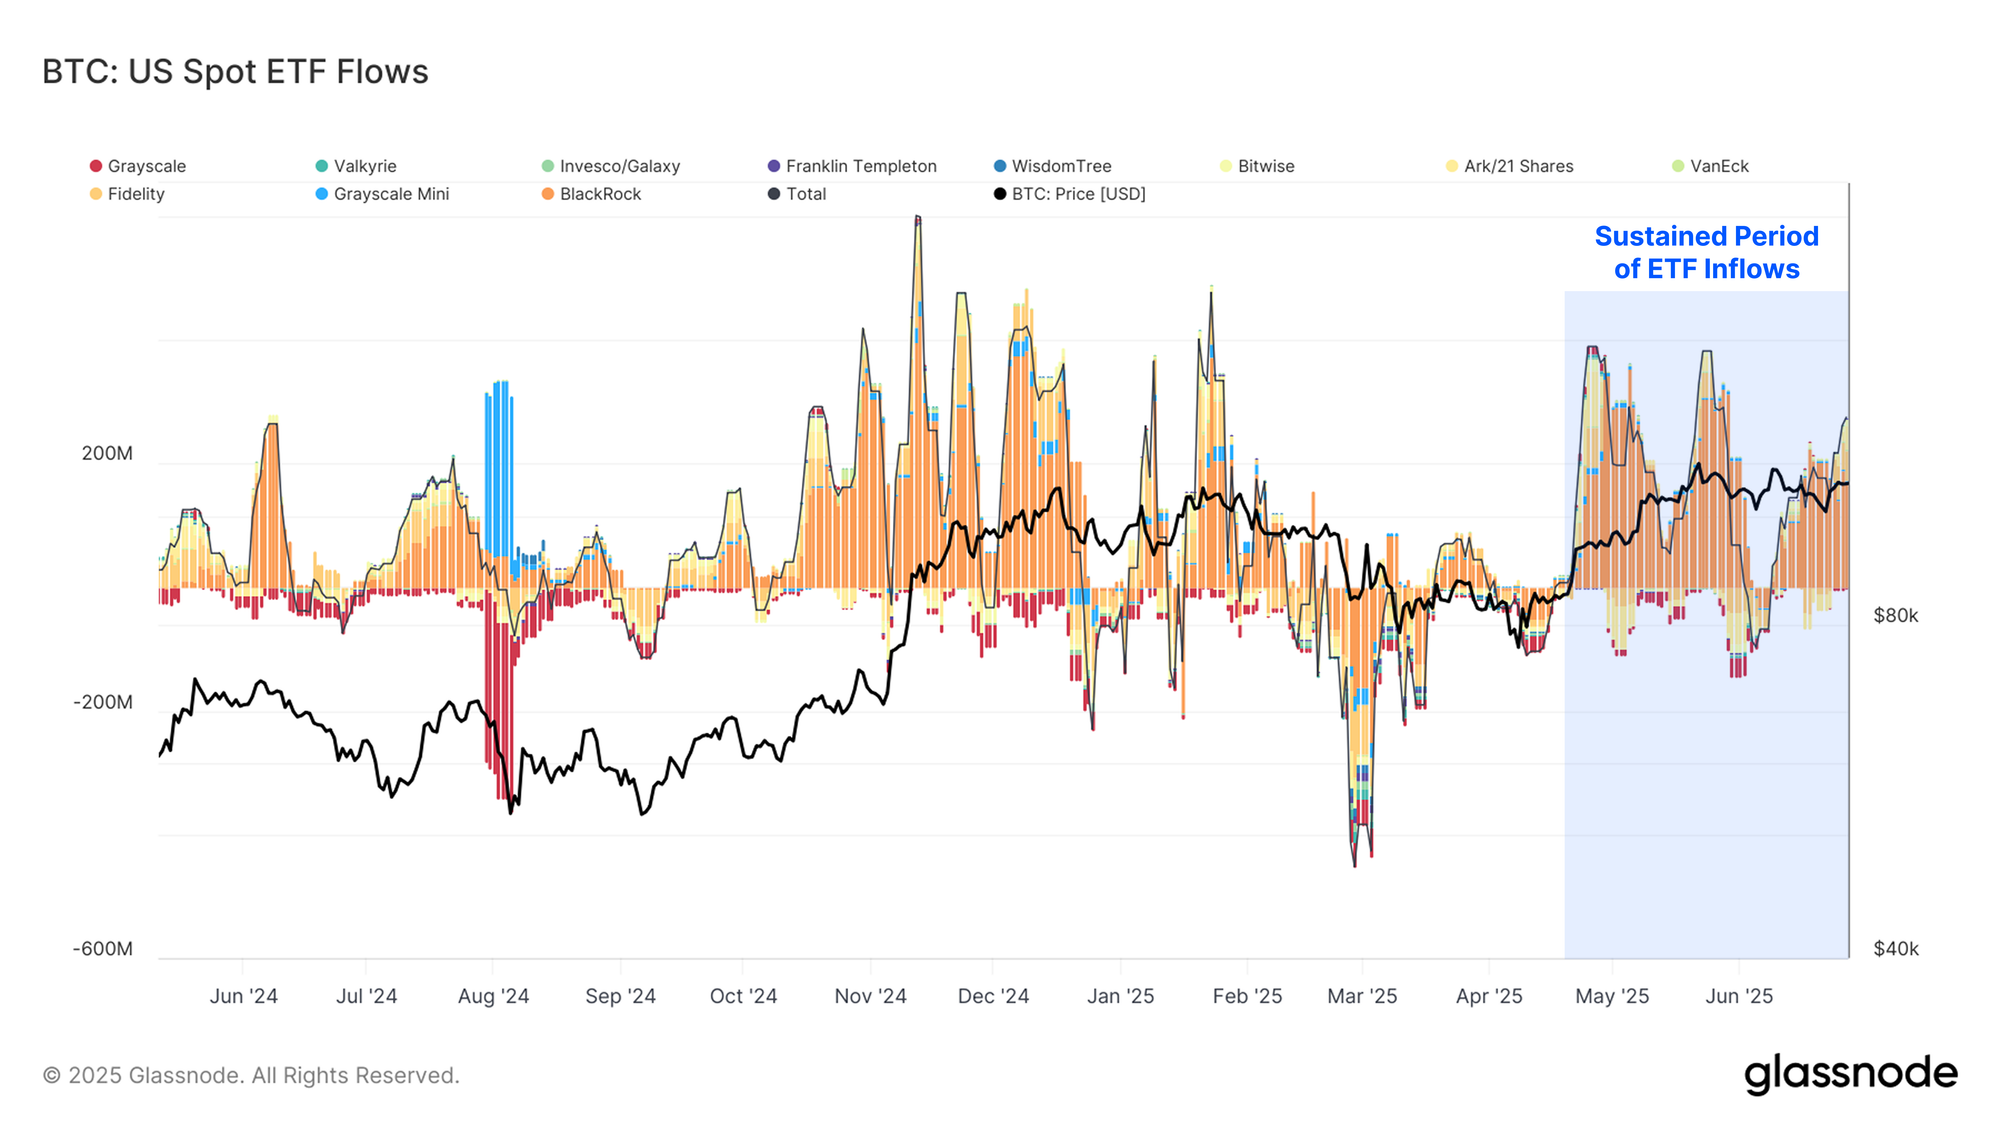
As Bitcoin’s market capitalization expands, increasingly larger capital inflows are required to meaningfully move its valuation. Therefore, the final demand vector we can assess is that coming from institutions, best reflected through net flows into the US Spot Bitcoin ETFs.
Aggregate net inflows have been accelerating in recent weeks, reaching a 7-day average peak of +$298 million. This sustained and sizeable buy-side pressure is a constructive signal, highlighting growing institutional engagement at scale.
Summary and Conclusion
After finding firm support at the Short-Term Holder cost basis of $98.3K, a level that often delineates local bull and bear regimes, Bitcoin rebounded to $107K. This move pushed the majority of investors back into profit, with total unrealized gains reaching a staggering $1.2T.
Despite this surge in profitability, investor behavior signals a strong preference for HODLing, as the current price range appears insufficient to trigger significant profit-taking. This is reflected in declining realized profits, a continued downtrend in Liveliness, and Long-Term Holder supply climbing to a new all-time high.
As price revisits the previous ATH range, we note that stablecoin purchasing power has improved meaningfully, pointing to a more robust and stable demand backdrop. Meanwhile, institutional appetite remains firm, with consistent and sizeable inflows into regulated Bitcoin products.
Disclaimer: This report does not provide any investment advice. All data is provided for informational, and educational purposes only. No investment decision shall be based on the information provided here and you are solely responsible for your own investment decisions.
Exchange balances presented are derived from Glassnode’s comprehensive database of address labels, which are amassed through both officially published exchange information and proprietary clustering algorithms. While we strive to ensure the utmost accuracy in representing exchange balances, it is important to note that these figures might not always encapsulate the entirety of an exchange’s reserves, particularly when exchanges refrain from disclosing their official addresses. We urge users to exercise caution and discretion when utilizing these metrics. Glassnode shall not be held responsible for any discrepancies or potential inaccuracies.
Please read our Transparency Notice when using exchange data.
- Join our Telegram channel.
- For on-chain metrics, dashboards, and alerts, visit Glassnode Studio.
