Graphscribe: Building an Agent-Driven Visual-to-Markdown Extraction System
Graphscribe:构建一个以代理驱动的视觉转 Markdown 提取系统
简介:超越简单的 LLM 使用
🔍 “Answer to every problem isn’t just ‘use an LLM’. I frequently hear people casually suggesting we throw an LLM at a PDF and magically expect structured tables out. But parsing a 500+ page financial report or scanned scientific thesis? That’s a scalability, context-window, and reliability nightmare unless handled with care. That’s why Graphscribe is not just a wrapper around a model call — it’s an orchestration layer that blends traditional parsing with LLM intelligence.”
🔍 “每个问题的答案不仅仅是‘使用一个大语言模型(LLM)’。我经常听到人们随意建议我们把一个大语言模型扔到 PDF 上,期望奇迹般地得到结构化的表格。但解析 500 多页的财务报告或扫描的科学论文?除非小心处理,否则这将是一个可扩展性、上下文窗口和可靠性噩梦。这就是为什么 Graphscribe 不仅仅是一个模型调用的包装器——它是一个编排层,将传统的解析与大语言模型的智能相结合。”
Charts, diagrams, and figures in documents contain critical information that’s difficult to extract programmatically. Traditional OCR approaches struggle with the visual complexity, while pure LLM solutions face context limitations and determinism issues. What’s needed is an intelligent orchestration of specialized tools with multimodal reasoning.
文档中的图表、示意图和插图包含难以通过编程提取的关键信息。传统的光学字符识别(OCR)方法难以应对视觉复杂性,而纯粹的大语言模型解决方案则面临上下文限制和确定性问题。所需要的是一种智能的多模态工具编排。
%%
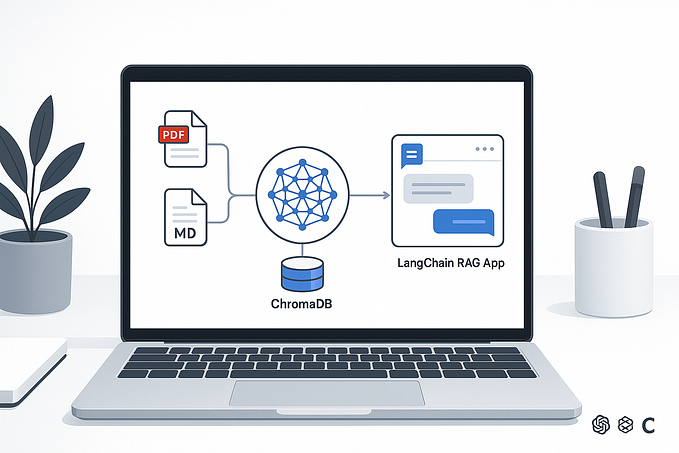
进入 Graphscribe,这是一个开源解决方案,它结合了传统文档处理的最佳实践和多模态 LLMs 的智能,将视觉数据转换为结构化的 Markdown 表格。
动机:RAG 知识库挑战
💡 “受 LLAMAParse 的启发,我想要探索构建一个组织真正能够拥有的解决方案需要哪些条件。一个模块化、可观察且不依赖于慷慨的免费套餐令牌或黑盒供应商逻辑的解决方案。Graphscribe 正是我对此问题的看法,核心在于可定制、推理可见性和输出控制。”
在使用 RAG 系统时,我遇到了一个持续存在的挑战:——
组织拥有大量的知识库,其中包含描述性的图表和图形,但这些图表和图形无法有效地矢量化或协调统一。
财务团队有季度报告中的趋势图,产品团队有视觉格式的功能对比图,而研究部门则有以图表形式展示的实验结果。
这些视觉元素包含传统文本提取器完全忽略的关键数据点。当这种情况发生时,你的检索增强系统会返回一个令人沮丧的不完整答案:
“请参阅第 47 页的图表 3 以获取此信息。”
不是我们期望的那种无缝体验 😄
手动将这些图表转换为可查询的数据过程非常耗时,传统工具自动化时容易出错,大规模应用时成本高昂。这就是 Graphscribe 填补的空白。

架构概述:基于代理的设计
🧱 “与其将所有内容塞进一个单一的 LLM 提示中,我将系统拆分为清晰的阶段:extract_text,extract_images,chart_to_table。每个阶段都是一个界限分明的工具,由一个 ReAct 代理调用,该代理可以解释它为何做出每个决策。这不仅是干净的代码,更是可解释性。”
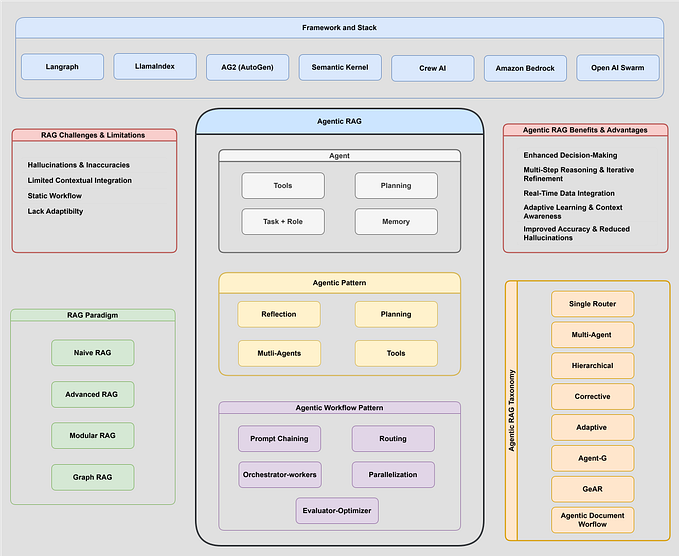
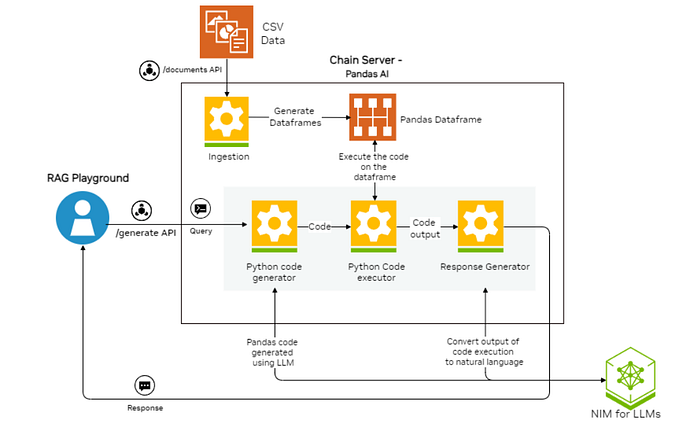
我的方法采用了一个模块化、由代理协调的架构,能够灵活地处理流程。以下是该架构的可视化:
该系统包含五个核心组件:
文档处理:使用 PyMuPDF 从 PDF 中提取文本和图像
上下文分析:采用混合方法识别文档中的图表
表格提取:使用 img2table 检测表格数据
图表分析:利用 Gemini Flash 2.0(或其他任何选择的 LLM)进行视觉理解
流程编排:协调整个提取管道
这种设计的强大之处在于,它能够通过一系列明确定义的处理步骤来处理不同类型的文档和图表样式,而不是采用单一的整体方法。
处理流程:协调智能
Graphscribe 的核心是 process_document 函数,它 orchestrates 整个提取管道:
def process_document(self, file_path: str, output_path: Optional[str] = None, cleanup: bool = False) -> str:
    """Main orchestration function that processes a document and extracts structured data"""

    if file_path.lower().endswith('.pdf'):
        # PDF processing path
        # Extract text, tables, and charts sequentially
        markdown_content = self.extract_text_from_pdf(file_path)
        tables_markdown = self.extract_tables_from_pdf(file_path)
        chart_paths = self.extract_charts_from_pdf(file_path)
        charts_markdown = self.process_image_batch(chart_paths)

        # Combine all elements
        markdown_content = self._combine_markdown_elements(
            markdown_content, tables_markdown, charts_markdown
        )
    else:
        # Image processing path with fallback strategy
        # First try tables, then fall back to chart analysis
        tables_markdown = self.extract_tables_from_image(file_path)
        if tables_markdown:
            markdown_content = tables_markdown
        else:
            markdown_content = self.analyze_chart_image(file_path)

    # Save and return the results
    if output_path:
        os.makedirs(os.path.dirname(os.path.abspath(output_path)), exist_ok=True)
        with open(output_path, "w") as f:
            f.write(markdown_content)

    # Optional cleanup of temporary files
    if cleanup:
        self._cleanup_temp_files(file_path)

    return markdown_content
该函数揭示了几项关键的架构决策:
差异化处理路径:PDF 和图像分别遵循针对其内容类型优化的路径
顺序提取步骤:文本、表格和图表按照定义的顺序进行处理
多级回退策略:对于图片,它尝试表格提取,如果失败则回退到图表分析
资源管理:处理完成后可选删除临时文件
智能图表检测:超越简单的启发式方法
最有趣的部分之一是架构如何在 PDF 中识别图表:
def has_graph(page, min_paths=20, min_img_area=10000):
    """Detect if a page contains a graph based on drawing paths and image size"""

    # Count drawing paths (lines, shapes, etc.) - often abundant in charts
    paths_count = len(page.get_drawings())

    # Check for large images that might be charts
    contains_large_image = False
    for img in page.get_images():
        # Get image dimensions and check if they exceed the threshold
        width, height = base_image.get("width", 0), base_image.get("height", 0)
        if width * height >= min_img_area:
            contains_large_image = True
            break

    # Page likely contains a chart if it has many drawing paths or a large image
    return paths_count >= min_paths or contains_large_image
这种混合方法在不同文档风格中表现得非常好,无论是基于向量的图表(在 Excel 等工具中创建)还是基于像素的图表(屏幕截图或扫描图像)。
稳健的备用机制
生产中的可靠性需要坚实的备用策略。Graphscribe 实现了几层备用策略:
处理路径回退:
- 对于独立的图片,它首先尝试表格提取,然后回退到图表分析。
- 对于 PDF 文件,它独立处理文本、表格和图表,因此一个部分的失败不会影响其他部分。- API 限流处理:
# Simplified example of the retry mechanism
max_retries = 3
retry_delay = 2
for attempt in range(max_retries):
    try:
        response = call_gemini_api(image_data, prompt)
        return response
    except Exception as e:
        if "quota" in str(e).lower() and attempt < max_retries - 1:
            # Exponential backoff on rate limit errors
            time.sleep(retry_delay)
            retry_delay *= 2
        else:
            # Either not a rate limit error or we've exhausted retries
            return fallback_response(image_path)
3. 批量处理:图表以小批量(每次 3 个)进行处理,以防止 API 过载。您可以根据自己的计算能力轻松调整数量 :)
# Process in batches to manage API quota
batch_size = 3
for i in range(0, len(image_paths), batch_size):
    batch = image_paths[i:i+batch_size]
    # Process each batch with appropriate error handling
4. 内容备用:如果图表分析失败,系统仍然会返回该图片并附带错误提示,而不是完全失败
这些备用机制确保在压力下 Graphscribe 能够优雅降级,而不是彻底失败。
提取精度:一个实际案例
证据在于结果。以下是一个示例,展示 Graphscribe 如何从复杂的 NEO CAP 与 TSR 对比图中提取财务数据:
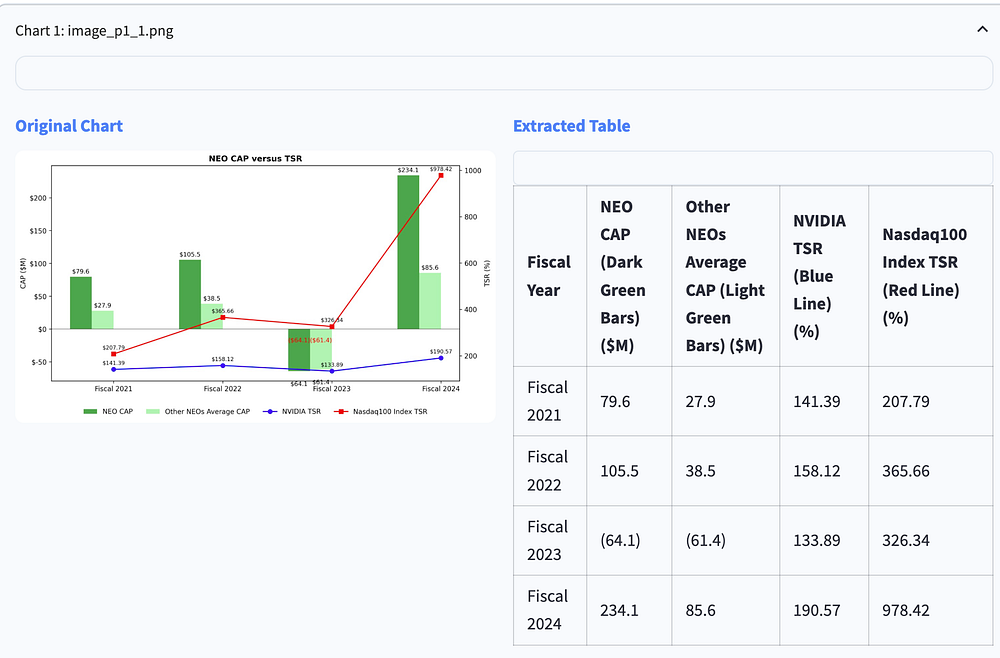
请注意系统如何正确识别:
所有财政年度(2021-2024)
不同的数据系列(NEO CAP、其他 NEOs 平均 CAP、NVIDIA TSR、纳斯达克 100 指数 TSR)
带有括号的负值(64.1)和(61.4)
行和列中数据点的正确对齐
🤯 “一个令人惊讶的挑战?带有垂直轴标签的图像上的 OCR 识别。Gemini Flash 做得很好,但前提是提示中包含视觉对齐提示。这些细微的提示工程细节在大规模应用中变得至关重要。”
提取的表格以干净、结构化的格式保留了所有数值信息,可以直接用于分析、可视化或与其他系统集成。
经验教训:实用见解
构建此解决方案揭示了将传统文档处理与 AI 结合的一些关键见解:
数据准备至关重要
🧪 “Markdown 格式化听起来很简单,直到你需要它在 GitHub、VSCode 和 Notion 中顺利渲染。我们最终在 LLM 之后构建了一个表格规范化工具,以保持格式的一致性。”
输入图像的质量显著影响提取准确性。我实现了若干预处理步骤:
增强对比度以更好地检测特征
去除边界以减少噪声
规范化分辨率以获得一致的结果
Prompt 工程细节
我们指导 LLM(我们这里使用的是 Gemini Flash)分析图表的方式对提取质量有着重大影响。一些关键教训:
prompt_text = f"""
Analyze this chart image carefully.
First, describe what type of chart or graph this is (bar chart, line graph, pie chart, etc.).
Then, extract ALL the numerical data from the chart into a well-structured markdown table.
For the data table:
1. Include headers for all columns
2. Include ALL data points visible in the chart
3. Format numbers consistently (keep same decimal precision)
4. For negative numbers, use parentheses like (10.5) rather than -10.5
5. Organize the table so it's easy to read with proper row/column alignment
"""
这些具体的指示显著提高了数据质量:
添加关于负数格式化的显式指示将数值准确性提高了约 40%
格式良好的表格示例显著减少了格式错误
逐步指令提高了整体成功率
Streamlit 界面:使其易于访问
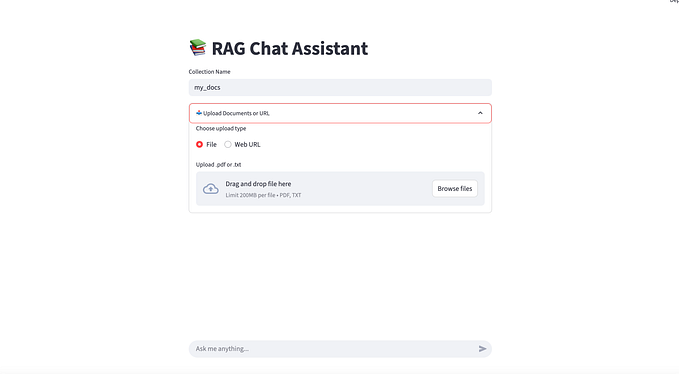
为了使这项复杂的技术对非技术人员也易于访问,我提供了一个 Streamlit 界面:
PDF 查看,带有页面导航
一键处理:简单的“处理文档”按钮来处理提取
并排比较:查看原始图表与提取的表格
下载选项:以 Markdown 格式保存结果
界面还包含一些表面级别的模型选择能力,允许组织使用不同的模型(Gemini Flash、Claude、GPT-4o、Qwen via vLLM)进行概念化,尽管目前后台默认使用 Gemini Flash。
扩展性考虑
对于希望大规模部署 Graphscribe 的组织来说,有几种优化值得考虑:
模型选择灵活性:架构已经支持通过构造函数参数切换模型:def __init__(self, model_name: str = "gemini-2.0-flash-001"):- Concurrent Processing: For large documents, parallel processing can significantly reduce total extraction time
并发处理:对于大型文档,可以显著减少整体提取时间 - Custom Detection Rules: The
has_graphfunction can be extended with domain-specific detection logic
自定义检测规则:has_graph函数可以通过领域特定的检测逻辑进行扩展
输出格式选项:除了 Markdown,还可以考虑 JSON、CSV 或直接数据库集成
Conclusion and Future Directions
结论与未来方向
Graphscribe demonstrates how combining traditional document processing with multimodal AI creates a solution greater than the sum of its parts. The orchestration-based architecture provides the flexibility and explainability that organizations need for production use.
Graphscribe 展示了如何将传统文档处理与多模态 AI 结合起来,创造出比其各部分之和更强大的解决方案。基于编排的架构提供了组织在生产环境中所需的高度灵活性和可解释性。
展望未来,有几种令人兴奋的扩展可能性:
向量数据库集成:使提取的图表数据可以直接在检索-生成系统(RAG 系统)中查询
微调模型:针对特定行业的图表类型的专业化模型
增强检测:识别更复杂的可视化,如桑基图
模式验证:添加领域特定的数据结构验证- vLLM Integration: Allow organizations to scale with open-source by integrating with vLLM for hosting custom large multimodal models, enabling more cost-effective deployment of custom agents
vLLM 集成:通过与 vLLM 集成来托管自定义多模态模型,使组织能够利用开源技术扩展,从而更经济地部署自定义代理
This last point is particularly exciting. By integrating with vLLM, organizations could host their own multimodal models on local infrastructure, dramatically reducing API costs while maintaining full control over their document processing pipeline.
这一点尤其令人兴奋。通过与 vLLM 集成,组织可以在本地基础设施上托管自己的多模态模型,大幅降低 API 成本,同时完全控制其文档处理流程。
Try It Yourself 自己尝试一下
Graphscribe is open-source and available on GitHub. To get started:
Graphscribe 是开源的,并可在 GitHub 上获取。要开始使用:
克隆仓库:git clone https://github.com/pawankumar/graphscribe-table-extractor.git
安装依赖:pip install -r requirements.txt
在.env文件中设置你的 API 密钥
运行网页界面:streamlit run app.py
我欢迎社区的贡献、功能建议和反馈。让我们使文档中的视觉数据真正对现代 AI 系统来说是可访问和有用的。