这是用户在 2025-7-25 15:57 为 https://www.mdpi.com/2072-6651/4/10/849 保存的双语快照页面,由 沉浸式翻译 提供双语支持。了解如何保存?
 
 
Article  开放获取文章

Do Only Small Uremic Toxins, Chromophores, Contribute to the Online Dialysis Dose Monitoring by UV Absorbance?
只有小分子尿毒症毒素、色原才参与通过紫外吸收进行的在线透析剂量监测吗?

by 1,*,   Jürgen Arund 1,2, 1,3 and    1,2 ,弗雷德里克·乌林 1   1,3 和伊沃·弗迪奥林
1
Department of Biomedical Engineering, Technomedicum, Tallinn University of Technology, Ehitajate tee 5, 19086 Tallinn, Estonia
生物医学工程系,塔林技术大学,伊蒂贾特·泰 5 号,爱沙尼亚,19086
2
Laboratory of Chemical Physics, National Institute of Chemical Physics and Biophysics, Akadeemia tee 23, 12618 Tallinn, Estonia
化学物理实验室,国家化学物理与生物物理研究所,阿卡德米亚泰 23 号,爱沙尼亚,12618
3
Department of Nephrology UHL, County Council of Östergötland, Department of Medical Health Sciences, Faculty of Health Sciences, Linköping University, Linköping, Sweden
瑞典 Östergötland 县议会乌普萨拉医院肾内科,林雪平大学医学院医疗健康科学系,林雪平大学健康科学学院,瑞典林雪平
*
Author to whom correspondence should be addressed.
作者的 Correspondence 应该发送至
Toxins 2012, 4(10), 849-861; https://doi.org/10.3390/toxins4100849
毒素 2012, 4(10), 849-861; https://doi.org/10.3390/toxins4100849
Submission received: 30 June 2012 / Revised: 25 September 2012 / Accepted: 27 September 2012 / Published: 18 October 2012
提交日期:2012 年 6 月 30 日 / 修改日期:2012 年 9 月 25 日 / 接受日期:2012 年 9 月 27 日 / 发表日期:2012 年 10 月 18 日
(This article belongs to the Special Issue Uremic Toxins)
(本文属于特刊 肾毒物)

Abstract  摘要

The aim of this work was to evaluate the contributions of the main chromophores to the total UV absorbance of the spent dialysate and to assess removal dynamics of these solutes during optical on-line dialysis dose monitoring. High performance chromatography was used to separate and quantify UV-absorbing solutes in the spent dialysate sampled at the start and at the end of dialysis sessions. Chromatograms were monitored at 210, 254 and 280 nm routinely and full absorption spectra were registered between 200 and 400 nm. Nearly 95% of UV absorbance originates from solutes with high removal ratio, such as uric acid. The contributions of different solute groups vary at different wavelengths and there are dynamical changes in contributions during the single dialysis session. However, large standard deviation of the average contribution values within a series of sessions indicates remarkable differences between individual treatments. A noteworthy contribution of Paracetamol and its metabolites to the total UV absorbance was determined at all three wavelengths. Contribution of slowly dialyzed uremic solutes, such as indoxyl sulfate, was negligible.
本研究旨在评估主要色素对透析后废液总紫外吸收的贡献,并评估这些溶质在光学在线透析剂量监测过程中的去除动态。使用高效液相色谱法分离并定量透析后废液中在透析开始和结束时采集的紫外吸收溶质。在 210、254 和 280 nm 处常规监测色谱图,并在 200 至 400 nm 之间记录完整的吸收光谱。近 95%的紫外吸收来自高去除比的溶质,如尿酸。不同溶质组的贡献在不同波长下有所不同,并且在单次透析会话中存在动态变化。然而,一系列会话中平均贡献值的标准偏差表明个体治疗之间存在显著差异。在所有三个波长下,对总紫外吸收有显著贡献的是对乙酰氨基酚及其代谢物。缓慢透析的尿毒症溶质,如吲哚酚硫酸盐,的贡献可以忽略不计。
Keywords:
uremic toxins; hemodialysis; chromophores; retention solutes; absorption; ultraviolet-radiation; liquid-chromatography; dialysis dose; monitoring; spent dialysate
关键词:尿毒症毒素;血液透析;色基;保留溶质;吸收;紫外线辐射;液相色谱;透析剂量;监测;用过的透析液

1. Introduction  1. 引言

The search for an easy and robust method for online tracking of a prescribed dialysis dose when dialysis is used as a treatment for patients with kidney failure is a long-term pursuit. Blood samples have been the main source of information concerning the efficiency of dialysis treatment during the history of search for a suitable parameter for dialysis dose description. The Kt/V value based on urea analyses in blood samples has been commonly accepted for the description of a delivered dialysis dose today. However, the method is error-prone in practice [1] and time-consuming, considering the time needed from blood draw until achieving the results. Urea itself does not exhibit toxic properties in concentrations found in the dialysis patients [2], and is not representative for removal of many uremic toxins regarded as groups of protein bound and middle molecules [3].
在寻找一种易于实施且可靠的在线监测透析剂量的方法时,尤其是在使用透析治疗肾功能衰竭患者的过程中,这是一个长期的目标。血液样本一直是寻找适合描述透析剂量参数的历史上主要的信息来源。目前,基于血液样本中尿素分析的 Kt/V 值被普遍接受用于描述所交付的透析剂量。然而,该方法在实践中容易出错[1],并且耗时,因为从采血到获得结果需要一定的时间。尿素在透析患者体内的浓度下并不具有毒性[2],也不能代表许多尿毒症毒素的去除,这些毒素被认为是蛋白质结合物和中分子的群体[3]。
A principle for a non-invasive dialysis adequacy monitoring method was proposed by Gal et al. [4] proposing measuring UV absorbance in the spent dialysate at 254 nm. This method was not widely adopted at the time. A decade later, the principle of conductivity based dialysis monitoring was introduced utilizing the conductivity signal to assess the dialysis dose parameter Kt/V [5,6]. However, the precision of conductivity based Kt/V assessment appeared to be dependent on accurate estimation of total body water [7] and, therefore, not an ideal method for routine use. Also, online urea content monitoring in the spent dialysate has been used (Biostat 1000 Urea Monitor [8,9], Biotrack [10]). The equipment, which is rather cumbersome to handle and involves significant running costs, has not found wider acceptance. The observed relation between the online UV absorbance signal and the parameter Kt/V however, led a step closer to a robust, cheap and reliable way of dialysis monitoring [11]. Use of light emitting diodes made it possible to miniaturize the sensor and minimize the cost of the monitor, without any need for consumables [12].
非侵入性透析充分性监测方法的原则由 Gal 等人[4]提出,建议通过测量 254 nm 波长的透析后废液的紫外吸收光谱来实现。该方法当时并未广泛采用。十年后,基于电导率的透析监测原则被引入,利用电导率信号评估透析剂量参数 Kt/V[5, 6]。然而,基于电导率的 Kt/V 评估精度似乎依赖于准确估计总体水分[7],因此不是一个理想的常规使用方法。此外,透析后废液中的尿素含量在线监测也已被使用(如 Biostat 1000 尿素监测仪[8, 9],Biotrack[10])。这些设备操作复杂且运行成本高,未能获得更广泛的应用。然而,观察到的在线紫外吸收光谱信号与 Kt/V 参数之间的关系,使我们更接近于一种稳健、经济且可靠的透析监测方式[11]。使用发光二极管使得传感器可以小型化,降低了监测仪的成本,无需消耗品[12]。
Earlier studies have shown that UV absorptions at 280, 285 and 297 nm have a close correlation with urea-based dialysis dose estimation [11,13,14]. This made it possible to develop a clinically validated online dialysis adequacy monitoring system [15]. The system measures UV-absorption versus time in the spent dialysate at 280 nm and calculates Kt/V.
早期的研究表明,280、285 和 297 纳米波长的 UV 吸收与基于尿素的透析剂量估算密切相关[11, 13, 14]。这使得开发出一个临床验证的在线透析充分性监测系统成为可能[15]。该系统测量 280 纳米波长的透析后废液的 UV 吸收随时间的变化,并计算 Kt/V。
Because the UV method detects a range of solutes, it is sensitive to changes in chromophores’ content and the appearance ratio of different UV-absorbing molecules in the spent dialysate. Removal dynamics of different chromophores and contributions to the total UV absorbance are still unknown [16].
由于 UV 方法检测的是多种溶质,因此它对废液中色素含量及其不同 UV 吸收分子的比例变化非常敏感。不同色素的去除动力学及其对总 UV 吸收的贡献仍然未知[16]。
The aim of this study was to evaluate the contributions of the main chromophores to the total UV absorbance in the spent dialysate and removal dynamics during optical online dialysis dose monitoring.
本研究的目的是评估主要色素在废液中总 UV 吸收中的贡献以及在线光学透析剂量监测过程中的去除动力学。

2. Results  2. 结果

Thirty clearly resolved peaks of UV absorbing compounds were detected during the HPLC analysis. Seventeen of all peaks had major importance in some samples or prevalent importance in all samples (Figure 1), from these, 10 were identified on the basis of comparisons of the MS-spectra, UV-spectra and the retention time with the corresponding reference substances (Table 1). Identified peaks were grouped considering the widely accepted classification of uremic retention solutes [17]. An additional three peaks (7, 11 and 12, Figure 1), identified as Paracetamol (PAR; N-Acetyl-p-Aminophenol) and metabolites PAR glucuronide and PAR sulfate, were found from the samples of 33 dialysis sessions out of 48 (including both HD and HDF sessions).
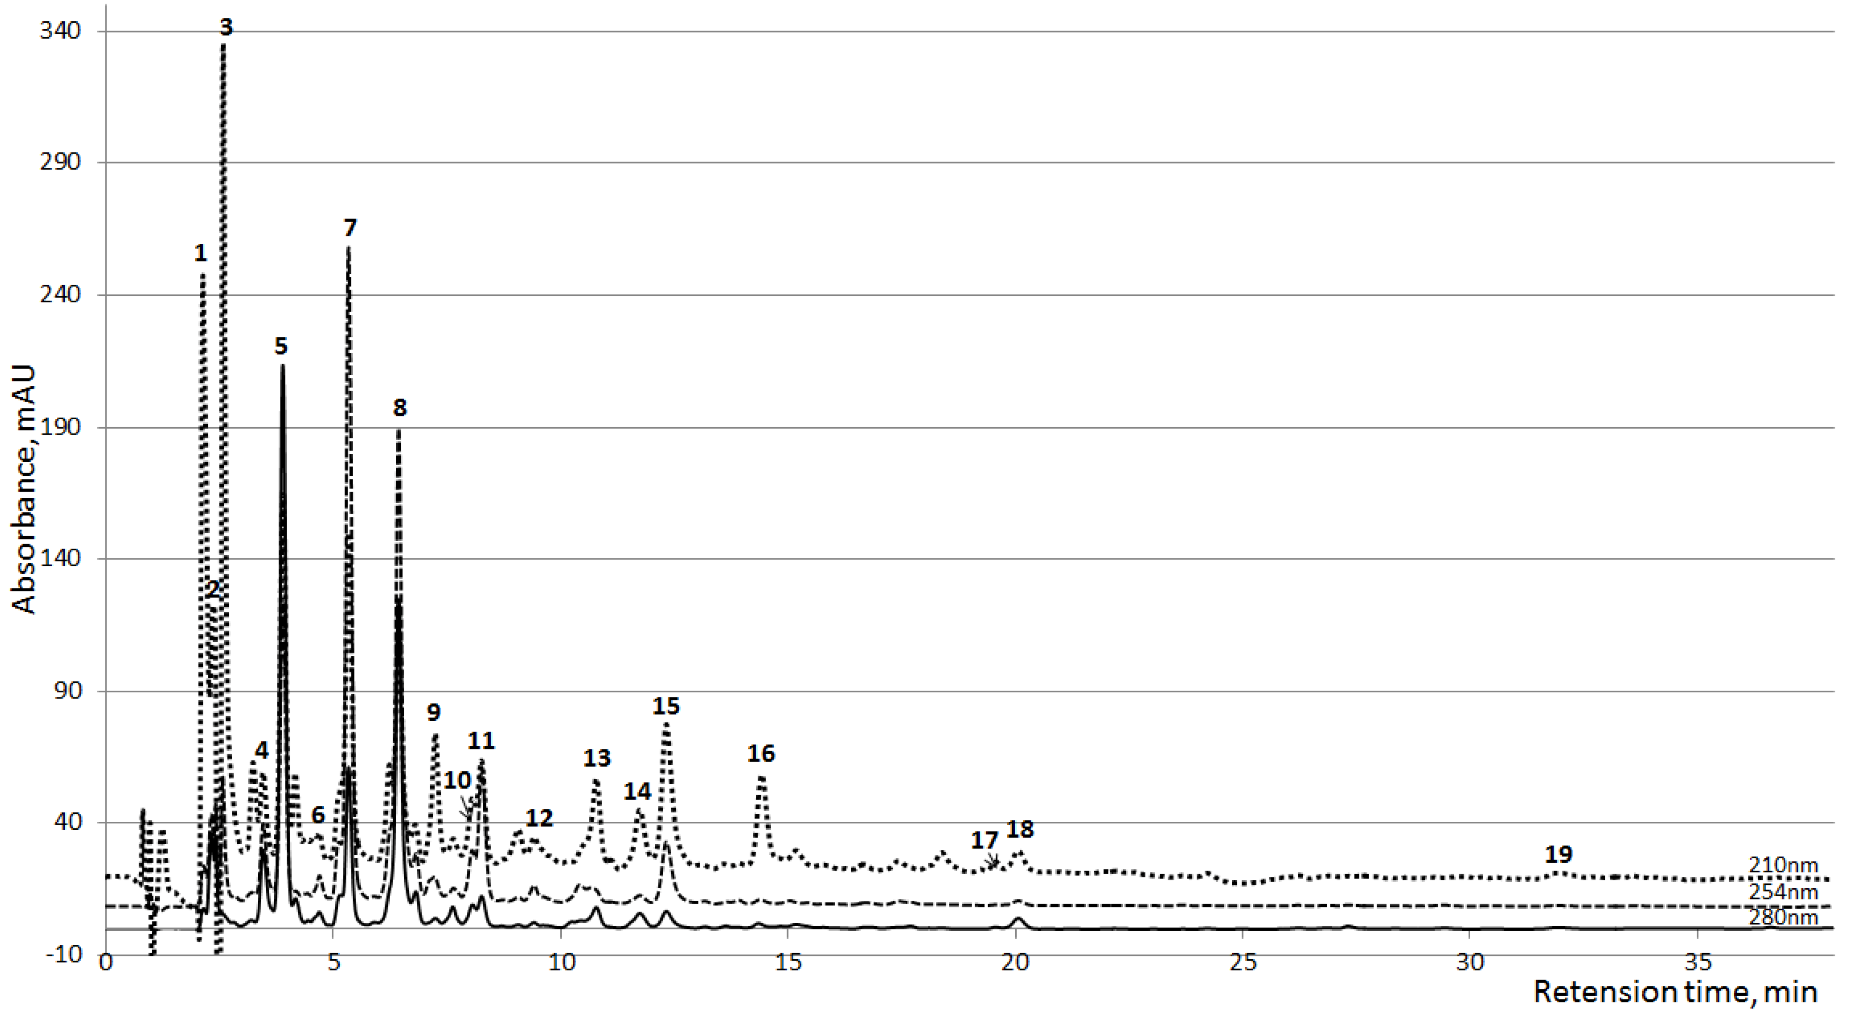
在 HPLC 分析过程中检测到了三十个清晰分辨的 UV 吸收化合物峰。其中十七个峰在某些样本中有重要性,或者在所有样本中普遍存在(图 1)。在这十七个峰中,有十个峰基于 MS 光谱、UV 光谱和保留时间与相应参考物质的比较而被识别(表 1)。识别出的峰被根据广泛接受的尿毒症残留溶质分类法进行了分组。另外三个峰(7、11 和 12,图 1),分别被识别为对乙酰氨基酚(PAR;N-乙酰-p-氨基酚)、PAR 葡萄糖醛酸和 PAR 硫酸盐,这些峰在 48 个透析会话样本中的 33 个样本中被发现(包括血液透析和高通量血液透析会话)。
Figure 1. Averaged HPLC chromatograms of the spent dialysate collected 10 min after the start of the dialysis (n=24) at three wavelengths. 1,2: Unknown; 3: Creatinine; 4: Unknown; 5: Uric acid; 6: Hypoxanthine; 7: PAR Glucoronide; 8–10: Unknown; 11: PAR Sulfate; 12: Paracetamol (PAR); 13: Tryptophan; 14: Indoxyl Sulfate; 15: Hippuric acid; 16–18: Unknown; 19: Indole-3-acetic acid.
图 1. 在透析开始后 10 分钟收集的透析液平均 HPLC 色谱图(n=24),在三个波长下显示。1,2:未知;3:肌酐;4:未知;5:尿酸;6:黄嘌呤;7:PAR 葡萄糖醛酸;8-10:未知;11:PAR 硫酸盐;12:对乙酰氨基酚(PAR);13:色氨酸;14:吲哚酚硫酸盐;15:马尿酸;16-18:未知;19:吲哚-3-乙酸。
Figure 1. Averaged HPLC chromatograms of the spent dialysate collected 10 min after the start of the dialysis (n=24) at three wavelengths. 1,2: Unknown; 3: Creatinine; 4: Unknown; 5: Uric acid; 6: Hypoxanthine; 7: PAR Glucoronide; 8–10: Unknown; 11: PAR Sulfate; 12: Paracetamol (PAR); 13: Tryptophan; 14: Indoxyl Sulfate; 15: Hippuric acid; 16–18: Unknown; 19: Indole-3-acetic acid.
Toxins 04 00849 g001
Also, five prevalent but unidentified chromatographic peaks were grouped together (Table 1). The group of “All Other Solutes” (AOS) consists of the peaks that had no prevalent signal in the chromatograms or were not clearly identified as separate peaks. This group involves an unknown number of solutes, which separately had very low UV signal, but summed together had noticeable importance in total UV absorbance.
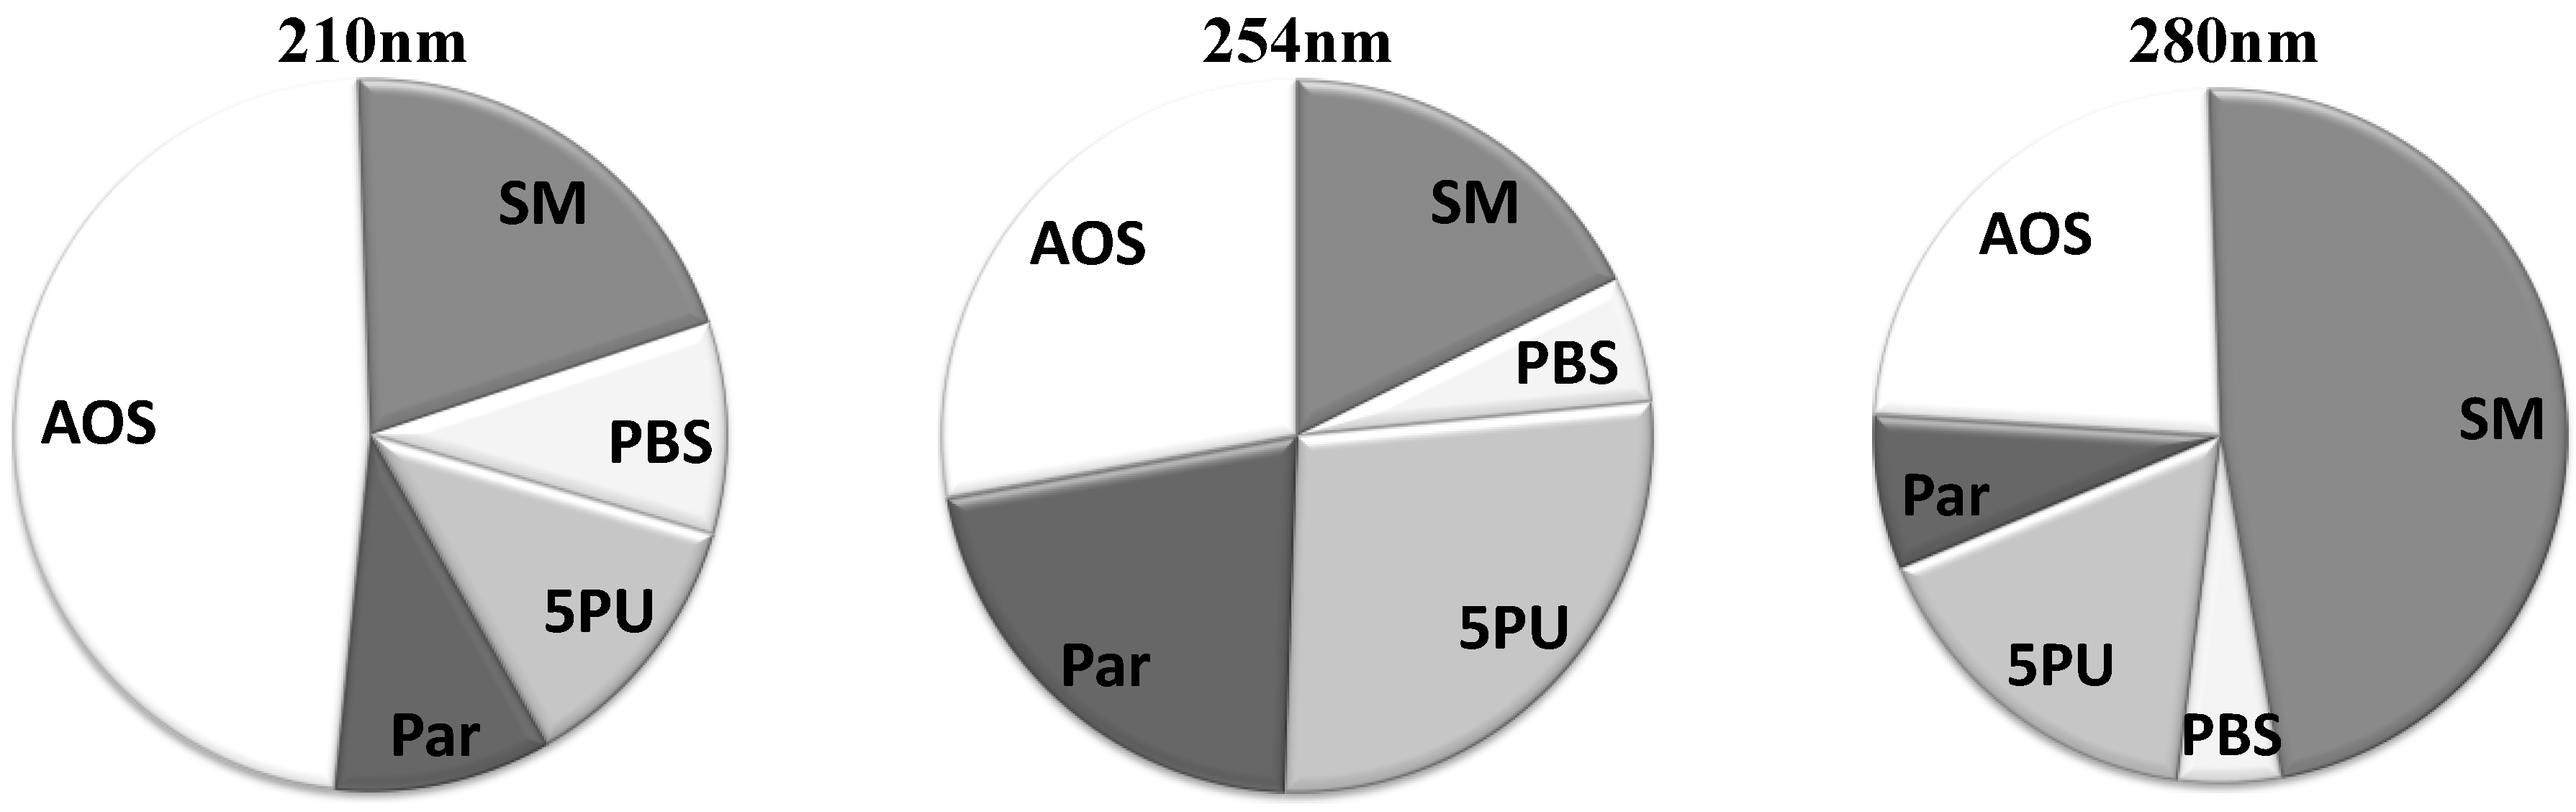
此外,在表 1 中,五个常见的但未识别的色谱峰被归为一组。名为“所有其他溶质”(AOS)的组包括在色谱图中没有明显信号或未被明确识别为单独峰的峰。该组涉及未知数量的溶质,这些溶质单独时具有非常低的紫外光信号,但汇总在一起时在总紫外光吸收中具有显著的重要性。
The average relative contributions for all five solute groups at three different wavelengths are illustrated in Figure 2. The group of “Small Molecules” has prevalent contribution at 280 nm. However, at lower wavelengths this group loses dominance in the UV absorbance signal. At 254 nm the group of “5 Prevalent Unidentified Peaks (5PU)” has a significant role in the UV signal, but less significant at 210 and 280 nm. The UV absorbance signal is most complex at 210 nm, where nearly half of the signal consists of many solutes with low and very low UV absorbance at higher wavelengths.
图 2 展示了三个不同波长下所有五个溶质组的平均相对贡献。在 280 nm 波长下,“小分子”组有明显的贡献。然而,在较低波长下,该组在紫外光吸收信号中的主导地位丧失。在 254 nm 波长下,“5 个常见未识别峰(5PU)”组在紫外光信号中起着显著的作用,但在 210 nm 和 280 nm 波长下作用较小。在 210 nm 波长下,紫外光吸收信号最为复杂,其中近一半的信号由许多在较高波长下具有低紫外光吸收和极低紫外光吸收的溶质组成。
Figure 3 illustrates the relationship between online UV absorbance of spent dialysate monitored during dialysis session (I), HPLC signal (II), and the relative contribution of the HPLC peaks to the total UV absorbance (III), all signals acquired at 280 nm for a single dialysis treatment. The slope of online UV absorbance signal from the spent dialysate against time enables one to estimate the value of Kt/V (Figure 3I). Method for acquiring the online UV absorbance signal is described in detail elsewhere [18]. Self-tests of the dialysis machine occur as spikes in the signal. Difference in the height of the peaks on the Start and End chromatograms (Figure 3II) demonstrates a concentration decrease in uremic solutes during the dialysis.
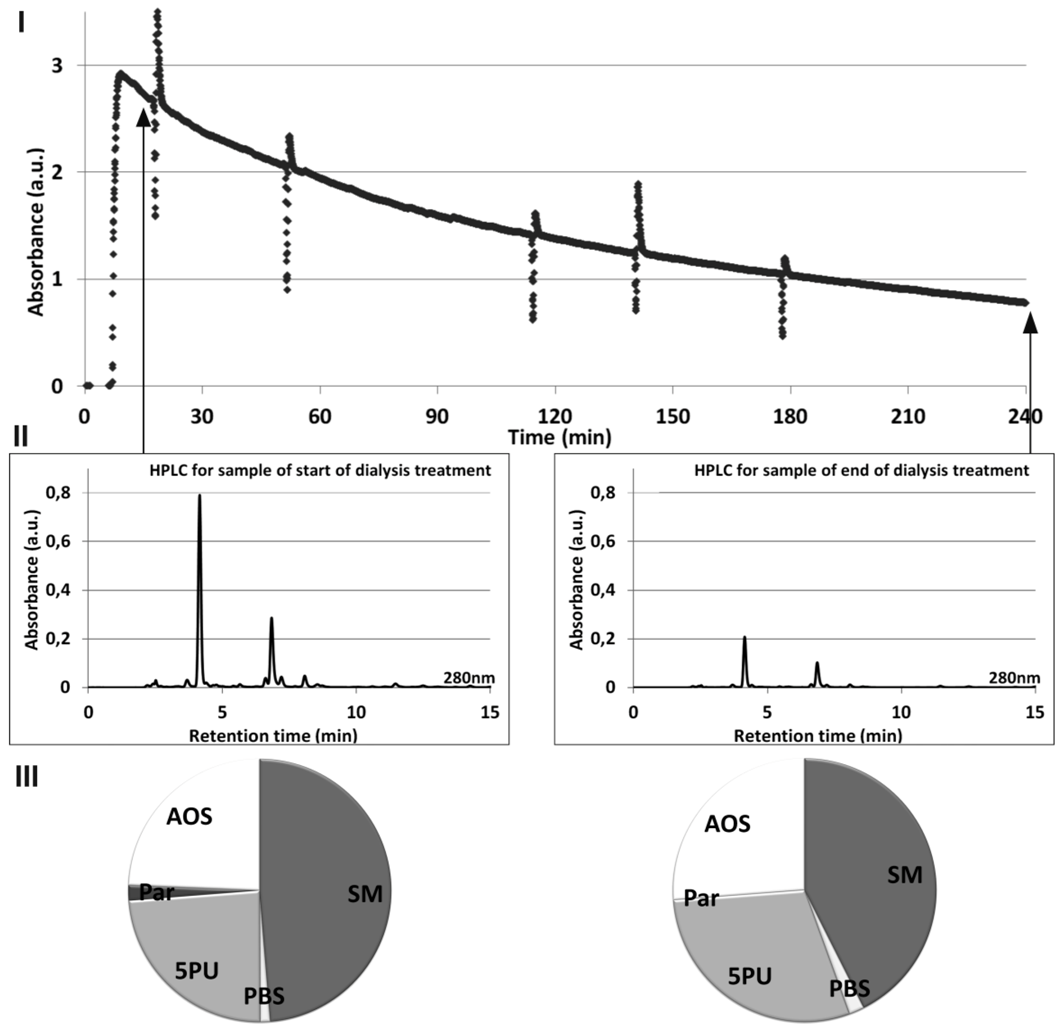
图 3 展示了透析液在线紫外吸收值()、HPLC 信号(II)以及 HPLC 峰对总紫外吸收值的相对贡献(III)之间的关系,所有信号均在透析治疗过程中于 280 nm 处获取。透析液在线紫外吸收值信号随时间的变化斜率可以用来估算 Kt/V 值(图 3I)。在线紫外吸收值信号的获取方法已在其他地方详细描述过[18]。透析机的自我测试会在信号中表现为尖峰。起始和结束色谱图上峰的高度差异(图 3II)表明透析过程中尿毒症溶质浓度的降低。
Table 1. Grouping of solutes.
表 1. 溶质分组。
Table 1. Grouping of solutes.
GroupingCompoundPeak nrRT, minMWClass
Small Molecules (SM)Creatinine (Cr) *32.5113Guanidines
Uric acid (UA) *54.0168Purines
Hypoxanthine *64.4136Purines
Protein-Bound Solutes (PBS)Tryptophan (Trp)1311.4204Indoles
Indoxyl Sulfate (IS) *1412.4251Indoles
Hippuric acid (HA) *1513.0179Hippurates
Indole-3-acetic acid (I3AA) *1931.8175Indoles
5 Prevalent Unidentified Peaks (5PU)Unknown12.4
Unknown43.6
Unknown86.8
Unknown108.4
Unknown1820.7
Paracetamol and its metabolites (Par)Paracetamol Glucoronide75.5327Glucuronides
Paracetamol Sulfate118.7231
Paracetamol (PAR)1211.1151Acetanilides
All Other Solutes (AOS)Unknown22.3
Unknown97.2
Unknown1614.4
Unknown1719.5
* Note: Grouping according to EUTox (European Uremic Toxin Work Group) classification [17]; RT: chromatographic retention time (minutes), MW: molecular weight (g/mol).
Figure 2. Average contribution of groups of chromatographic peaks to the total UV absorbance in the spent dialysate, including start, end and tank collection samples.SM: Small molecules; PBS: Protein-Bound Solutes; 5PU: 5 Prevalent Unidentified Peaks; Par: Paracetamol and its metabolites; AOS: All other Solutes.
图 2. 透析液中色谱峰组对总紫外吸收值的平均贡献,包括起始、结束和罐收集样本。SM:小分子;PBS:蛋白结合溶质;5PU:5 种常见未识别峰;Par:对乙酰氨基酚及其代谢物;AOS:其他溶质。
Figure 2. Average contribution of groups of chromatographic peaks to the total UV absorbance in the spent dialysate, including start, end and tank collection samples.SM: Small molecules; PBS: Protein-Bound Solutes; 5PU: 5 Prevalent Unidentified Peaks; Par: Paracetamol and its metabolites; AOS: All other Solutes.
Toxins 04 00849 g002
Figure 3. Relationship between online UV absorbance (I), HPLC signal (II) and the relative contribution of the HPLC peaks to the total UV absorbance at 280 nm (III) for a start and end of dialysate samples from a single dialysis treatment.
图 3. 来自单次透析治疗开始和结束的透析液样本的在线 UV 吸光度()、HPLC 信号(II)以及 HPLC 峰对总 UV 吸光度(280 nm)的相对贡献(III)之间的关系。
Figure 3. Relationship between online UV absorbance (I), HPLC signal (II) and the relative contribution of the HPLC peaks to the total UV absorbance at 280 nm (III) for a start and end of dialysate samples from a single dialysis treatment.
Toxins 04 00849 g003
The average relative contributions for all treatments to the total UV absorbance (Mean ± SD) in percentage for each peak and each solute group are given in Table 2 for start and end samples at three wavelengths. Characteristic dynamics of the contributions from the solutes and solute groups to the total UV absorbance can be distinguished by comparing the data from the start and the end of the dialysis session. Two peaks, identified as Hypoxanthine and I3AA, had very low UV signal value in the chromatograms, and were included into the group of AOS.
表 2 给出了在三个波长下,每个峰和每组溶质在起始样本和结束样本中对总 UV 吸光度的平均相对贡献(均值±标准差)百分比。通过比较透析会话开始和结束的数据,可以区分溶质和溶质组对总 UV 吸光度贡献的特征动态。两个峰,分别被识别为次黄嘌呤和 I3AA,在色谱图中的 UV 信号值很低,被归入 AOS 组。
As seen from Table 2, the small molecule, Uric Acid (UA) is the main UV absorbing solute in the spent dialysate at 280 nm. During the dialysis, the importance of UA in the UV signal decreases significantly (p < 0.05). The decrease of UA contribution is concurrent to the increased contributions from other solute groups, being significant for groups “Protein-Bound Solutes” (PBS) and AOS (p < 0.05). As UA is a very important UV absorber in the spent dialysate, the high standard deviation value of UA contribution should be stressed. This indicates high variations between different patients and dialysis sessions (min RCUA = 29%; max RCUA = 75%, RC: relative contribution).
如表 2 所示,在 280 nm 处,小分子尿酸(UA)是废弃透析液中的主要紫外吸收溶质。在透析过程中,UA 在紫外信号中的重要性显著降低(p < 0.05)。UA 贡献的减少与来自其他溶质组别的贡献增加同步,这些组别包括“蛋白质结合溶质”(PBS)和 AOS(p < 0.05)。由于 UA 是废弃透析液中非常重要的紫外吸收剂,UA 贡献的标准差值较高应引起重视。这表明不同患者和透析会次之间存在高度变异(最小相对贡献率 UA = 29%;最大相对贡献率 UA = 75%,RC:相对贡献率)。
Solute contributions at 254 nm have the highest SD value. The main contribution comes from the group of 5 PU, where the peak Unknown 8 has the highest contribution to the UV signal.
在 254 nm 处,溶质贡献的标准差值最高。主要贡献来自 5 PU 组,其中未知物 8 对 UV 信号的贡献最高。
At 210 nm, two solutes (UA and Creatinine) in the “Small Molecules” group are of major importance in the UV signal. Their contributions changed during the dialysis considerably (p < 0.05). Changes in the contribution inside the group of PBS were significant. However, no substantial difference in the contribution occurred for the start and end samples for the whole PBS group.
在 210 nm 处,“小分子”组中的两种溶质(尿酸和肌酐)对 UV 信号至关重要。它们的贡献在透析过程中显著变化(p < 0.05)。PBS 组内贡献的变化也具有统计学意义。然而,整个 PBS 组的起始样本和终末样本在贡献上没有显著差异。
Table 2. Average contributions in percent for each peak and molecule group with a statistical comparison of the start and end samples of the spent dialysate at three wavelengths *).
表 2. 在三个波长下,每个峰和分子组的平均贡献百分比,以及终末透析液起始样本和终末样本的统计学比较 *)。
Table 2. Average contributions in percent for each peak and molecule group with a statistical comparison of the start and end samples of the spent dialysate at three wavelengths *).
210 nm254 nm280 nm
StartEndStartEndStartEnd
Small molecules24.81 ± 8.02*16.36 ± 4.8818.63 ± 8.8616.94 ± 7.4450.07 ± 10.54 *44.88 ± 9.73
Uric acid10.30 ± 3.67*6.80 ± 2.2114.83 ± 7.5112.98 ± 6.0450.07 ± 10.54 *44.88 ± 9.73
Creatinine14.51 ± 5.37*9.56 ± 4.773.80 ± 1.693.96 ± 1.620.000.00
Protein-Bound Solutes9.75 ± 3.36 *9.32 ± 2.616.04 ± 3.175.42 ± 2.723.82 ± 0.97 *5.87 ± 1.59
Indoxyl Sulfate1.89 ± 0.79*2.57 ± 1.040.44 ± 0.380.33 ± 0.461.42 ± 0.50 *2.44 ± 1.13
Tryptophan1.68 ± 0.59 *2.71 ± 0.730.51 ± 0.260.52 ± 0.641.21 ± 0.29 *2.41 ± 0.69
Hippuric acid6.18 ± 3.27 *4.04 ± 2.185.09 ± 2.874.57 ± 2.761.19 ± 0.621.02 ± 0.58
5 Prevalent Unidentified peaks12.72 ± 4.4111.55 ± 3.7326.88 ± 13.5027.68 ± 12.5215.80 ± 6.0117.75 ± 5.18
Unknown10.000.000.000.000.93 ± 1.710.79 ± 1.32
Unknown42.55 ± 0.76 *2.26 ± 0.834.21 ± 1.804.49 ± 1.812.86 ± 0.53 *3.11 ± 0.48
Unknown86.49 ± 4.195.66 ± 3.3518.76 ± 13.6119.79 ± 13.159.16 ± 6.4010.03 ± 5.86
Unknown102.86 ± 1.14 *2.10 ± 0.903.27 ± 1.26 *2.46 ± 1.381.75 ± 0.97 *1.27 ± 1.10
Unknown180.82 ± 0.821.53 ± 0.970.64 ± 1.390.94 ± 1.541.10 ± 0.97 *2.55 ± 1.72
Paracetamol and metabolites10.01 ± 10.558.94 ± 8.8021.49 ± 22.0221.18 ± 21.317.37 ± 8.166.87 ± 7.40
Paracetamol0.66 ± 0.511.08 ± 1.050.79 ± 0.78 *1.40 ± 2.140.50 ± 0.520.73 ± 1.30
Paracetamol Glucoronide7.26 ± 8.486.23 ± 6.8116.62 ± 17.5915.49 ± 15.895.59 ± 6.825.01 ± 5.73
Paracetamol Sulfate2.09 ± 2.011.63 ± 1.554.08 ± 4.294.29 ± 4.391.28 ± 1.041.13 ± 1.13
All Other Solutes42.72 ± 8.43 *53.84 ± 6.7926.97 ± 7.8828.80 ± 7.9322.95 ± 3.65 *24.64 ± 3.71
* Note: Start values with asterisk indicate significant statistical differences (p < 0.05) between the values for start and end spent dialysate samples.
An alternative grouping of solutes was done on the basis of solutes’ Removal Ratios (RR) during the dialysis (Table 3). RR values for all the detected chromatographic peaks were calculated, and these values were compared with RRs of other chromatographic peaks using Student’s t-test. Chromatographic peaks the RRs of which were not significantly different were grouped together. Four groups with statistically different RR values were created. Creatinine, which had statistically different RR from both “High RR 1” and “High RR 2” groups, was placed under the latter group in Table 3 as the average RR value was closer to this group. Group of AOS were included to the group “High RR 2” as the RR values were statistically indifferent. The RR value of group of AOS corresponds to the summated change of peaks for the whole group, since it was impossible to evaluate the RR values for single peaks due to low concentration and/or insufficient separation on “end” chromatograms.
基于溶质在透析过程中的去除率(RR),进行了另一种分组(表 3)。计算了所有检测到的色谱峰的 RR 值,并使用 Student’s t 检验将这些值与其他色谱峰的 RR 值进行比较。将 RR 值无显著差异的色谱峰归为一组。创建了四个具有统计学差异的 RR 值组。由于平均 RR 值更接近“高 RR2”组,肌酐被归入“高 RR2”组(表 3)。AOS 组被归入“高 RR2”组,因为其 RR 值无统计学差异。AOS 组的 RR 值对应于整个组色谱峰的总变化,由于单个峰的浓度低且/或在“末端”色谱图上分离不足,无法评估单个峰的 RR 值。
Table 3. Grouping of the solutes according to the removal ratio (RR), mean ± SD (%).
表 3. 根据清除率(RR)分组的溶质,均值±SD(%)。
Table 3. Grouping of the solutes according to the removal ratio (RR), mean ± SD (%).
High RR 1High RR 2Low RRUnstable RR
UA69.0 ± 11.2Creatinine63.1 ± 10.3IS48.1 ± 13.2Trp32.7 ± 23.0
HA68.4 ± 10.4Unknown 162.1 ± 9.0 PAR.14.4 ± 64.4
Unknown1072.7 ± 9.6Unknown 462.3 ± 10.3 Unknown 18−131.0 ± 309.1
PAR.Gluc71.9 ± 15.0Unknown 860.9 ± 10.5
PAR.Sulf64.4 ± 24.0All other molecules63.9 ± 11.1
As Table 3 shows, the most indicative marker of low RR compounds in terms of UV-monitoring of the dialysis appears to be indoxyl sulfate without any severe rivalry by other common UV-chromophores in the spent dialysate.
如表 3 所示,在使用 UV 监测透析剂量时,最能反映低 RR 化合物的指标似乎是吲哚酚硫酸盐,而其他常见的 UV 吸收物质在透析液中对其的竞争影响并不严重。
Recalculated average relative contributions (Mean ± SD) for alternative grouping based on RR values are given in Table 4. The groups with the highest RR, “High RR 1” and “High RR 2”, play a major role both at 280 and 254 nm. Also, they remain prevalent contributors at 210 nm. Both at 280 nm and 254 nm, the “High RR 1” and “High RR 2” groups together are responsible for around 95% of the total UV absorbance (Figure 4). The contribution of the IS as a marker of retention solutes with low RR remains inconsiderable at all wavelengths tested.
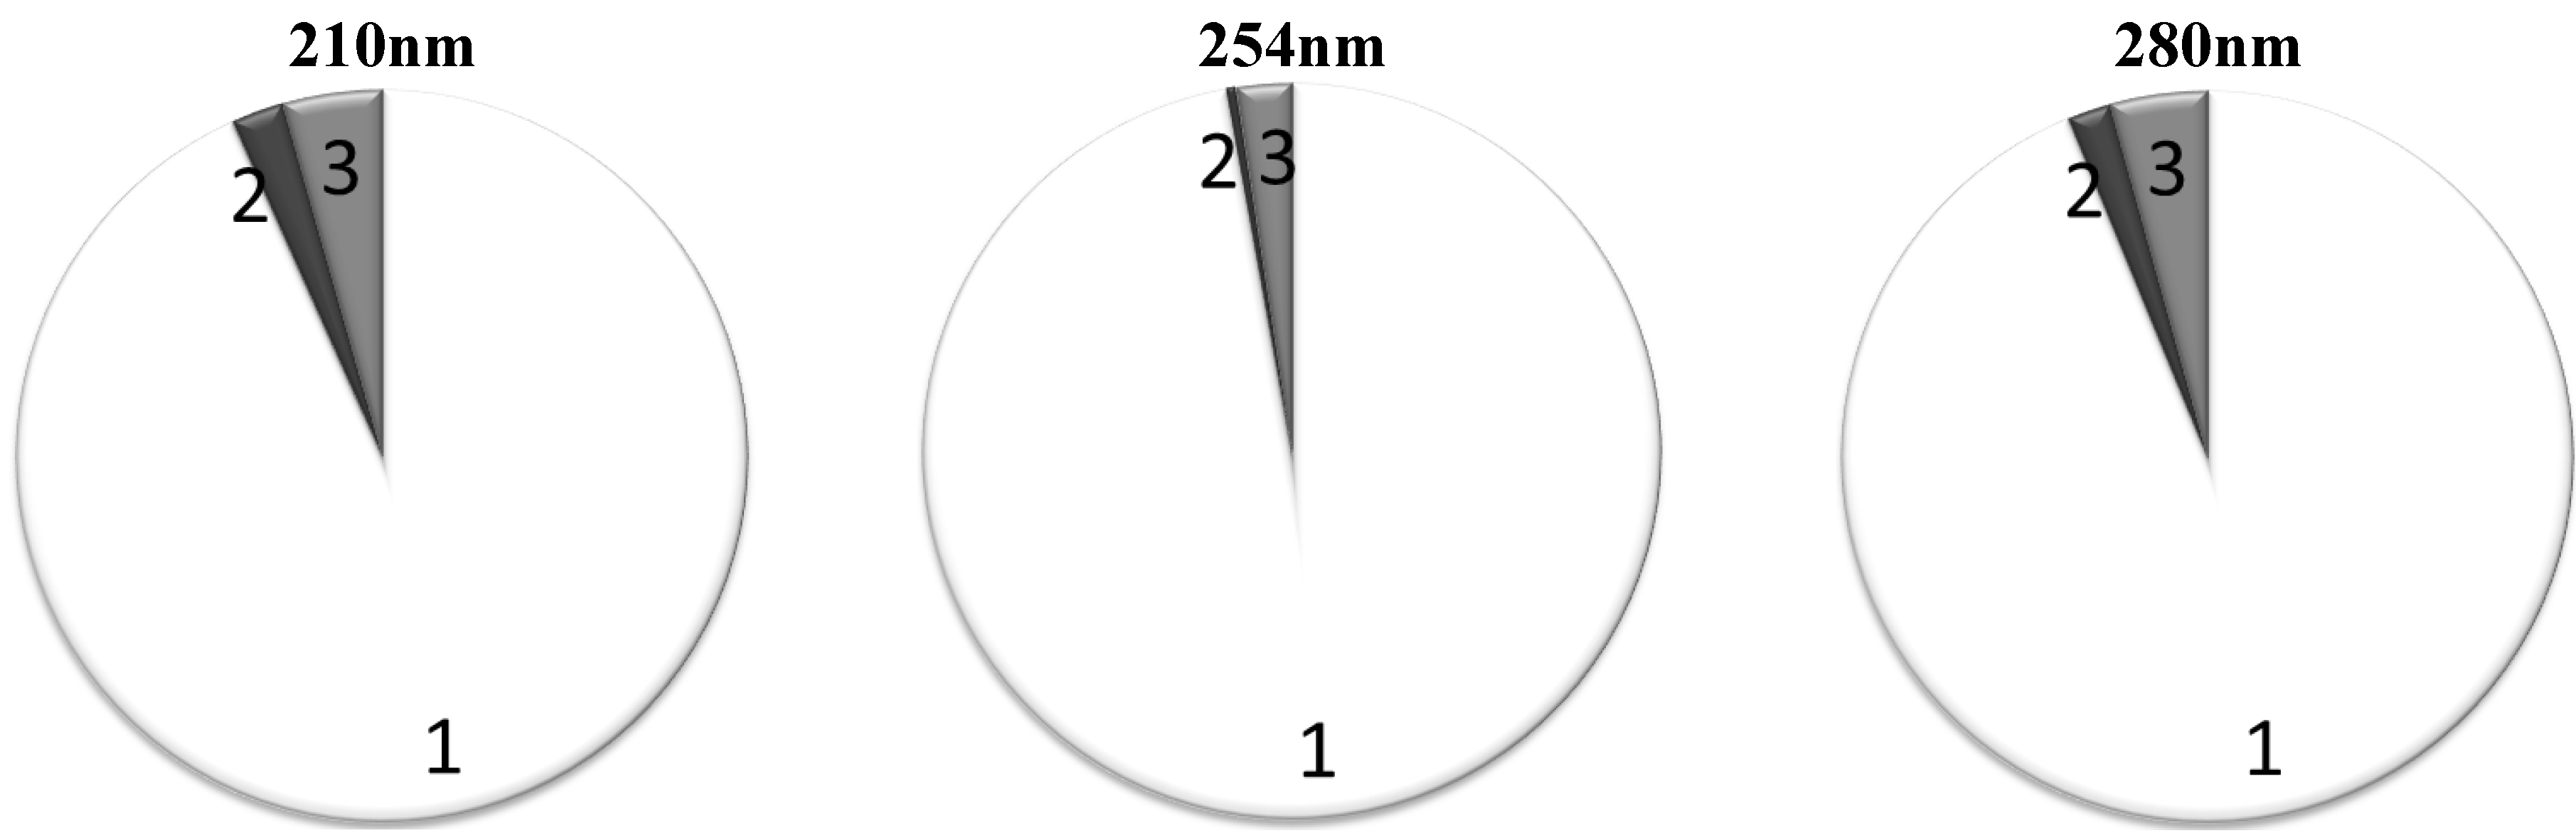
表 4 给出了基于 RR 值的替代分组的平均相对贡献(均值±标准差)。RR 值最高的“高 RR1”和“高 RR2”组在 280 nm 和 254 nm 波长下起主要作用,同时在 210 nm 波长下仍然为主要贡献者。在 280 nm 和 254 nm 波长下,“高 RR1”和“高 RR2”组共同负责约 95%的总 UV 吸光度(图 4)。吲哚酚硫酸盐作为保留溶质低 RR 的标志物的贡献在整个测试的波长下都微不足道。
Figure 4 shows the average contribution to the total UV absorbance from the chromophores belonging into different RR based groups when the “High RR 1” and “High RR 2” groups were put together.
图 4 显示了当“高 RR 1”和“高 RR 2”组合并时,属于不同 RR 基团的色基对总 UV 吸光度的平均贡献。
Table 4. Average contributions in percent of RR based groups of chromophores to the total UV absorbance in the spent dialysate (Mean ± SD).
表 4. 基于 RR 基团的色基对透析液总 UV 吸光度的平均贡献百分比(均值±标准差)。
Table 4. Average contributions in percent of RR based groups of chromophores to the total UV absorbance in the spent dialysate (Mean ± SD).
High RR 1High RR 2Low RRUnstable RR
210 nmStart28.69 ± 11.28 *66.26 ± 10.50 *1.89 ± 0.79 *3.16 ± 1.23 *
End20.79 ± 8.2471.31 ± 8.242.57 ± 1.045.32 ± 1.31
254 nmStart43.89 ± 18.6853.74 ± 18.010.44 ± 0.381.94 ± 1.50 *
End39.79 ± 15.8457.03 ± 16.850.33 ± 0.462.85 ± 2.46
280 nmStart59.88 ± 6.78 *35.90 ± 7.281.42 ± 0.50 *2.81 ± 1.10 *
End53.30 ± 6.2338.57 ± 6.552.44 ± 1.135.68 ± 2.01
* Note: Start values with asterisk indicate significant statistical difference (p < 0.05) between the values of start and end spent dialysate samples.
Figure 4. Average contribution to the total UV absorbance in percentage from the chromophores belonging to different RR groups, the criterion for the “High RR sum” group inclusion was average RR > 60%: 1: Solutes with high RR; 2: Solutes with low RR; 3: Solutes with unstable RR.
图 4. 属于不同 RR 组的色基对总 UV 吸光度的平均贡献百分比,高 RR 总和组的纳入标准为平均 RR>60%:1:高 RR 的溶质;2:低 RR 的溶质;3:RR 不稳定溶质。
Figure 4. Average contribution to the total UV absorbance in percentage from the chromophores belonging to different RR groups, the criterion for the “High RR sum” group inclusion was average RR > 60%: 1: Solutes with high RR; 2: Solutes with low RR; 3: Solutes with unstable RR.
Toxins 04 00849 g004

3. Discussion  3. 讨论

This study adds an exciting supplement to the current knowledge about the removal dynamics of different chromophores and contributions to the total UV absorbance. The results indicate that: (i) a predominant part (>95%) of the UV absorbance signal in the spent dialysate originates from easily dialyzed uremic solutes with a high removal ratio, like uric acid; (ii) a noteworthy role of Paracetamol and its metabolites in the UV absorbance signal was determined at all three wavelengths; (iii) the contribution of UA changes during the dialysis treatment due to more efficient removal of small water soluble solutes, resulting in an increased contribution in other molecules; (iv) UV absorbance cannot be utilized to monitor the removal of slowly dialyzed uremic solutes (e.g., indoxyl sulfate); (v) an alternative grouping for uremic solutes based on removal ratios is proposed; (vi) a significant part of UV absorbance is caused by unidentified molecules.
本研究为当前关于不同色团去除动力学及其对总 UV 吸光度贡献的知识增添了令人兴奋的补充。结果表明:(i)废弃透析液中的 UV 吸光度信号主要(>95%)来自易于透析的尿毒症溶质,如尿酸,这些溶质具有较高的去除率;(ii)在所有三个波长下,对乙酰氨基酚及其代谢物在 UV 吸光度信号中发挥了显著作用;(iii)尿酸的贡献在透析治疗过程中会因更有效地去除小水溶性溶质而发生变化,导致其他分子的贡献增加;(iv)UV 吸光度不能用于监测缓慢透析的尿毒症溶质(如吲哚酚硫酸盐)的去除;(v)提出了基于去除率对尿毒症溶质的另一种分组方法;(vi)UV 吸光度的一部分是由未识别的分子引起的。
Earlier research by Schoots [19] has found that removal ratios for known uremic toxins vary for each solute due to changes in protein binding during the dialysis treatment for protein-bound solutes and changes in clearances for different solutes. It can be concluded from the results presented in this work that a predominant part, roughly 95% of UV-absorbing uremic solutes in the range of absorbance between 254 and 280 nm, evidently do not belong to the group of firmly protein bound substances. The result does not support the earlier conclusion [4] that the UV absorbance at 254 nm should enable one to follow the elimination of accumulated plasma components with particular emphasis on slowly diffusible organic compounds of known or assumed toxicity. This study and several other earlier studies [19,20,21] have indicated that a major part of the UV signal originates from the small toxic solute of UA, which enables online monitoring of UA [22]. The small water soluble molecule, UA, has the most important role at the wavelength 280 nm where it is responsible for a major part of the total UV absorbance: the mean contribution of UA was about half (48%). The average removal ratio of the UA 69% is comparable to that of a traditional marker urea 71% in this study (unpublished result). These observations strongly empower the spreading practice of using online UV-monitoring to evaluate the dialysis process and to calculate a dialysis dose (KtV value) [23]. Furthermore, recent unpublished results from our research group show very good correlation between the UA concentration and the UV-signal at 300 nm [24]. The current study has described contributions of UA at three lower wavelengths where large variations in contributions may occur, which leads to a need for a multiwavelength approach.
早期研究[19]发现,已知的尿毒症毒素在透析治疗过程中由于蛋白质结合的变化,以及不同溶质清除率的变化,其去除率各不相同。本研究结果表明,在 254 至 280 nm 吸光度范围内,约 95%的尿毒症溶质具有紫外吸收特性,显然不属于牢固结合的蛋白质物质。这一结果不支持先前的结论[4],即 254 nm 的紫外吸收可以用来监测累积血浆成分的消除,特别是缓慢扩散的已知或假设有毒的有机化合物。本研究和其他一些早期研究[19, 20, 21]表明,大部分紫外信号来源于小分子尿酸(UA),这使得 UA 可以进行在线监测[22]。在 280 nm 波长处,小水溶性分子 UA 对总紫外吸收的贡献最大,平均贡献率为 48%。 本研究(未发表结果)中,UA 的平均去除率为 69%,与传统标志物尿素 71%的去除率相当。这些观察结果强烈支持使用在线紫外监测来评估透析过程并计算透析剂量(KtV 值)[23]。此外,我们研究组最近的未发表结果显示,UA 浓度与 300 nm 处的紫外信号之间有很好的相关性[24]。当前研究描述了在三个较低波长下 UA 的贡献,由于贡献可能有很大变化,因此需要采用多波长方法。
During the dialysis both the contribution of UA and that of PAR metabolites decrease slightly on account of other chromophores. It can be interpreted as the result of increased relative contribution of protein-bound solutes in the dialysate to the total UV absorbance due to quicker removal of water-soluble fraction, but changes are quite small and with remarkable deviations. The same concerns changes followed at 254 nm, which scarcely can be altered in this study by PAR and metabolites with absorbance maximum is in this region [25]. Those results by our group confirm that also the total UV-absorption of the spent dialysate as a marker for dialysis adequacy assessment marks quite closely the same range of small water-soluble uremic solute removal as urea analysis in the serum of patients and the UA analysis in the spent dialysate. On the other hand, it means that UV-monitoring has also the same deficiencies as the urea analysis and cannot add a substantially new quality to the adequacy assessment in addition to immediacy and handiness already verified.
在透析过程中,UA 和 PAR 代谢物的贡献都略有减少,这可以解释为由于快速去除水溶性部分,透析液中蛋白质结合溶质的相对贡献增加导致总 UV 吸收增加的结果,但变化非常小且有显著偏差。同样,254 nm 处的变化也几乎无法通过 PAR 和代谢物来改变,在这个波长区域吸收峰最大[25]。我们团队的研究结果证实,透析液中总 UV 吸收作为透析充分性评估的标志,与患者血清中的尿素分析和透析液中的 UA 分析所标记的相同范围的小水溶性尿毒症溶质去除范围非常接近。另一方面,这意味着 UV 监测也有与尿素分析相同的缺陷,并且不能在已经验证的即时性和便捷性之外提供实质性的新质量。
Since the removal of protein bound solutes is a highly relevant topic in the current dialysis practice [26], an alternative approach was proposed in this work by grouping the peaks-solutes also according to the removal ratios (Table 3). Surprisingly, it turned out that the RR-values of the prevalent majority of UV chromophores are quite comparable with those of the small uremic toxin UA and only the protein bound uremic toxin IS is the single clearly distinguishable UV peak on the chromatograms, which can be used as a marker of a slowly removable fraction for online monitoring of the dialysis process. Unfortunately, the total contribution of IS to the total absorbance is so negligible, from 0.3% at 254 nm up to 2.5% at 280 nm (Figure 4), that it seems impossible to follow the removal of this marker and protein bound solutes in total by means of online UV monitoring of the dialysis. A novel promising method has been proposed lately for monitoring the removal of IS, a known protein-bound solute and uremic toxin, with a low removal ratio, utilizing fluorescence [27].
由于蛋白质结合溶质的清除在当前的透析实践中是一个非常相关的话题[26],本研究中提出了一种替代方法,即将峰-溶质也根据清除率进行分组(表 3)。令人惊讶的是,大多数 UV 色原的 RR 值与小尿毒症毒素 UA 的清除率相当,只有蛋白质结合的尿毒症毒素 IS 在色谱图上是唯一明显可区分的 UV 峰,可以作为缓慢可清除组分的标志物,用于在线监测透析过程。不幸的是,IS 对总吸光度的总贡献非常微小,从 254 nm 的 0.3%到 280 nm 的 2.5%(图 4),似乎无法通过在线 UV 监测透析过程来跟踪这一标志物和蛋白质结合溶质的清除。最近提出了一种新的有前途的方法,利用荧光监测 IS 的清除,这是一种已知的蛋白质结合溶质和尿毒症毒素,其清除率较低[27]。

4. Materials and Methods
4. 材料与方法

4.1. Clinical Study  4.1. 临床研究

The study was performed after approval of the protocol by the Regional Ethical Review Board, Linköping, Sweden. A written informed consent was obtained from all participating patients. The study included eight patients, one female and seven male, mean age 77 ± 7 years, being on chronic three-weekly hemodialysis (HD) and high volume post-dilutional online-HDF (ol-HDF) treatment at the Department of Nephrology, Linköping, Sweden. A high-flux dialyzer FX 80 during the HD sessions and FX 800 during ol-HDF was used and the dialysis machine was Fresenius 5008H (all from the Fresenius Medical Care, Germany). The dialysate flow was 500 mL/min, the blood flow varied between 280 and 350 mL/min. The auto subsystem mode for the calculation of the online prepared substitution fluid by the dialysis machine was used, based on total protein and hematocrit. The substitution fluid volume during the ol-HDF sessions varied between 12.2 and 29.7 liters per session (mean 21.9).
该研究在获得瑞典林雪平地区伦理审查委员会批准后进行。所有参与患者的书面知情同意书均已获得。研究包括 8 名患者,其中 1 名女性,7 名男性,平均年龄 77 ± 7 岁,均接受瑞典林雪平地区肾内科每三周一次的常规血液透析(HD)和高体积后稀释在线高容量血液透析滤过(ol-HDF)治疗。血液透析期间使用高通量透析器 FX 80,ol-HDF 期间使用 FX 800,透析机为费森尤斯 5008H(均为费森尤斯医疗保健公司生产)。透析液流量为 500 mL/min,血流量在 280 至 350 mL/min 之间变化。透析机根据总蛋白和血细胞比容自动计算在线准备的置换液,每次 ol-HDF 会话的置换液体积在 12.2 至 29.7 升之间(平均 21.9 升)。
Patient treatments were monitored during three consecutive hemodialysis sessions with duration from 180 to 270 min (totally 24 HD and 24 ol-HDF sessions). During the dialysis the following dialysate samples were taken: (1) 10 min after the start of the dialysis session; (2) at the very end of the treatment, and (3) from the dialysate/ultrafiltrate collection tank after careful stirring. Sampling at the moments of self-tests of the dialysis machine was avoided. Pure dialysate was collected as the reference solution before the start of a dialysis session, when the dialysis machine was prepared for startup and the conductivity was stable.
患者在连续三次透析会话中接受了治疗,每次透析时长从 180 分钟到 270 分钟不等(总共 24 次血液透析和 24 次在线高通量透析会话)。在透析过程中,采集了以下透析液样本:(1)透析会话开始后 10 分钟;(2)治疗结束时;(3)从透析液/超滤液收集罐中取样,但需仔细搅拌。避免在透析机自我检测时刻采集样本。在透析会话开始前,当透析机准备启动且电导率稳定时,收集纯透析液作为参考溶液。

4.2. HPLC Study  4.2. 高效液相色谱研究

All dialysate samples were acidified down to pH 4.0 with formic acid before the high performance liquid chromatography (HPLC) analysis for conformation with the pH of the chromatographic eluent used. The HPLC system consisted of a quaternary gradient pump unit, a column oven, and a diode array spectrophotometric detector (DAD, all Ultimate 3000 Series instruments from Dionex (Sunnyvale, CA, USA), and Zorbax C18 4.6 × 250 mm column from Agilent Instruments (Wilmington, DE, USA) with a security guard KJO-4282 from Phenomenex (Torrance, CA, USA). The eluent was mixed with 0.05 M formic acid adjusted to pH 4.0 with ammonium hydroxide (A), HPLC grade methanol (B) and HPLC-S grade acetonitrile (C), both from Rathburn (Walkerburn, Scotland). The three-step linear gradient elution program was used, as specified in Table 5.
所有透析液样本在进行高效液相色谱(HPLC)分析以确认色谱洗脱液的 pH 值之前,均用甲酸酸化至 pH 4.0。HPLC 系统包括四元梯度泵单元、柱温箱和二极管阵列紫外检测器(DAD,均为来自美国桑尼韦尔 Dionex 公司的 Ultimate 3000 系列仪器),以及来自美国威尔明顿 Agilent 仪器公司的 Zorbax C18 4.6×250 mm 柱和来自美国托伦斯 Phenomenex 公司的安全保护柱 KJO-4282。洗脱液由 0.05 M 甲酸(用氨水调节 pH 至 4.0,A)、HPLC 级甲醇(B)和 HPLC-S 级乙腈(C)组成,均来自苏格兰沃克伯恩的 Rathburn。采用三步线性梯度洗脱程序,如表 5 所示。
Table 5. HPLC gradient program.
表 5. 高效液相色谱梯度程序。
Table 5. HPLC gradient program.
StepTime (min)Buffer (A) %Methanol (B) % Acetonitrile (C) %
0010000
13060364
2510819
3410819
The total flow rate of 1 mL/min was used continuously at the column temperature of 30 °C. The UV absorbance was monitored at 210, 254 and 280 nm with a measurement interval of 500 ms. Spectra were registered between 200 and 400 nm with a time interval of 0.50 s, data was processed by Chromeleon 6.8 software (Dionex, USA).
总流速为 1 mL/min,连续在 30 °C 的柱温下使用。在 210、254 和 280 nm 处监测紫外吸收,测量间隔为 500 ms。在 200 至 400 nm 之间记录光谱,时间间隔为 0.50 s,数据由 Dionex 公司生产的 Chromeleon 6.8 软件处理。
Every peak in the HPLC chromatograms was characterized by the characteristic absorption spectrum and by the retention time. Peaks were identified by comparing the retention time, absorption spectrum and MS/MS mass spectrum data (micrOTOF-Q II, Bruker, Germany) of a compound found in the sample with a pure authentic compound. The relative contribution (RC) for the i-th chromatographic peak (presumably solute) to the sum of UV absorbances of all peaks for a chromatogram was calculated as a ratio of the area of the i-th peak (Apeak i) to the total area of all peaks appeared on the chromatogram (Atotal):
HPLC 色谱图中的每个峰通过特征吸收光谱和保留时间来表征。峰通过将样品中发现的化合物与纯标准品的保留时间、吸收光谱和 MS/MS 质谱数据(micrOTOF-Q II,Bruker,德国)进行比较来识别。第 i 个色谱峰(疑似溶质)对色谱图中所有峰的紫外吸收总和的相对贡献(RC)计算为第 i 个峰的面积(A peak i )与色谱图上所有峰的总面积(A total )之比:
Toxins 04 00849 i001
The contribution values of peaks with similar retention time were averaged separately and depending on the sampling time for all spent dialysate samples from the start and end, also for all of the samples in total. Relative contribution (RC) for a specific solute group “j” was calculated analogically to RCi:
相似保留时间峰的贡献值分别单独平均,并根据采样时间计算所有使用过的透析液样本从开始到结束的贡献值,以及所有样本的总贡献值。特定溶质组“j”的相对贡献(RC)计算方式与 RC 类似:
Toxins 04 00849 i002
The removal ratio (RR) of a specific i-th peak (uremic solute) for a dialysis session was defined as a function of the start and end HPLC peak areas (Astart iand Aend i) of the samples from the dialysis session:
该次透析会话中特定-个峰(尿毒症溶质)的去除率(RR)被定义为透析会话样品的开始和结束 HPLC 峰面积(A start i 和 A end i )的函数:
Toxins 04 00849 i003
Statistical analysis was done with Microsoft Excel 2010 (Microsoft Corporation, USA). Student’s t-test was used to compare Two-Sample dataset, Assuming Unequal Variances, while p < 0.05 was considered significant.
统计分析使用了 Microsoft Excel 2010(Microsoft Corporation,美国)。使用 Student’s t 检验比较两样本数据集,假设方差不等,当 p < 0.05 时认为具有统计学意义。

5. Conclusion  5. 结论

The focus of this study was on the contributions of the different chromophores in the UV-absorbance signal of the spent dialysate at different wavelengths. UV signal has been proven to describe elimination of easily dialyzed uremic solutes with a high removal ratio [13,14], fully confirmed by the results published in this article. A predominant part of the UV absorption comes from uremic solutes with a high removal ratio not depending on the wavelength of measurements (Figure 4); among these the small molecule of the uric acid is of major importance. The contribution values have high standard deviation values, which indicate remarkable differences of contributions between different dialysis sessions and different patients. At the same time, significant appearance of Paracetamol and its metabolites was detected in the UV-signal, showing that not all of the major UV-absorbing solutes are uremic toxins. While the UV absorbance signal describes the removal of uremic solutes with a high removal ratio very well, it provides scarce information about other molecules, such as slowly removed uremic solutes like indoxyl sulfate. Therefore, the search for a universal, trustworthy, robust and cheap non-invasive dialysis monitoring method is still ongoing.
本研究的重点在于不同色团在不同波长下透析液废弃液 UV 吸收信号中的贡献。UV 信号已被证明能够描述高去除率尿毒症溶质的清除情况,这一点由本文发表的结果完全证实了这一点。UV 吸收的主要部分来自高去除率的尿毒症溶质,这些溶质的去除与测量波长无关(图 4),其中尿酸的小分子尤为重要。贡献值的标准偏差很大,这表明不同透析会和不同患者之间的贡献差异显著。同时,在 UV 信号中检测到了对乙酰氨基酚及其代谢物的显著出现,表明并非所有主要的 UV 吸收溶质都是尿毒症毒素。虽然 UV 吸收信号很好地描述了高去除率尿毒症溶质的清除情况,但它对其他分子,如吲哚酚硫酸盐等低清除率的尿毒症溶质提供的信息很少。 因此,寻找一种通用的、可靠的、廉价的非侵入性透析监测方法的工作仍在进行中。

Conflict of Interest  利益冲突

The authors declare no conflict of interest.
作者声明无利益冲突。

Acknowledgments  致谢

The authors wish to thank all of the dialysis patients who participated in the experiments. The research was supported in part by the County Council of Östergötland, Sweden, the Estonian Science Foundation Grant no. 8621, the Estonian Targeted Financing Project SF0140027s07, and the European Union through the European Regional Development Fund.
作者感谢所有参与实验的透析患者。该研究得到了瑞典东哥特兰县议会、爱沙尼亚科学基金会项目编号 8621、爱沙尼亚目标资助项目 SF0140027s07 以及欧盟通过欧洲地区发展基金的部分支持。

References  参考文献

  1. Beto, J.; Bansal, V. Variation in blood sample collection for determination of hemodialysis adequacy. Am. J. Kidney Dis. 1998, 31, 135–141. [Google Scholar] [CrossRef]
    Beto, J.; Bansal, V. 透析充分性测定的血液样本采集变异。美国肾脏病学会杂志 1998, 31, 135–141. [ Google Scholar] [ 跨引文]
  2. Johnson, W.; Hagge, W. Effects of urea loading in patients with far-advanced renal failure. Mayo Clinic Proc. 1972, 47, 21–29. [Google Scholar]
    Johnson, W.; Hagge, W. 远端肾功能衰竭患者尿素负荷的影响。梅奥临床 proceedings 1972, 47, 21–29. [ Google Scholar]
  3. Krieter, D.; Hackl, A. Protein-bound uraemic toxin removal in haemodialysis and post-dilution haemodiafiltration. Nephrol. Dial. Transplant. 2010, 25, 212–218. [Google Scholar] [CrossRef]
    Krieter, D.; Hackl, A. 血液透析和后稀释血液透析滤过中蛋白质结合尿毒物质的清除。肾病透析移植 2010, 25, 212–218. [ Google Scholar] [ 跨引文]
  4. Gal, G.; Grof, J. Continuous UV photometric monitoring of the efficiency of hemodialysis. Int. J. Artif. Organs 1980, 3, 338–341. [Google Scholar]
    Gal, G.; Grof, J. 血液透析效率的连续紫外光谱监测。人工器官国际杂志 1980, 3, 338–341. [ Google Scholar]
  5. Polaschegg, H. Automatic, non-invasive intradialytic clearance measurement. Int. J. Artif. Organs 1993, 16, 185–191. [Google Scholar]
    Polaschegg, H. 自动化、无创的间析清除率测量. 国际人工器官杂志 1993, 16, 185–191. [ Google Scholar]
  6. Petitclerc, T.; Goux, N. A model for non-invasive estimation of in vivo dialyzer perfomances and patient’s conductivity during hemodialysis. Int. J. Artif. Organs 1993, 16, 585–591. [Google Scholar]
    Petitclerc, T.; Goux, N. 一种用于血液透析期间无创估算透析器性能和患者电导率的模型. 国际人工器官杂志 1993, 16, 585–591. [ Google Scholar]
  7. Lindley, E.; de Vos, J. On line UV-adsorbance measurements. Summary of the EDTNA/ERCA journal club discussion. Summer 2006. J. Renal Care 2006, 33, 41–48. [Google Scholar] [CrossRef]
    Lindley, E.; de Vos, J. 在线紫外吸收测量. EDTNA/ERCA 期刊俱乐部讨论摘要. 2006 年夏季. 肾脏护理杂志 2006, 33, 41–48. [ Google Scholar] [ CrossRef]
  8. Keshaviah, P.; Ebben, J. Clinical evaluation of a new on-line monitor of dialysis adequacy. J. Am. Soc. Nephrol. 1992, 3, 374. [Google Scholar]
    Keshaviah, P.; Ebben, J. 一种新的在线监测透析充分性的临床评估. 美国肾脏学会杂志 1992, 3, 374. [ Google Scholar]
  9. Keshaviah, P.; Ebben, J. On-line monitoring of the delivery of the hemodialysis prescription. Pediatri. Nephrol. 1995, 9, S2–S8. [Google Scholar] [CrossRef]
    Keshaviah, P.; Ebben, J. 在线监测血液透析处方的输送。儿科肾病学 1995, 9, S2–S8. [ Google Scholar] [ 跨引文]
  10. Lim, P.S.; Lee, H. Evaluation of pre- and postdilutional on-line hemodiafiltration adequacy by partial dialysate quantification and on-line urea monitor. Blood Purif. 1999, 17, 199–205. [Google Scholar] [CrossRef]
    Lim, P.S.; Lee, H. 通过部分透析液定量和在线尿素监测评估预稀释和后稀释在线血液透析滤过充分性。血液净化 1999, 17, 199–205. [ Google Scholar] [ 跨引文]
  11. Uhlin, F.; Fridolin, I. Estimation of delivered dialysis dose by on-line monitoring of the UV-absorbance in the spent dialysate. Am. J. Kidney Dis. 2003, 41, 1026–1036. [Google Scholar] [CrossRef]
    Uhlin, F.; Fridolin, I. 通过监测使用过的透析液的紫外吸收在线估算透析剂量。美国肾脏病学杂志 2003, 41, 1026–1036. [ Google Scholar] [ 跨引文]
  12. Scherbakov, A.; Fridolin, I. Dialysis Adequacy On-line Monitoring Using DiaSens Optical Sensor: Technique and Clinical Application. In Proceedings of 14th Nordic-Baltic Conference on Biomedical Engineering and Medical Physics, NBC-2008, Riga, Latvia, 16–20 June 2008.
    Scherbakov, A.; Fridolin, I. 使用 DiaSens 光学传感器在线监测透析充分性:技术及临床应用。在:第 14 届北欧-波罗的海生物医学工程与医学物理会议(NBC-2008)论文集;里加,拉脱维亚;2008 年 6 月 16-20 日。
  13. Fridolin, I.; Magnusson, M. On-line monitoring of solutes in dialysate using absorption of ultraviolet radiation: Technique description. Int. J. Artif. Organs 2002, 25, 748–761. [Google Scholar]
    弗里多林, I.; 马格努森, M. 使用紫外线吸收监测透析液中溶质的在线监测技术描述. 国际人工器官杂志 2002, 25, 748–761. [ Google Scholar]
  14. Uhlin, F.; Fridolin, I. Dialysis dose (Kt/V) and clearance variation sensitivity using measurement of ultraviolet-absorbance (on-line), blood urea, dialysate urea and ionic dialysanc. Nephrol. Dial. Transplant. 2006, 21, 2225–2231. [Google Scholar] [CrossRef]
    乌胡林, F.; 弗里多林, I. 使用紫外线吸收(在线)测量尿素清除率(Kt/V)和清除率变异敏感性,血液尿素、透析液尿素和离子透析液. 肾脏病学杂志 2006, 21, 2225–2231. [ Google Scholar] [ CrossRef]
  15. Castellarnau, A.; Werner, M. Real-time Kt/V determination by ultraviolet absorbance in spent dialysate: technique validation. Kidney Int. 2010, 78, 920–925. [Google Scholar]
    卡斯尔拉努, A.; 维纳尔, M. 废弃透析液中紫外线吸收实时 Kt/V 测定技术验证. 肾脏国际 2010, 78, 920–925. [ Google Scholar]
  16. Daugirdas, J.T.; Tattersall, J. Automated monitoring of hemodialysis adequacy by dialysis machines: Potential benefits to patients and cost savings. Kidney Int. 2010, 78, 833–835. [Google Scholar] [CrossRef]
    达吉尔达斯, J.T.; 塔特勒斯, J. 透析机器自动监测透析充分性:对患者的好处和成本节约潜力. 肾脏国际 2010, 78, 833–835. [ Google Scholar] [ CrossRef]
  17. Vanholder, R.; de Smet, R. Review on uremic toxins: Classification, concentration, and interindividual variability. Kidney Int. 2003, 63, 1934–1943. [Google Scholar] [CrossRef]
    范霍尔德, R.; 德斯梅特, R. 透析毒素的回顾:分类、浓度及个体差异。《肾脏国际》. 2003, 63, 1934-1943. [ Google Scholar] [ 跨引]
  18. Uhlin, F.; Fridolin, I. Optical Monitoring of Dialysis Dose. In Modeling and Control of Dialysis Systems; Azar, A.T., Ed.; Studies in Computation Intelligence; Springer-Verlag: Berlin/Heidelberg, Germany, 2013; Volume 405, pp. 867–928. [Google Scholar]
    Uhlin, F.; Fridolin, I. 血液透析剂量的光学监测. 在 Azar, A.T. 编著的《透析系统建模与控制》一书中;斯普林格-维尔赫姆/海德堡出版社, 德国, 2013 年;第 405 卷, 第 867-928 页. [Google 学术引用]
  19. Schoots, A.; Peeters, J. Effect of Hemodialysis on Serum Concentrations of HPLC—Analyzed Accumulating Solutes in Uremia. Nephron 1989, 53, 208–217. [Google Scholar] [CrossRef]
    Schoots, A.; Peeters, J. 血液透析对 HPLC 分析的尿毒症累积溶质血清浓度的影响。Nephron 1989, 53, 208–217. [ Google Scholar] [ CrossRef]
  20. Vanholder, R.; de Smet, R. Assessment of urea and other uremic markers for quantification of dialysis efficacy. Clin. Chem. 1992, 38, 1429–1436. [Google Scholar]
    Vanholder, R.; de Smet, R. 尿毒症标志物(如尿素)用于评估透析效果的评估。Clin. Chem. 1992, 38, 1429–1436. [ Google Scholar]
  21. Lauri, K.; Tanner, R. HPLC study of uremic fluids related to optical dialysis adequacy monitoring. Int. J. Artif. Organs 2010, 33, 96–104. [Google Scholar]
    Lauri, K.; Tanner, R. HPLC 对尿毒症液体的研究及其与光学透析充分性监测的关系。Int. J. Artif. Organs 2010, 33, 96–104. [ Google Scholar]
  22. Jerotskaja, J.; Uhlin, F. Concentration of uric acid removed during dialysis. Estimated by multi wavelength and processed ultra violet absorbance spectra. In Proceedings of 32nd Annual International Conference of the IEEE Engineering in Medicine and Biology Society 2010, Buenos Aires, Argentina, 31 August–4 September 2010; pp. 5791–5794.
    Jerotskaja, J.; Uhlin, F. 透析期间尿酸浓度的测定。通过多波长和处理紫外吸收光谱估算。In Proceedings of 32nd Annual International Conference of the IEEE Engineering in Medicine and Biology Society 2010, 布宜诺斯艾利斯, 阿根廷, 2010 年 8 月 31 日至 9 月 4 日; pp. 5791–5794.
  23. Luman, M.; Jerotskaja, J. Dialysis dose and nutrition assessment by optical on-line dialysis adequacy monitor. Clini. Nephrol. 2009, 72, 303–311. [Google Scholar]
    Luman, M.;杰罗茨卡娅, J. 血液透析剂量和营养评估通过光学在线血液透析充分性监测仪。临床肾病学 2009, 72, 303–311. [ Google Scholar]
  24. Holmar, J.; Fridolin, I.; Uhlin, F.; Lauri, K.; Luman, M. Optical Method for Cardiovascular Risk Marker Uric Acid Removal Assessment During Dialysis. Sci. World J. 2012, 2012, 506486:1–506486:8. [Google Scholar]
    霍尔马尔, J.;弗里多林, I.;乌林, F.;拉乌里, K.;卢曼, M. 透析期间尿酸清除评估的光学方法。科学世界杂志 2012, 2012, 506486:1–506486:8. [ Google Scholar]
  25. Tanner, R.; Arund, J. Impact of Paracetamol on Optical On-Line Dialysis Monitoring and on Uricemia. In Proceedings of 49th ERA/EDTA Congress 2012, Paris, France, 24–27 May 2012.
    坦纳, R.;阿伦德, J. 对乙酰氨基酚对光学在线血液透析监测和尿酸血症的影响。在 2012 年第 49 届 ERA/EDTA 会议论文集 中,巴黎,法国,2012 年 5 月 24-27 日。
  26. Sirich, T.; Luo, F. Selectively increasing the clearance of protein-bound uremic solutes. Nephrol. Dial. Transplant. 2012, 27, 1574–1579. [Google Scholar] [CrossRef]
    西里奇, T.;卢欧, F. 选择性增加蛋白质结合尿毒症溶质的清除。肾脏病学杂志 2012, 27, 1574–1579. [ Google Scholar] [ CrossRef]
  27. Holmar, J.; Arund, J. Quantification of Indoxyl Sulphate in the Spent Dialysate Using Fluorescence Spectra. In Proceedings of 15th Nordic-Baltic Conference on Biomedical Engineering and Medical Physics (NBC15), Aalborg, Denmark, 14–17 June 2011.
    Holmar, J.; Arund, J. 使用荧光光谱测定使用过的透析液中的吲哚磺酸。载于 2011 年 6 月 14 日至 17 日在丹麦奥尔堡举行的第 15 届北欧-波罗的海生物医学工程与医学物理会议(NBC15)的会议论文集。

Share and Cite  分享与引用

MDPI and ACS Style  MDPI 和 ACS 风格

Arund, J.; Tanner, R.; Uhlin, F.; Fridolin, I. Do Only Small Uremic Toxins, Chromophores, Contribute to the Online Dialysis Dose Monitoring by UV Absorbance? Toxins 2012, 4, 849-861. https://doi.org/10.3390/toxins4100849
Arund, J.; Tanner, R.; Uhlin, F.; Fridolin, I. 仅小分子尿毒症毒素、色原物质是否仅通过紫外吸收贡献于在线透析剂量监测?毒素 2012, 4, 849-861. https://doi.org/10.3390/toxins4100849

AMA Style  AMA 格式

Arund J, Tanner R, Uhlin F, Fridolin I. Do Only Small Uremic Toxins, Chromophores, Contribute to the Online Dialysis Dose Monitoring by UV Absorbance? Toxins. 2012; 4(10):849-861. https://doi.org/10.3390/toxins4100849
Arund J, Tanner R, Uhlin F, Fridolin I. 仅小分子尿毒症毒素、色原物质是否对在线透析剂量监测的紫外吸收贡献?毒素. 2012; 4(10):849-861. https://doi.org/10.3390/toxins4100849

Chicago/Turabian Style  芝加哥/塔拉伯风格

Arund, Jürgen, Risto Tanner, Fredrik Uhlin, and Ivo Fridolin. 2012. "Do Only Small Uremic Toxins, Chromophores, Contribute to the Online Dialysis Dose Monitoring by UV Absorbance?" Toxins 4, no. 10: 849-861. https://doi.org/10.3390/toxins4100849
Arund, 杰根, 刘斯托, 菲德里克·乌林, 和 费多利·弗里多林. 2012. "Do Only Small Uremic Toxins, Chromophores, Contribute to the Online Dialysis Dose Monitoring by UV Absorbance?" Toxins 4, 期 10: 849-861. https://doi.org/10.3390/toxins4100849

APA Style  APA 格式

Arund, J., Tanner, R., Uhlin, F., & Fridolin, I. (2012). Do Only Small Uremic Toxins, Chromophores, Contribute to the Online Dialysis Dose Monitoring by UV Absorbance? Toxins, 4(10), 849-861. https://doi.org/10.3390/toxins4100849

Article Metrics  文章指标

Citations  引用

Scopus   斯普林格
 
Crossref
 
Web of Science   科学引文索引
 
PubMed
 
PMC
 

Article Access Statistics
文章访问统计

Created with Highcharts 4.0.4Chart context menuArticle access statisticsArticle Views27. Apr28. Apr29. Apr30. Apr1. May2. May3. May4. May5. May6. May7. May8. May9. May10. May11. May12. May13. May14. May15. May16. May17. May18. May19. May20. May21. May22. May23. May24. May25. May26. May27. May28. May29. May30. May31. May1. Jun2. Jun3. Jun4. Jun5. Jun6. Jun7. Jun8. Jun9. Jun10. Jun11. Jun12. Jun13. Jun14. Jun15. Jun16. Jun17. Jun18. Jun19. Jun20. Jun21. Jun22. Jun23. Jun24. Jun25. Jun26. Jun27. Jun28. Jun29. Jun30. Jun1. Jul2. Jul3. Jul4. Jul5. Jul6. Jul7. Jul8. Jul9. Jul10. Jul11. Jul12. Jul13. Jul14. Jul15. Jul16. Jul17. Jul18. Jul19. Jul20. Jul21. Jul22. Jul23. Jul24. Jul25. Jul0k2k4k6k8k10k
For more information on the journal statistics, click here.
如需了解更多期刊统计信息,请点击这里。
Multiple requests from the same IP address are counted as one view.
来自同一 IP 地址的多个请求被视为一次查看。
Back to Top  返回顶部Top
Daugirdas, J.T.; Tattersall, J. Automated monitoring of hemodialysis adequacy by dialysis machines: Potential benefits to patients and cost savings. Kidney Int. 2010, 78, 833–835. [Google Scholar] [CrossRef]